Races in Plano, Texas (TX) Detailed Stats
Data:
Races - White alone (%)
Races - White alone (% change since 2000)
Races - Black alone (%)
Races - Black alone (% change since 2000)
Races - American Indian alone (%)
Races - American Indian alone (% change since 2000)
Races - Asian alone (%)
Races - Asian alone (% change since 2000)
Races - Hispanic (%)
Races - Hispanic (% change since 2000)
Races - Native Hawaiian and Other Pacific Islander alone (%)
Races - Native Hawaiian and Other Pacific Islander alone (% change since 2000)
Races - Two or more races(%)
Races - Two or more races(% change since 2000)
Races - Other race alone (%)
Races - Other race alone (% change since 2000)
Racial diversity
Place of birth - Born in state of residence (%)
Place of birth - Born in state of residence (%) - White
Place of birth - Born in state of residence (%) - Black or African American
Place of birth - Born in state of residence (%) - Asian
Place of birth - Born in state of residence (%) - Hispanic or Latino
Place of birth - Born in state of residence (%) - American Indian and Alaska Native
Place of birth - Born in state of residence (%) - Multirace
Place of birth - Born in state of residence (%) - Other Race
Place of birth - Born in other state (%)
Place of birth - Born in other state (%) - White
Place of birth - Born in other state (%) - Black or African American
Place of birth - Born in other state (%) - Asian
Place of birth - Born in other state (%) - Hispanic or Latino
Place of birth - Born in other state (%) - American Indian and Alaska Native
Place of birth - Born in other state (%) - Multirace
Place of birth - Born in other state (%) - Other Race
Place of birth - Native, outside of US (%)
Place of birth - Native, outside of US (%) - White
Place of birth - Native, outside of US (%) - Black or African American
Place of birth - Native, outside of US (%) - Asian
Place of birth - Native, outside of US (%) - Hispanic or Latino
Place of birth - Native, outside of US (%) - American Indian and Alaska Native
Place of birth - Native, outside of US (%) - Multirace
Place of birth - Native, outside of US (%) - Other Race
Place of birth - Foreign born (%)
Place of birth - Foreign born (%) - White
Place of birth - Foreign born (%) - Black or African American
Place of birth - Foreign born (%) - Asian
Place of birth - Foreign born (%) - Hispanic or Latino
Place of birth - Foreign born (%) - American Indian and Alaska Native
Place of birth - Foreign born (%) - Multirace
Place of birth - Foreign born (%) - Other Race
Residents speaking English at home (%)
Residents speaking English at home - Born in the United States (%)
Residents speaking English at home - Native, born elsewhere (%)
Residents speaking English at home - Foreign born (%)
Residents speaking Spanish at home (%)
Residents speaking Spanish at home - Born in the United States (%)
Residents speaking Spanish at home - Native, born elsewhere (%)
Residents speaking Spanish at home - Foreign born (%)
Residents speaking other language at home (%)
Residents speaking other language at home - Born in the United States (%)
Residents speaking other language at home - Native, born elsewhere (%)
Residents speaking other language at home - Foreign born (%)
Marital status - Never married (%)
Marital status - Now married (%)
Marital status - Separated (%)
Marital status - Widowed (%)
Marital status - Divorced (%)
Ancestries Reported - Arab (%)
Ancestries Reported - Czech (%)
Ancestries Reported - Danish (%)
Ancestries Reported - Dutch (%)
Ancestries Reported - English (%)
Ancestries Reported - French (%)
Ancestries Reported - French Canadian (%)
Ancestries Reported - German (%)
Ancestries Reported - Greek (%)
Ancestries Reported - Hungarian (%)
Ancestries Reported - Irish (%)
Ancestries Reported - Italian (%)
Ancestries Reported - Lithuanian (%)
Ancestries Reported - Norwegian (%)
Ancestries Reported - Polish (%)
Ancestries Reported - Portuguese (%)
Ancestries Reported - Russian (%)
Ancestries Reported - Scotch-Irish (%)
Ancestries Reported - Scottish (%)
Ancestries Reported - Slovak (%)
Ancestries Reported - Subsaharan African (%)
Ancestries Reported - Swedish (%)
Ancestries Reported - Swiss (%)
Ancestries Reported - Ukrainian (%)
Ancestries Reported - United States (%)
Ancestries Reported - Welsh (%)
Ancestries Reported - West Indian (%)
Ancestries Reported - Other (%)
Geographical mobility - Same house 1 year ago (%)
Geographical mobility - Same house 1 year ago (%) - White
Geographical mobility - Same house 1 year ago (%) - Black or African American
Geographical mobility - Same house 1 year ago (%) - Asian
Geographical mobility - Same house 1 year ago (%) - Hispanic or Latino
Geographical mobility - Same house 1 year ago (%) - American Indian and Alaska Native
Geographical mobility - Same house 1 year ago (%) - Multirace
Geographical mobility - Same house 1 year ago (%) - Other Race
Geographical mobility - Moved within same county (%)
Geographical mobility - Moved within same county (%) - White
Geographical mobility - Moved within same county (%) - Black or African American
Geographical mobility - Moved within same county (%) - Asian
Geographical mobility - Moved within same county (%) - Hispanic or Latino
Geographical mobility - Moved within same county (%) - American Indian and Alaska Native
Geographical mobility - Moved within same county (%) - Multirace
Geographical mobility - Moved within same county (%) - Other Race
Geographical mobility - Moved from different county within same state (%)
Geographical mobility - Moved from different county within same state (%) - White
Geographical mobility - Moved from different county within same state (%) - Black or African American
Geographical mobility - Moved from different county within same state (%) - Asian
Geographical mobility - Moved from different county within same state (%) - Hispanic or Latino
Geographical mobility - Moved from different county within same state (%) - American Indian and Alaska Native
Geographical mobility - Moved from different county within same state (%) - Multirace
Geographical mobility - Moved from different county within same state (%) - Other Race
Geographical mobility - Moved from different state (%)
Geographical mobility - Moved from different state (%) - White
Geographical mobility - Moved from different state (%) - Black or African American
Geographical mobility - Moved from different state (%) - Asian
Geographical mobility - Moved from different state (%) - Hispanic or Latino
Geographical mobility - Moved from different state (%) - American Indian and Alaska Native
Geographical mobility - Moved from different state (%) - Multirace
Geographical mobility - Moved from different state (%) - Other Race
Geographical mobility - Moved from abroad (%)
Geographical mobility - Moved from abroad (%) - White
Geographical mobility - Moved from abroad (%) - Black or African American
Geographical mobility - Moved from abroad (%) - Asian
Geographical mobility - Moved from abroad (%) - Hispanic or Latino
Geographical mobility - Moved from abroad (%) - American Indian and Alaska Native
Geographical mobility - Moved from abroad (%) - Multirace
Geographical mobility - Moved from abroad (%) - Other Race
Place of birth for the foreign-born population - Ireland (%)
Place of birth for the foreign-born population - Denmark (%)
Place of birth for the foreign-born population - Norway (%)
Place of birth for the foreign-born population - Sweden (%)
Place of birth for the foreign-born population - United Kingdom (%)
Place of birth for the foreign-born population - England (%)
Place of birth for the foreign-born population - Scotland (%)
Place of birth for the foreign-born population - Other Northern Europe (%)
Place of birth for the foreign-born population - Austria (%)
Place of birth for the foreign-born population - Belgium (%)
Place of birth for the foreign-born population - France (%)
Place of birth for the foreign-born population - Germany (%)
Place of birth for the foreign-born population - Netherlands (%)
Place of birth for the foreign-born population - Switzerland (%)
Place of birth for the foreign-born population - Other Western Europe (%)
Place of birth for the foreign-born population - Greece (%)
Place of birth for the foreign-born population - Italy (%)
Place of birth for the foreign-born population - Portugal (%)
Place of birth for the foreign-born population - Spain (%)
Place of birth for the foreign-born population - Other Southern Europe (%)
Place of birth for the foreign-born population - Albania (%)
Place of birth for the foreign-born population - Belarus (%)
Place of birth for the foreign-born population - Bosnia and Herzegovina (%)
Place of birth for the foreign-born population - Bulgaria (%)
Place of birth for the foreign-born population - Croatia (%)
Place of birth for the foreign-born population - Czechoslovakia (%)
Place of birth for the foreign-born population - Hungary (%)
Place of birth for the foreign-born population - Latvia (%)
Place of birth for the foreign-born population - Lithuania (%)
Place of birth for the foreign-born population - North Macedonia (Macedonia) (%)
Place of birth for the foreign-born population - Moldova (%)
Place of birth for the foreign-born population - Poland (%)
Place of birth for the foreign-born population - Romania (%)
Place of birth for the foreign-born population - Russia (%)
Place of birth for the foreign-born population - Serbia (%)
Place of birth for the foreign-born population - Ukraine (%)
Place of birth for the foreign-born population - Other Eastern Europe (%)
Place of birth for the foreign-born population - China (%)
Place of birth for the foreign-born population - Hong Kong (%)
Place of birth for the foreign-born population - Taiwan (%)
Place of birth for the foreign-born population - Japan (%)
Place of birth for the foreign-born population - Korea (%)
Place of birth for the foreign-born population - Other Eastern Asia (%)
Place of birth for the foreign-born population - Afghanistan (%)
Place of birth for the foreign-born population - Bangladesh (%)
Place of birth for the foreign-born population - India (%)
Place of birth for the foreign-born population - Iran (%)
Place of birth for the foreign-born population - Kazakhstan (%)
Place of birth for the foreign-born population - Nepal (%)
Place of birth for the foreign-born population - Pakistan (%)
Place of birth for the foreign-born population - Sri Lanka (%)
Place of birth for the foreign-born population - Uzbekistan (%)
Place of birth for the foreign-born population - Other South Central Asia (%)
Place of birth for the foreign-born population - Burma (%)
Place of birth for the foreign-born population - Cambodia (%)
Place of birth for the foreign-born population - Indonesia (%)
Place of birth for the foreign-born population - Laos (%)
Place of birth for the foreign-born population - Malaysia (%)
Place of birth for the foreign-born population - Philippines (%)
Place of birth for the foreign-born population - Singapore (%)
Place of birth for the foreign-born population - Thailand (%)
Place of birth for the foreign-born population - Vietnam (%)
Place of birth for the foreign-born population - Other South Eastern Asia (%)
Place of birth for the foreign-born population - Armenia (%)
Place of birth for the foreign-born population - Iraq (%)
Place of birth for the foreign-born population - Israel (%)
Place of birth for the foreign-born population - Jordan (%)
Place of birth for the foreign-born population - Kuwait (%)
Place of birth for the foreign-born population - Lebanon (%)
Place of birth for the foreign-born population - Saudi Arabia (%)
Place of birth for the foreign-born population - Syria (%)
Place of birth for the foreign-born population - Turkey (%)
Place of birth for the foreign-born population - Yemen (%)
Place of birth for the foreign-born population - Other Western Asia (%)
Place of birth for the foreign-born population - Eritrea (%)
Place of birth for the foreign-born population - Ethiopia (%)
Place of birth for the foreign-born population - Kenya (%)
Place of birth for the foreign-born population - Somalia (%)
Place of birth for the foreign-born population - Uganda (%)
Place of birth for the foreign-born population - Zimbabwe (%)
Place of birth for the foreign-born population - Other Eastern Africa (%)
Place of birth for the foreign-born population - Cameroon (%)
Place of birth for the foreign-born population - Congo (%)
Place of birth for the foreign-born population - Democratic Republic of Congo (Zaire) (%)
Place of birth for the foreign-born population - Other Middle Africa (%)
Place of birth for the foreign-born population - Egypt (%)
Place of birth for the foreign-born population - Morocco (%)
Place of birth for the foreign-born population - Sudan (%)
Place of birth for the foreign-born population - Other Northern Africa (%)
Place of birth for the foreign-born population - South Africa (%)
Place of birth for the foreign-born population - Other Southern Africa (%)
Place of birth for the foreign-born population - Cabo Verde (%)
Place of birth for the foreign-born population - Ghana (%)
Place of birth for the foreign-born population - Liberia (%)
Place of birth for the foreign-born population - Nigeria (%)
Place of birth for the foreign-born population - Senegal (%)
Place of birth for the foreign-born population - Sierra Leone (%)
Place of birth for the foreign-born population - Other Western Africa (%)
Place of birth for the foreign-born population - Australia (%)
Place of birth for the foreign-born population - New Zealand (%)
Place of birth for the foreign-born population - Fiji (%)
Place of birth for the foreign-born population - Micronesia (%)
Place of birth for the foreign-born population - Bahamas (%)
Place of birth for the foreign-born population - Barbados (%)
Place of birth for the foreign-born population - Cuba (%)
Place of birth for the foreign-born population - Dominica (%)
Place of birth for the foreign-born population - Dominican Republic (%)
Place of birth for the foreign-born population - Grenada (%)
Place of birth for the foreign-born population - Haiti (%)
Place of birth for the foreign-born population - Jamaica (%)
Place of birth for the foreign-born population - St. Vincent and the Grenadines (%)
Place of birth for the foreign-born population - Trinidad and Tobago (%)
Place of birth for the foreign-born population - West Indies (%)
Place of birth for the foreign-born population - Other Caribbean (%)
Place of birth for the foreign-born population - Belize (%)
Place of birth for the foreign-born population - Costa Rica (%)
Place of birth for the foreign-born population - El Salvador (%)
Place of birth for the foreign-born population - Guatemala (%)
Place of birth for the foreign-born population - Honduras (%)
Place of birth for the foreign-born population - Mexico (%)
Place of birth for the foreign-born population - Nicaragua (%)
Place of birth for the foreign-born population - Panama (%)
Place of birth for the foreign-born population - Other Central America (%)
Place of birth for the foreign-born population - Argentina (%)
Place of birth for the foreign-born population - Bolivia (%)
Place of birth for the foreign-born population - Brazil (%)
Place of birth for the foreign-born population - Chile (%)
Place of birth for the foreign-born population - Colombia (%)
Place of birth for the foreign-born population - Ecuador (%)
Place of birth for the foreign-born population - Guyana (%)
Place of birth for the foreign-born population - Peru (%)
Place of birth for the foreign-born population - Uruguay (%)
Place of birth for the foreign-born population - Venezuela (%)
Place of birth for the foreign-born population - Other South America (%)
Place of birth for the foreign-born population - Canada (%)
Place of birth for the foreign-born population - Other Northern America (%)
Place of birth for the foreign-born population - Other (%)
Latest news about races in Plano, TX collected exclusively by city-data.com from local newspapers, TV, and radio stations
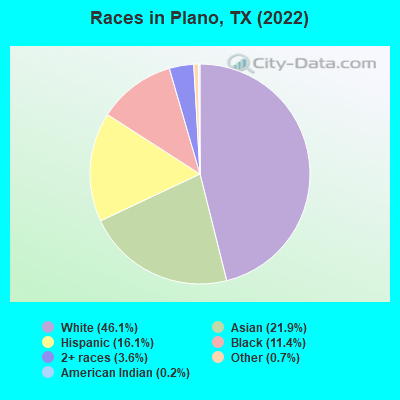
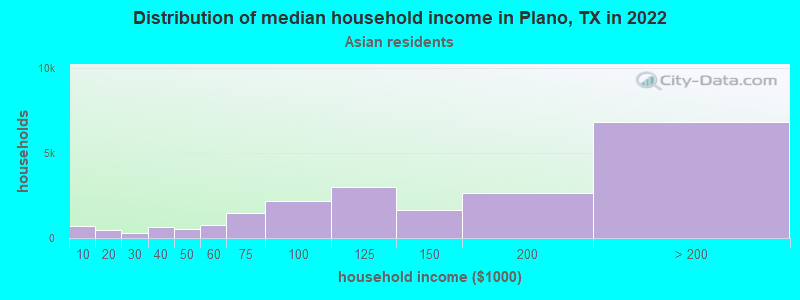
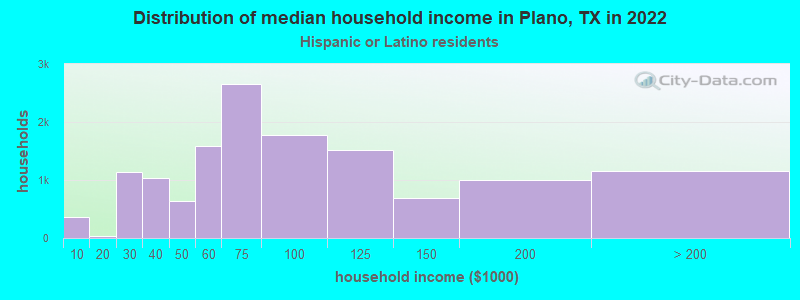
According to 2022 data, the most numerous races in Plano, TX are Hispanic (46,725 residents), White alone (133,765 residents), and Black alone (33,084 residents). 65.7% of Plano residents speak English at home. 27.5% of Plano, TX residents are foreign-born (18.2% born in Asia, 6.4% born in Latin America), which is 38.2% greater than the foreign-born rate of 17.0% across the entire state of Texas.
Race distribution in Plano
2000 2022
161,543 72.8% White alone 22,357 10.1% Hispanic 22,518 10.1% Asian alone 10,989 4.9% Black alone 3,562 1.6% Two or more races 655 0.3% American Indian alone 317 0.1% Other race alone 89 0.04% Native Hawaiian and Other
133,765 46.1% White alone 63,534 21.9% Asian alone 46,725 16.1% Hispanic 33,084 11.4% Black alone 10,359 3.6% Two or more races 1,933 0.7% Other race alone 708 0.2% American Indian alone
2000 2022
10,933,313 52.4% White alone 6,669,666 32.0% Hispanic 2,364,255 11.3% Black alone 554,445 2.7% Asian alone 230,567 1.1% Two or more races 68,859 0.3% American Indian alone 19,958 0.10% Other race alone 10,757 0.05% Native Hawaiian and Other
12,070,642 40.2% Hispanic 11,683,430 38.9% White alone 3,508,706 11.7% Black alone 1,608,173 5.4% Asian alone 956,560 3.2% Two or more races 125,763 0.4% Other race alone 47,023 0.2% American Indian alone 29,275 0.10% Native Hawaiian and Other
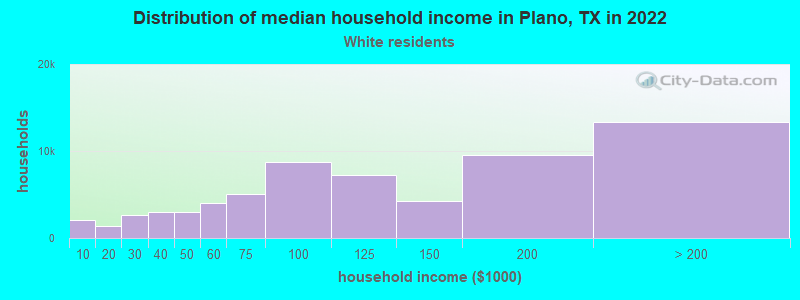
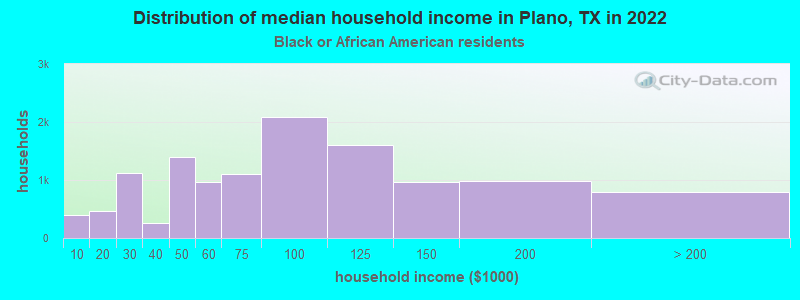
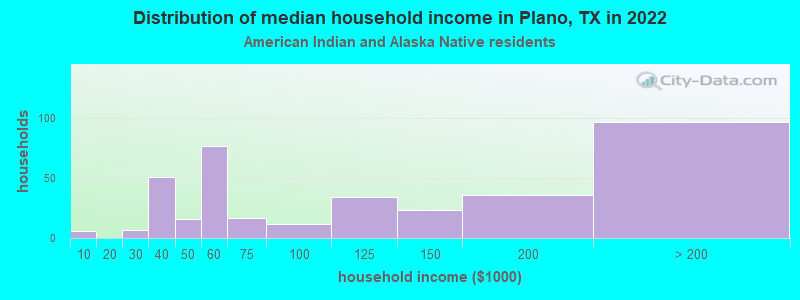
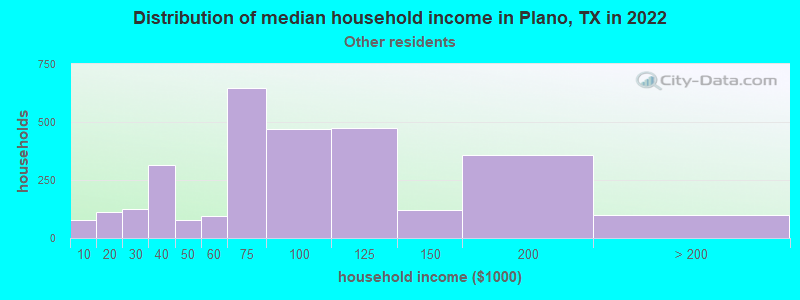
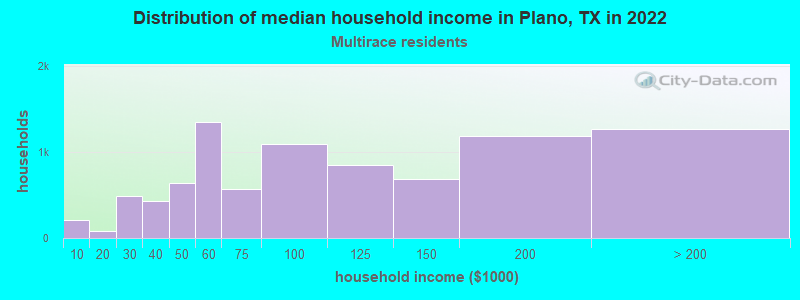
Income and house value in Plano Median household income in 2022 $109,981 White non-Hispanic householders$76,339 Black householders$60,251 American Indian and Alaska Native householders$133,311 Asian householders$64,982 Some other race householders$92,098 Two or more races householders$70,173 Hispanic or Latino race householdersMedian 2022 house value $468,413 White Non-Hispanic householders$459,449 Black or African American householders$330,202 American Indian or Alaska Native householders $525,663 Asian householders$514,097 Native Hawaiian and other Pacific Islander householders$292,613 Some other race householders$422,728 Two or more races householders$361,719 Hispanic or Latino householders
Median age by race in Plano
44.9 Median age for White residents42.9 46.7 34.4 Median age for Black or African American residents32.0 34.8 37.4 Median age for American Indian / Alaska Native residents31.9 33.9 38.8 Median age for Asian residents38.8 38.7 -666,666,666.0 Median age for Native Hawaiian / Pacific Islander residents-666,666,666.0 -666,666,666.0 36.5 Median age for Other race residents35.8 37.5 26.3 Median age for Two or more races residents26.1 26.5 46.6 Median age for White alone residents44.6 48.8 30.0 Median age for Hispanic or Latino residents26.9 33.1
Owner/renter occupied households by race in Plano
House owners and renters - White residents 40,810 63.5% Owner occupied23,422 36.5% Renter occupiedHouse owners and renters - Black or African American residents 3,308 27.3% Owner occupied8,825 72.7% Renter occupiedHouse owners and renters - American Indian / Alaska Native residents 61 18.5% Owner occupied267 81.5% Renter occupiedHouse owners and renters - Asian residents 12,411 58.7% Owner occupied8,729 41.3% Renter occupiedHouse owners and renters - Native Hawaiian / Pacific Islander residents 86 67.0% Owner occupied43 33.0% Renter occupiedHouse owners and renters - Other race residents 1,053 28.6% Owner occupied2,623 71.4% Renter occupiedHouse owners and renters - Two or more races residents 3,988 45.1% Owner occupied4,850 54.9% Renter occupiedHouse owners and renters - White alone residents 38,873 65.9% Owner occupied20,159 34.1% Renter occupiedHouse owners and renters - Hispanic or Latino residents 4,955 36.5% Owner occupied8,625 63.5% Renter occupied
Language usage in Plano
English speakers - Total 65.7% of residents of Plano speak English at home.
10.5% of residents speak Spanish at home 18,535 64.0% Speak English very well10,416 36.0% Speak English less than very well23.8% of residents speak other language at home 46,342 70.7% Speak English very well19,197 29.3% Speak English less than very well
English speakers - Born in the United States 88.1% of residents of Plano speak English at home.
4.1% of residents speak Spanish at home 3,207 86.9% Speak English very well483 13.1% Speak English less than very well7.8% of residents speak other language at home 6,356 91.7% Speak English very well574 8.3% Speak English less than very well
English speakers - Native, born elsewhere 59.0% of residents of Plano speak English at home.
17.3% of residents speak Spanish at home 469 68.1% Speak English very well220 31.9% Speak English less than very well23.7% of residents speak other language at home 518 54.9% Speak English very well426 45.1% Speak English less than very well
English speakers - Foreign-born 14.3% of residents of Plano speak English at home.
18.5% of residents speak Spanish at home 6,918 49.1% Speak English very well7,183 50.9% Speak English less than very well67.3% of residents speak other language at home 33,476 65.2% Speak English very well17,839 34.8% Speak English less than very well
White (Caucasian) - Speak only English Native:
93.0% (117,120)Foreign-born:
20.8% (3,074)
White (Caucasian) - Speak another language Native:
7.0% (8,843)Foreign-born:
79.2% (11,731)
Black or African American - Speak only English Native:
94.5% (24,908)Foreign-born:
31.7% (1,871)
Black or African American - Speak another language Native:
5.5% (1,444)Foreign-born:
68.3% (4,022)
American Indian / Alaska Native - Speak only English Native:
96.7% (427)Foreign-born:
5.5% (5)
American Indian / Alaska Native - Speak another language Native:
6.5% (29)Foreign-born:
83.1% (69)
Asian - Speak only English Native:
40.6% (7,261)Foreign-born:
10.5% (4,502)
Asian - Speak another language Native:
59.4% (10,611)Foreign-born:
89.5% (38,238)
Native Hawaiian / Pacific Islander - Speak another language Native:
87.8% (127)Foreign-born:
100.0% (19)
Other race - Speak another language Native:
39.3% (2,478)Foreign-born:
100.0% (4,528)
Two or more races - Speak only English Native:
74.0% (16,143)Foreign-born:
17.2% (1,429)
Two or more races - Speak another language Native:
26.0% (5,660)Foreign-born:
82.8% (6,876)
White alone - Speak only English Native:
96.4% (112,307)Foreign-born:
24.7% (2,937)
White alone - Speak another language Native:
3.6% (4,246)Foreign-born:
75.3% (8,940)
Hispanic or Latino - Speak only English Native:
55.8% (15,820)Foreign-born:
7.6% (1,142)
Hispanic or Latino - Speak another language Native:
44.2% (12,530)Foreign-born:
92.4% (13,828)
Foreign-born residents in Plano 84,153 residents are foreign born (18.2% Asia , 6.4% Latin America ).
This city:
27.5%Texas:
17.1%
Marital status for residents in Plano Marital status - White (Caucasian) population 15 years and over
Males 27.3% Never married61.0% Now married1.1% Separated2.2% Widowed8.5% DivorcedFemales 23.4% Never married54.5% Now married1.1% Separated6.7% Widowed14.3% DivorcedWomen who gave birth in the past 12 months Now married:
100.0% (1,235)Unmarried:
0.0% (0)
Women who did not give birth in the past 12 months Now married:
48.9% (14,309)Unmarried:
51.1% (14,927)
Marital status - Black or African American population 15 years and over
Males 60.0% Never married31.3% Now married1.2% Separated2.4% Widowed5.1% DivorcedFemales 42.2% Never married33.7% Now married3.7% Separated2.6% Widowed17.8% DivorcedWomen who gave birth in the past 12 months Now married:
91.2% (243)Unmarried:
8.8% (24)
Women who did not give birth in the past 12 months Now married:
32.6% (2,760)Unmarried:
67.4% (5,718)
Marital status - American Indian / Alaska Native population 15 years and over
Males 51.1% Never married31.4% Now married4.9% Separated2.9% Widowed9.7% DivorcedFemales 35.5% Never married48.1% Now married0.0% Separated2.3% Widowed14.1% DivorcedWomen who did not give birth in the past 12 months Now married:
43.2% (132)Unmarried:
56.8% (174)
Marital status - Asian population 15 years and over
Males 25.7% Never married70.5% Now married0.2% Separated1.6% Widowed2.0% DivorcedFemales 19.4% Never married66.0% Now married1.9% Separated5.5% Widowed7.2% DivorcedWomen who gave birth in the past 12 months Now married:
100.0% (1,503)Unmarried:
0.0% (0)
Women who did not give birth in the past 12 months Now married:
63.2% (10,248)Unmarried:
36.8% (5,967)
Marital status - Native Hawaiian / Pacific Islander population 15 years and over
Males 17.5% Never married57.3% Now married0.0% Separated25.2% Widowed0.0% DivorcedFemales 50.0% Never married50.0% Now married0.0% Separated0.0% Widowed0.0% DivorcedWomen who gave birth in the past 12 months Now married:
100.0% (10)Unmarried:
0.0% (0)
Marital status - Other race population 15 years and over
Males 31.0% Never married45.4% Now married2.7% Separated2.7% Widowed18.2% DivorcedFemales 21.9% Never married66.8% Now married3.1% Separated1.9% Widowed6.2% DivorcedWomen who gave birth in the past 12 months Now married:
45.0% (100)Unmarried:
55.0% (123)
Women who did not give birth in the past 12 months Now married:
54.6% (1,393)Unmarried:
45.4% (1,159)
Marital status - Two or more races population 15 years and over
Males 44.7% Never married47.4% Now married0.4% Separated0.9% Widowed6.6% DivorcedFemales 34.7% Never married51.0% Now married0.0% Separated3.6% Widowed10.7% DivorcedWomen who gave birth in the past 12 months Now married:
15.4% (47)Unmarried:
84.6% (259)
Women who did not give birth in the past 12 months Now married:
46.3% (3,167)Unmarried:
53.7% (3,672)
Marital status - White alone, not Hispanic / Latino population 15 years and over
Males 26.0% Never married61.8% Now married1.1% Separated2.3% Widowed8.7% DivorcedFemales 21.9% Never married56.6% Now married0.8% Separated6.9% Widowed13.9% DivorcedWomen who gave birth in the past 12 months Now married:
100.0% (1,235)Unmarried:
0.0% (0)
Women who did not give birth in the past 12 months Now married:
51.7% (12,846)Unmarried:
48.3% (12,002)
Marital status - Hispanic or Latino population 15 years and over
Males 41.1% Never married47.9% Now married0.9% Separated1.5% Widowed8.6% DivorcedFemales 30.1% Never married51.5% Now married1.8% Separated3.8% Widowed12.8% DivorcedWomen who gave birth in the past 12 months Now married:
15.4% (47)Unmarried:
84.6% (259)
Women who did not give birth in the past 12 months Now married:
51.1% (6,354)Unmarried:
48.9% (6,076)
Ancestries in Plano
16,501 9.2% American12,621 7.0% English6,894 3.8% German4,350 2.4% Irish3,336 1.9% European2,522 1.4% Iranian1,936 1.1% Italian1,580 0.9% Scotch-Irish1,521 0.8% Scottish1,231 0.7% Russian1,205 0.7% Nigerian958 0.5% Ethiopian921 0.5% French794 0.4% Norwegian656 0.4% Polish641 0.4% Eastern European631 0.3% Dutch508 0.3% Iraqi475 0.3% Lebanese473 0.3% African470 0.3% Kenyan446 0.2% Ukrainian413 0.2% Albanian389 0.2% Canadian368 0.2% British364 0.2% Czech360 0.2% Danish352 0.2% Welsh347 0.2% Scandinavian340 0.2% Greek326 0.2% Armenian312 0.2% Haitian284 0.2% Egyptian266 0.1% Israeli247 0.1% French Canadian238 0.1% Northern European236 0.1% Ghanaian231 0.1% Turkish224 0.1% Swedish220 0.1% Palestinian219 0.1% Austrian215 0.1% Jamaican214 0.1% Brazilian191 0.1% Slavic165 0.09% Afghan165 0.09% South African160 0.09% Hungarian151 0.08% Yugoslavian143 0.08% Syrian135 0.07% Slovak125 0.07% Czechoslovakian117 0.06% West Indian114 0.06% Jordanian101 0.06% Romanian96 0.05% Moroccan87 0.05% Croatian87 0.05% Portuguese81 0.04% Arab72 0.04% Serbian64 0.04% Latvian55 0.03% Bulgarian50 0.03% British West Indian48 0.03% Trinidadian and Tobagonian48 0.03% Finnish46 0.03% Estonian45 0.02% Basque43 0.02% Pennsylvania German40 0.02% Sudanese30 0.02% Liberian29 0.02% Bahamian27 0.01% Swiss22 0.01% Belgian21 0.01% Bermudan19 0.01% Cajun16 0.01% Dutch West Indian14 0.01% Ugandan13 0.01% Luxembourger11 0.01% Australian
Geographical mobility in Plano Same house 1 year ago 126,357 87.1% White (Caucasian)28,805 85.5% Black or African American881 85.1% American Indian / Alaska Native52,493 82.8% Asian113 62.7% Native Hawaiian / Pacific Islander9,822 82.5% Other race29,186 88.4% Two or more races114,690 86.5% White alone, not Hispanic / Latino42,016 91.0% Hispanic or LatinoMoved within same county 5,832 4.0% White / Caucasian883 2.6% Black or African American36 3.5% American Indian / Alaska Native2,116 3.3% Asian7 4.1% Native Hawaiian / Pacific Islander192 1.6% Other race1,695 5.1% Two or more races5,832 4.4% White alone, not Hispanic / Latino977 2.1% Hispanic or LatinoMoved within same state 8,832 6.1% White / Caucasian1,988 5.9% Black or African American74 7.2% American Indian / Alaska Native665 1.0% Asian15 8.5% Native Hawaiian / Pacific Islander1,644 13.8% Other race391 1.2% Two or more races8,269 6.2% White alone, not Hispanic / Latino1,316 2.9% Hispanic or LatinoMoved from different state 3,194 2.2% White / Caucasian1,995 5.9% Black or African American35 3.4% American Indian / Alaska Native6,017 9.5% Asian70 39.0% Native Hawaiian / Pacific Islander253 2.1% Other race1,010 3.1% Two or more races3,108 2.3% White alone, not Hispanic / Latino1,099 2.4% Hispanic or LatinoMoved from abroad 777 0.5% White8 0.8% American Indian / Alaska Native2,110 3.3% Asian718 2.2% Two or more races755 0.6% White alone, not Hispanic / Latino740 1.6% Hispanic or Latino
Children Nativity (place of birth) in Plano
Children under 6 years - Living with two parents Both parents native 7,692 99.6% Native33 0.4% Foreign-bornBoth parents foreign-born 3,293 85.4% Native561 14.6% Foreign-bornOne native, one foreign-born parent 2,669 98.1% Native51 1.9% Foreign-bornChildren under 6 years - Living with one parent Native parent 2,841 100.0% NativeForeign-born parent 1,041 77.0% Native311 23.0% Foreign-bornChildren 6 to 17 years - Living with two parents Both parents native 13,777 99.6% Native53 0.4% Foreign-bornBoth parents foreign-born 9,317 70.9% Native3,830 29.1% Foreign-bornOne native, one foreign-born parent 4,919 93.9% Native321 6.1% Foreign-bornChildren 6 to 17 years - Living with one parent Native parent 6,438 100.0% NativeForeign-born parent 1,997 54.1% Native1,692 45.9% Foreign-born
Place of birth for residents in Plano 53,783 Asia30,587 South Central Asia20,315 Americas18,804 Latin America14,501 Central America13,254 Eastern Asia9,460 China6,262 South Eastern Asia4,979 Africa4,915 Europe3,531 Western Asia3,358 South America2,148 Eastern Africa2,101 Eastern Europe1,510 Northern America1,300 Northern Europe1,274 Western Africa1,271 Western Europe944 Caribbean844 Northern Africa310 Middle Africa289 Southern Africa241 Southern Europe159 Oceania143 Australia and New Zealand Subregion23,289 India9,113 Mexico6,873 China2,842 Korea2,718 Pakistan2,690 Iran2,417 Vietnam2,393 Guatemala2,124 Taiwan1,947 El Salvador1,945 Philippines1,498 Canada1,019 Iraq951 Japan927 Nigeria910 Venezuela850 Brazil775 Bangladesh727 Ethiopia723 Honduras716 Germany714 Turkey604 Colombia543 Israel506 Russia470 England465 Burma (Myanmar)465 Ukraine464 United Kingdom463 Hong Kong447 Kenya410 Laos388 Egypt388 Nepal359 Uzbekistan331 France327 Thailand323 Peru310 Cameroon297 Malaysia292 Trinidad and Tobago291 Zimbabwe289 South Africa254 Indonesia236 Sudan218 Lebanon217 Argentina211 Nicaragua203 Haiti196 Jordan196 Albania193 Sri Lanka191 Cuba187 Uganda185 Kuwait169 Sweden164 Syria163 United Arab Emirates151 Guyana137 Ecuador136 Italy131 Saudi Arabia125 Tanzania118 Jamaica118 Cambodia113 Afghanistan111 Bolivia105 Poland105 Azerbaijan101 New Zealand99 Belarus95 Eritrea88 Belgium87 Hungary81 Ghana74 Bosnia and Herzegovina71 Bulgaria71 Scotland70 Netherlands68 Algeria62 Ireland61 Romania61 Spain56 Morocco56 Panama55 Latvia54 Costa Rica51 St. Lucia51 Armenia43 Denmark42 West Indies42 Togo41 Australia40 Ivory Coast40 Serbia39 North Macedonia (Macedonia)39 Switzerland30 Bahamas30 Chile29 Portugal26 Kazakhstan25 Singapore25 Austria22 Moldova22 Sierra Leone15 Liberia14 Dominican Republic14 Croatia14 Greece12 Czechoslovakia10 Uruguay8 Micronesia
Grandparents responsible for own grandchildren in Plano
Grandparents (30 to 59 years) White / Caucasian 102 60.4% Responsible for grandchildren67 39.6% Not responsible for grandchildrenBlack or African American 82 37.6% Responsible for grandchildren136 62.4% Not responsible for grandchildrenAsian 41 12.3% Responsible for grandchildren294 87.7% Not responsible for grandchildrenOther race 63 83.1% Responsible for grandchildren13 16.9% Not responsible for grandchildrenTwo or more races 13 9.1% Responsible for grandchildren132 90.9% Not responsible for grandchildrenWhite alone, not Hispanic / Latino 158 49.3% Responsible for grandchildren162 50.7% Not responsible for grandchildrenHispanic or Latino 82 26.0% Responsible for grandchildren232 74.0% Not responsible for grandchildrenGrandparents (60 years and over) White / Caucasian 643 43.3% Responsible for grandchildren842 56.7% Not responsible for grandchildrenBlack or African American 8 3.9% Responsible for grandchildren203 96.1% Not responsible for grandchildrenAsian 42 2.7% Responsible for grandchildren1,523 97.3% Not responsible for grandchildrenOther race 14 9.4% Responsible for grandchildren131 90.6% Not responsible for grandchildrenTwo or more races 47 40.5% Responsible for grandchildren69 59.5% Not responsible for grandchildrenWhite alone, not Hispanic / Latino 255 25.9% Responsible for grandchildren727 74.1% Not responsible for grandchildrenHispanic or Latino 81 28.1% Responsible for grandchildren207 71.9% Not responsible for grandchildren