Races in Perrysburg, Ohio (OH) Detailed Stats Ancestries, Foreign-born residents, place of birth
Data:
Races - White alone (%)
Races - White alone (% change since 2000)
Races - Black alone (%)
Races - Black alone (% change since 2000)
Races - American Indian alone (%)
Races - American Indian alone (% change since 2000)
Races - Asian alone (%)
Races - Asian alone (% change since 2000)
Races - Hispanic (%)
Races - Hispanic (% change since 2000)
Races - Native Hawaiian and Other Pacific Islander alone (%)
Races - Native Hawaiian and Other Pacific Islander alone (% change since 2000)
Races - Two or more races(%)
Races - Two or more races(% change since 2000)
Races - Other race alone (%)
Races - Other race alone (% change since 2000)
Racial diversity
Place of birth - Born in state of residence (%)
Place of birth - Born in state of residence (%) - White
Place of birth - Born in state of residence (%) - Black or African American
Place of birth - Born in state of residence (%) - Asian
Place of birth - Born in state of residence (%) - Hispanic or Latino
Place of birth - Born in state of residence (%) - American Indian and Alaska Native
Place of birth - Born in state of residence (%) - Multirace
Place of birth - Born in state of residence (%) - Other Race
Place of birth - Born in other state (%)
Place of birth - Born in other state (%) - White
Place of birth - Born in other state (%) - Black or African American
Place of birth - Born in other state (%) - Asian
Place of birth - Born in other state (%) - Hispanic or Latino
Place of birth - Born in other state (%) - American Indian and Alaska Native
Place of birth - Born in other state (%) - Multirace
Place of birth - Born in other state (%) - Other Race
Place of birth - Native, outside of US (%)
Place of birth - Native, outside of US (%) - White
Place of birth - Native, outside of US (%) - Black or African American
Place of birth - Native, outside of US (%) - Asian
Place of birth - Native, outside of US (%) - Hispanic or Latino
Place of birth - Native, outside of US (%) - American Indian and Alaska Native
Place of birth - Native, outside of US (%) - Multirace
Place of birth - Native, outside of US (%) - Other Race
Place of birth - Foreign born (%)
Place of birth - Foreign born (%) - White
Place of birth - Foreign born (%) - Black or African American
Place of birth - Foreign born (%) - Asian
Place of birth - Foreign born (%) - Hispanic or Latino
Place of birth - Foreign born (%) - American Indian and Alaska Native
Place of birth - Foreign born (%) - Multirace
Place of birth - Foreign born (%) - Other Race
Residents speaking English at home (%)
Residents speaking English at home - Born in the United States (%)
Residents speaking English at home - Native, born elsewhere (%)
Residents speaking English at home - Foreign born (%)
Residents speaking Spanish at home (%)
Residents speaking Spanish at home - Born in the United States (%)
Residents speaking Spanish at home - Native, born elsewhere (%)
Residents speaking Spanish at home - Foreign born (%)
Residents speaking other language at home (%)
Residents speaking other language at home - Born in the United States (%)
Residents speaking other language at home - Native, born elsewhere (%)
Residents speaking other language at home - Foreign born (%)
Marital status - Never married (%)
Marital status - Now married (%)
Marital status - Separated (%)
Marital status - Widowed (%)
Marital status - Divorced (%)
Ancestries Reported - Arab (%)
Ancestries Reported - Czech (%)
Ancestries Reported - Danish (%)
Ancestries Reported - Dutch (%)
Ancestries Reported - English (%)
Ancestries Reported - French (%)
Ancestries Reported - French Canadian (%)
Ancestries Reported - German (%)
Ancestries Reported - Greek (%)
Ancestries Reported - Hungarian (%)
Ancestries Reported - Irish (%)
Ancestries Reported - Italian (%)
Ancestries Reported - Lithuanian (%)
Ancestries Reported - Norwegian (%)
Ancestries Reported - Polish (%)
Ancestries Reported - Portuguese (%)
Ancestries Reported - Russian (%)
Ancestries Reported - Scotch-Irish (%)
Ancestries Reported - Scottish (%)
Ancestries Reported - Slovak (%)
Ancestries Reported - Subsaharan African (%)
Ancestries Reported - Swedish (%)
Ancestries Reported - Swiss (%)
Ancestries Reported - Ukrainian (%)
Ancestries Reported - United States (%)
Ancestries Reported - Welsh (%)
Ancestries Reported - West Indian (%)
Ancestries Reported - Other (%)
Geographical mobility - Same house 1 year ago (%)
Geographical mobility - Same house 1 year ago (%) - White
Geographical mobility - Same house 1 year ago (%) - Black or African American
Geographical mobility - Same house 1 year ago (%) - Asian
Geographical mobility - Same house 1 year ago (%) - Hispanic or Latino
Geographical mobility - Same house 1 year ago (%) - American Indian and Alaska Native
Geographical mobility - Same house 1 year ago (%) - Multirace
Geographical mobility - Same house 1 year ago (%) - Other Race
Geographical mobility - Moved within same county (%)
Geographical mobility - Moved within same county (%) - White
Geographical mobility - Moved within same county (%) - Black or African American
Geographical mobility - Moved within same county (%) - Asian
Geographical mobility - Moved within same county (%) - Hispanic or Latino
Geographical mobility - Moved within same county (%) - American Indian and Alaska Native
Geographical mobility - Moved within same county (%) - Multirace
Geographical mobility - Moved within same county (%) - Other Race
Geographical mobility - Moved from different county within same state (%)
Geographical mobility - Moved from different county within same state (%) - White
Geographical mobility - Moved from different county within same state (%) - Black or African American
Geographical mobility - Moved from different county within same state (%) - Asian
Geographical mobility - Moved from different county within same state (%) - Hispanic or Latino
Geographical mobility - Moved from different county within same state (%) - American Indian and Alaska Native
Geographical mobility - Moved from different county within same state (%) - Multirace
Geographical mobility - Moved from different county within same state (%) - Other Race
Geographical mobility - Moved from different state (%)
Geographical mobility - Moved from different state (%) - White
Geographical mobility - Moved from different state (%) - Black or African American
Geographical mobility - Moved from different state (%) - Asian
Geographical mobility - Moved from different state (%) - Hispanic or Latino
Geographical mobility - Moved from different state (%) - American Indian and Alaska Native
Geographical mobility - Moved from different state (%) - Multirace
Geographical mobility - Moved from different state (%) - Other Race
Geographical mobility - Moved from abroad (%)
Geographical mobility - Moved from abroad (%) - White
Geographical mobility - Moved from abroad (%) - Black or African American
Geographical mobility - Moved from abroad (%) - Asian
Geographical mobility - Moved from abroad (%) - Hispanic or Latino
Geographical mobility - Moved from abroad (%) - American Indian and Alaska Native
Geographical mobility - Moved from abroad (%) - Multirace
Geographical mobility - Moved from abroad (%) - Other Race
Place of birth for the foreign-born population - Ireland (%)
Place of birth for the foreign-born population - Denmark (%)
Place of birth for the foreign-born population - Norway (%)
Place of birth for the foreign-born population - Sweden (%)
Place of birth for the foreign-born population - United Kingdom (%)
Place of birth for the foreign-born population - England (%)
Place of birth for the foreign-born population - Scotland (%)
Place of birth for the foreign-born population - Other Northern Europe (%)
Place of birth for the foreign-born population - Austria (%)
Place of birth for the foreign-born population - Belgium (%)
Place of birth for the foreign-born population - France (%)
Place of birth for the foreign-born population - Germany (%)
Place of birth for the foreign-born population - Netherlands (%)
Place of birth for the foreign-born population - Switzerland (%)
Place of birth for the foreign-born population - Other Western Europe (%)
Place of birth for the foreign-born population - Greece (%)
Place of birth for the foreign-born population - Italy (%)
Place of birth for the foreign-born population - Portugal (%)
Place of birth for the foreign-born population - Spain (%)
Place of birth for the foreign-born population - Other Southern Europe (%)
Place of birth for the foreign-born population - Albania (%)
Place of birth for the foreign-born population - Belarus (%)
Place of birth for the foreign-born population - Bosnia and Herzegovina (%)
Place of birth for the foreign-born population - Bulgaria (%)
Place of birth for the foreign-born population - Croatia (%)
Place of birth for the foreign-born population - Czechoslovakia (%)
Place of birth for the foreign-born population - Hungary (%)
Place of birth for the foreign-born population - Latvia (%)
Place of birth for the foreign-born population - Lithuania (%)
Place of birth for the foreign-born population - North Macedonia (Macedonia) (%)
Place of birth for the foreign-born population - Moldova (%)
Place of birth for the foreign-born population - Poland (%)
Place of birth for the foreign-born population - Romania (%)
Place of birth for the foreign-born population - Russia (%)
Place of birth for the foreign-born population - Serbia (%)
Place of birth for the foreign-born population - Ukraine (%)
Place of birth for the foreign-born population - Other Eastern Europe (%)
Place of birth for the foreign-born population - China (%)
Place of birth for the foreign-born population - Hong Kong (%)
Place of birth for the foreign-born population - Taiwan (%)
Place of birth for the foreign-born population - Japan (%)
Place of birth for the foreign-born population - Korea (%)
Place of birth for the foreign-born population - Other Eastern Asia (%)
Place of birth for the foreign-born population - Afghanistan (%)
Place of birth for the foreign-born population - Bangladesh (%)
Place of birth for the foreign-born population - India (%)
Place of birth for the foreign-born population - Iran (%)
Place of birth for the foreign-born population - Kazakhstan (%)
Place of birth for the foreign-born population - Nepal (%)
Place of birth for the foreign-born population - Pakistan (%)
Place of birth for the foreign-born population - Sri Lanka (%)
Place of birth for the foreign-born population - Uzbekistan (%)
Place of birth for the foreign-born population - Other South Central Asia (%)
Place of birth for the foreign-born population - Burma (%)
Place of birth for the foreign-born population - Cambodia (%)
Place of birth for the foreign-born population - Indonesia (%)
Place of birth for the foreign-born population - Laos (%)
Place of birth for the foreign-born population - Malaysia (%)
Place of birth for the foreign-born population - Philippines (%)
Place of birth for the foreign-born population - Singapore (%)
Place of birth for the foreign-born population - Thailand (%)
Place of birth for the foreign-born population - Vietnam (%)
Place of birth for the foreign-born population - Other South Eastern Asia (%)
Place of birth for the foreign-born population - Armenia (%)
Place of birth for the foreign-born population - Iraq (%)
Place of birth for the foreign-born population - Israel (%)
Place of birth for the foreign-born population - Jordan (%)
Place of birth for the foreign-born population - Kuwait (%)
Place of birth for the foreign-born population - Lebanon (%)
Place of birth for the foreign-born population - Saudi Arabia (%)
Place of birth for the foreign-born population - Syria (%)
Place of birth for the foreign-born population - Turkey (%)
Place of birth for the foreign-born population - Yemen (%)
Place of birth for the foreign-born population - Other Western Asia (%)
Place of birth for the foreign-born population - Eritrea (%)
Place of birth for the foreign-born population - Ethiopia (%)
Place of birth for the foreign-born population - Kenya (%)
Place of birth for the foreign-born population - Somalia (%)
Place of birth for the foreign-born population - Uganda (%)
Place of birth for the foreign-born population - Zimbabwe (%)
Place of birth for the foreign-born population - Other Eastern Africa (%)
Place of birth for the foreign-born population - Cameroon (%)
Place of birth for the foreign-born population - Congo (%)
Place of birth for the foreign-born population - Democratic Republic of Congo (Zaire) (%)
Place of birth for the foreign-born population - Other Middle Africa (%)
Place of birth for the foreign-born population - Egypt (%)
Place of birth for the foreign-born population - Morocco (%)
Place of birth for the foreign-born population - Sudan (%)
Place of birth for the foreign-born population - Other Northern Africa (%)
Place of birth for the foreign-born population - South Africa (%)
Place of birth for the foreign-born population - Other Southern Africa (%)
Place of birth for the foreign-born population - Cabo Verde (%)
Place of birth for the foreign-born population - Ghana (%)
Place of birth for the foreign-born population - Liberia (%)
Place of birth for the foreign-born population - Nigeria (%)
Place of birth for the foreign-born population - Senegal (%)
Place of birth for the foreign-born population - Sierra Leone (%)
Place of birth for the foreign-born population - Other Western Africa (%)
Place of birth for the foreign-born population - Australia (%)
Place of birth for the foreign-born population - New Zealand (%)
Place of birth for the foreign-born population - Fiji (%)
Place of birth for the foreign-born population - Micronesia (%)
Place of birth for the foreign-born population - Bahamas (%)
Place of birth for the foreign-born population - Barbados (%)
Place of birth for the foreign-born population - Cuba (%)
Place of birth for the foreign-born population - Dominica (%)
Place of birth for the foreign-born population - Dominican Republic (%)
Place of birth for the foreign-born population - Grenada (%)
Place of birth for the foreign-born population - Haiti (%)
Place of birth for the foreign-born population - Jamaica (%)
Place of birth for the foreign-born population - St. Vincent and the Grenadines (%)
Place of birth for the foreign-born population - Trinidad and Tobago (%)
Place of birth for the foreign-born population - West Indies (%)
Place of birth for the foreign-born population - Other Caribbean (%)
Place of birth for the foreign-born population - Belize (%)
Place of birth for the foreign-born population - Costa Rica (%)
Place of birth for the foreign-born population - El Salvador (%)
Place of birth for the foreign-born population - Guatemala (%)
Place of birth for the foreign-born population - Honduras (%)
Place of birth for the foreign-born population - Mexico (%)
Place of birth for the foreign-born population - Nicaragua (%)
Place of birth for the foreign-born population - Panama (%)
Place of birth for the foreign-born population - Other Central America (%)
Place of birth for the foreign-born population - Argentina (%)
Place of birth for the foreign-born population - Bolivia (%)
Place of birth for the foreign-born population - Brazil (%)
Place of birth for the foreign-born population - Chile (%)
Place of birth for the foreign-born population - Colombia (%)
Place of birth for the foreign-born population - Ecuador (%)
Place of birth for the foreign-born population - Guyana (%)
Place of birth for the foreign-born population - Peru (%)
Place of birth for the foreign-born population - Uruguay (%)
Place of birth for the foreign-born population - Venezuela (%)
Place of birth for the foreign-born population - Other South America (%)
Place of birth for the foreign-born population - Canada (%)
Place of birth for the foreign-born population - Other Northern America (%)
Place of birth for the foreign-born population - Other (%)
Latest news about races in Perrysburg, OH collected exclusively by city-data.com from local newspapers, TV, and radio stations
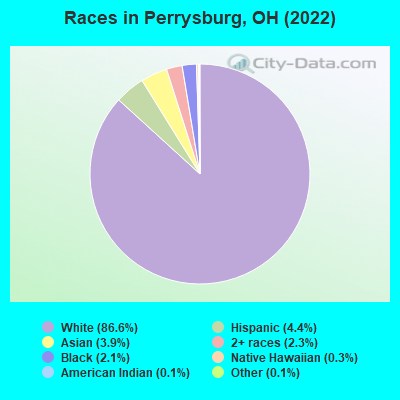
According to 2022 data, the most numerous races in Perrysburg, OH are White alone (21,524 residents), Black alone (511 residents), and Two or more races (579 residents). 91.8% of Perrysburg residents speak English at home. 5.7% of Perrysburg, OH residents are foreign-born (2.7% born in Asia, 1.3% born in Europe, 0.9% born in Latin America), which is 29.8% greater than the foreign-born rate of 4.0% across the entire state of Ohio.
Race distribution in Perrysburg
2000
2022
9,538,111 84.0% White alone
1,290,662 11.4% Black alone
217,123 1.9% Hispanic
137,770 1.2% Two or more races
131,670 1.2% Asian alone
21,985 0.2% American Indian alone
13,483 0.1% Other race alone
2,336 0.02% Native Hawaiian and Other Pacific Islander alone
8,948,793 76.1% White alone
1,401,403 11.9% Black alone
529,291 4.5% Two or more races
517,232 4.4% Hispanic
293,387 2.5% Asian alone
52,805 0.4% Other race alone
9,785 0.08% American Indian alone
3,362 0.03% Native Hawaiian and Other Pacific Islander alone
Income and house value in Perrysburg Median household income in 2022 $91,162 White non-Hispanic householders
$45,140 Black householders
$102,834 Asian householders
$89,574 Two or more races householders
$103,755 Hispanic or Latino race householders
Median 2022 house value $289,542 White Non-Hispanic householders
$296,849 Black or African American householders
$318,039 Asian householders
$186,512 Some other race householders
$323,520 Two or more races householders
$206,972 Hispanic or Latino householders
Median age by race in Perrysburg
40.2 Median age for White residents38.4 Males41.9 Females33.5 Median age for Black or African American residents35.5 Males45.5 Females95.1 Median age for American Indian / Alaska Native residents-985,386,220.3 Males71.6 Females43.1 Median age for Asian residents39.9 Males45.0 Females-800,387,596.1 Median age for Native Hawaiian / Pacific Islander residents-750,242,953.6 Males-805,394,989.6 Females23.6 Median age for Other race residents32.9 Males21.4 Females22.1 Median age for Two or more races residents31.0 Males13.0 Females40.4 Median age for White alone residents39.2 Males42.0 Females31.2 Median age for Hispanic or Latino residents30.1 Males36.6 Females
Owner/renter occupied households by race in Perrysburg
House owners and renters - White residents 6,000 61.7% Owner occupied3,722 38.3% Renter occupiedHouse owners and renters - Black or African American residents 96 35.5% Owner occupied174 64.5% Renter occupiedHouse owners and renters - American Indian / Alaska Native residents 6 100.0% Owner occupiedHouse owners and renters - Asian residents 248 80.8% Owner occupied59 19.2% Renter occupiedHouse owners and renters - Native Hawaiian / Pacific Islander residents 13 100.0% Owner occupiedHouse owners and renters - Other race residents 28 36.8% Owner occupied49 63.2% Renter occupiedHouse owners and renters - Two or more races residents 240 96.3% Owner occupied9 3.7% Renter occupiedHouse owners and renters - White alone residents 5,882 61.8% Owner occupied3,634 38.2% Renter occupiedHouse owners and renters - Hispanic or Latino residents 291 61.0% Owner occupied186 39.0% Renter occupied
Language usage in Perrysburg
English speakers - Total 91.8% of residents of Perrysburg speak English at home.
1.7% of residents speak Spanish at home 328 81.6% Speak English very well74 18.4% Speak English less than very well7.2% of residents speak other language at home 1,204 71.4% Speak English very well483 28.6% Speak English less than very well
English speakers - Born in the United States 92.2% of residents of Perrysburg speak English at home.
1.3% of residents speak Spanish at home 74 100.0% Speak English very well8.0% of residents speak other language at home 447 100.0% Speak English very well
English speakers - Native, born elsewhere 26.6% of residents of Perrysburg speak English at home.
6.2% of residents speak Spanish at home 8 100.0% Speak English very well22.7% of residents speak other language at home 29 100.0% Speak English very well
English speakers - Foreign-born 30.0% of residents of Perrysburg speak English at home.
6.4% of residents speak Spanish at home 84 77.1% Speak English very well25 22.9% Speak English less than very well66.1% of residents speak other language at home 583 51.5% Speak English very well548 48.5% Speak English less than very well
White (Caucasian) - Speak only English Native:
97.7% (19,665)Foreign-born:
32.4% (241)
White (Caucasian) - Speak another language Native:
2.4% (474)Foreign-born:
69.7% (518)
Black or African American - Speak only English Native:
99.8% (330)Foreign-born:
99.0% (89)
Asian - Speak only English Native:
27.0% (58)Foreign-born:
15.3% (108)
Asian - Speak another language Native:
37.6% (81)Foreign-born:
85.0% (599)
Two or more races - Speak only English Native:
87.5% (965)Foreign-born:
84.8% (53)
White alone - Speak only English Native:
97.7% (19,330)Foreign-born:
33.1% (241)
White alone - Speak another language Native:
2.4% (477)Foreign-born:
72.9% (530)
Hispanic or Latino - Speak only English Native:
82.8% (671)Foreign-born:
23.1% (44)
Hispanic or Latino - Speak another language Native:
16.1% (130)Foreign-born:
76.1% (146)
Foreign-born residents in Perrysburg 1,417 residents are foreign born (2.7% Asia , 1.3% Europe , 0.9% Latin America ).
Marital status for residents in Perrysburg Marital status - White (Caucasian) population 15 years and over
Males 30.9% Never married56.8% Now married0.1% Separated2.8% Widowed9.4% DivorcedFemales 23.0% Never married51.3% Now married1.0% Separated8.3% Widowed16.3% DivorcedWomen who gave birth in the past 12 months Now married:
100.0% (168)Unmarried:
0.0% (0)
Women who did not give birth in the past 12 months Now married:
49.5% (2,390)Unmarried:
50.5% (2,434)
Marital status - Black or African American population 15 years and over
Males 73.6% Never married26.4% Now married0.0% Separated0.0% Widowed0.0% DivorcedFemales 66.9% Never married13.2% Now married11.0% Separated8.8% Widowed0.0% DivorcedWomen who did not give birth in the past 12 months Now married:
18.8% (15)Unmarried:
81.2% (63)
Marital status - American Indian / Alaska Native population 15 years and over
Males 0.0% Never married16.7% Now married0.0% Separated0.0% Widowed83.3% DivorcedFemales 0.0% Never married3.0% Now married0.0% Separated0.0% Widowed97.0% DivorcedWomen who did not give birth in the past 12 months Now married:
0.0% (0)Unmarried:
100.0% (1)
Marital status - Asian population 15 years and over
Males 22.5% Never married71.4% Now married0.0% Separated0.0% Widowed6.1% DivorcedFemales 16.0% Never married78.1% Now married0.0% Separated5.9% Widowed0.0% DivorcedWomen who gave birth in the past 12 months Now married:
100.0% (39)Unmarried:
0.0% (0)
Women who did not give birth in the past 12 months Now married:
62.0% (62)Unmarried:
38.0% (38)
Marital status - Other race population 15 years and over
Males 75.0% Never married25.0% Now married0.0% Separated0.0% Widowed0.0% DivorcedFemales 43.6% Never married56.4% Now married0.0% Separated0.0% Widowed0.0% DivorcedWomen who did not give birth in the past 12 months Now married:
73.8% (41)Unmarried:
26.2% (15)
Marital status - Two or more races population 15 years and over
Males 72.1% Never married26.5% Now married0.0% Separated0.0% Widowed1.4% DivorcedFemales 33.1% Never married66.9% Now married0.0% Separated0.0% Widowed0.0% DivorcedWomen who did not give birth in the past 12 months Now married:
66.0% (143)Unmarried:
34.0% (73)
Marital status - White alone, not Hispanic / Latino population 15 years and over
Males 30.4% Never married57.1% Now married0.1% Separated2.8% Widowed9.5% DivorcedFemales 22.8% Never married51.5% Now married0.8% Separated8.5% Widowed16.4% DivorcedWomen who gave birth in the past 12 months Now married:
100.0% (169)Unmarried:
0.0% (0)
Women who did not give birth in the past 12 months Now married:
49.9% (2,336)Unmarried:
50.1% (2,348)
Marital status - Hispanic or Latino population 15 years and over
Males 52.8% Never married40.9% Now married0.0% Separated0.0% Widowed6.3% DivorcedFemales 28.6% Never married55.0% Now married6.5% Separated2.5% Widowed7.4% DivorcedWomen who did not give birth in the past 12 months Now married:
57.7% (172)Unmarried:
42.3% (126)
Ancestries in Perrysburg
2,468 28.0% German
956 10.9% English
810 9.2% Polish
523 5.9% Irish
405 4.6% European
351 4.0% American
264 3.0% Italian
199 2.3% Turkish
128 1.5% Hungarian
114 1.3% Scottish
112 1.3% French
80 0.9% Jamaican
80 0.9% Egyptian
67 0.8% Northern European
50 0.6% Finnish
48 0.5% British
47 0.5% Ukrainian
46 0.5% Romanian
42 0.5% Dutch
42 0.5% Swedish
35 0.4% Slovak
33 0.4% Serbian
30 0.3% Canadian
28 0.3% Welsh
26 0.3% Lebanese
26 0.3% Austrian
24 0.3% Greek
20 0.2% Scotch-Irish
19 0.2% French Canadian
19 0.2% Ethiopian
17 0.2% Slovene
15 0.2% Norwegian
14 0.2% Iranian
14 0.2% Belgian
13 0.1% Albanian
12 0.1% Slavic
9 0.1% Arab
8 0.09% Scandinavian
7 0.08% Eastern European
5 0.06% Liberian
2 0.02% Czechoslovakian
Geographical mobility in Perrysburg
Same house 1 year ago 18,112 83.4% White (Caucasian)
281 56.5% Black or African American
118 100.0% American Indian / Alaska Native
729 91.0% Asian
28 100.0% Native Hawaiian / Pacific Islander
106 70.3% Other race
771 77.9% Two or more races
17,741 83.3% White alone, not Hispanic / Latino
804 73.9% Hispanic or Latino
Moved within same county 1,898 8.7% White / Caucasian
67 8.3% Asian
146 14.7% Two or more races
1,887 8.9% White alone, not Hispanic / Latino
80 7.3% Hispanic or Latino
Moved within same state 1,016 4.7% White / Caucasian
69 13.9% Black or African American
7 0.9% Asian
21 14.1% Other race
45 4.5% Two or more races
989 4.6% White alone, not Hispanic / Latino
108 10.0% Hispanic or Latino
Moved from different state 686 3.2% White / Caucasian
28 18.6% Other race
661 3.1% White alone, not Hispanic / Latino
22 2.0% Hispanic or Latino
Moved from abroad 31 0.1% White
131 26.3% Black or African American
10 1.2% Asian
47 4.7% Two or more races
34 0.2% White alone, not Hispanic / Latino
25 2.3% Hispanic or Latino
Children Nativity (place of birth) in Perrysburg
Children under 6 years - Living with two parents Both parents native 1,235 100.0% NativeBoth parents foreign-born 63 91.8% Native6 8.2% Foreign-bornOne native, one foreign-born parent 100 100.0% NativeChildren under 6 years - Living with one parent Native parent 199 100.0% NativeChildren 6 to 17 years - Living with two parents Both parents native 3,180 98.5% Native48 1.5% Foreign-bornBoth parents foreign-born 129 62.1% Native79 37.9% Foreign-bornOne native, one foreign-born parent 88 100.0% NativeChildren 6 to 17 years - Living with one parent Native parent 768 100.0% NativeForeign-born parent 134 59.1% Native93 40.9% Foreign-born
Grandparents responsible for own grandchildren in Perrysburg
Grandparents (30 to 59 years) White / Caucasian 38 74.4% Responsible for grandchildren13 25.6% Not responsible for grandchildrenAsian 17 100.0% Not responsible for grandchildrenWhite alone, not Hispanic / Latino 37 74.0% Responsible for grandchildren13 26.0% Not responsible for grandchildrenGrandparents (60 years and over) White / Caucasian 109 51.0% Responsible for grandchildren105 49.0% Not responsible for grandchildrenAsian 11 29.2% Responsible for grandchildren26 70.8% Not responsible for grandchildrenWhite alone, not Hispanic / Latino 109 55.0% Responsible for grandchildren89 45.0% Not responsible for grandchildren