Races in Pasadena Hills, Florida (FL) Detailed Stats
Data:
Races - White alone (%)
Races - White alone (% change since 2000)
Races - Black alone (%)
Races - Black alone (% change since 2000)
Races - American Indian alone (%)
Races - American Indian alone (% change since 2000)
Races - Asian alone (%)
Races - Asian alone (% change since 2000)
Races - Hispanic (%)
Races - Hispanic (% change since 2000)
Races - Native Hawaiian and Other Pacific Islander alone (%)
Races - Native Hawaiian and Other Pacific Islander alone (% change since 2000)
Races - Two or more races(%)
Races - Two or more races(% change since 2000)
Races - Other race alone (%)
Races - Other race alone (% change since 2000)
Racial diversity
Place of birth - Born in state of residence (%)
Place of birth - Born in state of residence (%) - White
Place of birth - Born in state of residence (%) - Black or African American
Place of birth - Born in state of residence (%) - Asian
Place of birth - Born in state of residence (%) - Hispanic or Latino
Place of birth - Born in state of residence (%) - American Indian and Alaska Native
Place of birth - Born in state of residence (%) - Multirace
Place of birth - Born in state of residence (%) - Other Race
Place of birth - Born in other state (%)
Place of birth - Born in other state (%) - White
Place of birth - Born in other state (%) - Black or African American
Place of birth - Born in other state (%) - Asian
Place of birth - Born in other state (%) - Hispanic or Latino
Place of birth - Born in other state (%) - American Indian and Alaska Native
Place of birth - Born in other state (%) - Multirace
Place of birth - Born in other state (%) - Other Race
Place of birth - Native, outside of US (%)
Place of birth - Native, outside of US (%) - White
Place of birth - Native, outside of US (%) - Black or African American
Place of birth - Native, outside of US (%) - Asian
Place of birth - Native, outside of US (%) - Hispanic or Latino
Place of birth - Native, outside of US (%) - American Indian and Alaska Native
Place of birth - Native, outside of US (%) - Multirace
Place of birth - Native, outside of US (%) - Other Race
Place of birth - Foreign born (%)
Place of birth - Foreign born (%) - White
Place of birth - Foreign born (%) - Black or African American
Place of birth - Foreign born (%) - Asian
Place of birth - Foreign born (%) - Hispanic or Latino
Place of birth - Foreign born (%) - American Indian and Alaska Native
Place of birth - Foreign born (%) - Multirace
Place of birth - Foreign born (%) - Other Race
Residents speaking English at home (%)
Residents speaking English at home - Born in the United States (%)
Residents speaking English at home - Native, born elsewhere (%)
Residents speaking English at home - Foreign born (%)
Residents speaking Spanish at home (%)
Residents speaking Spanish at home - Born in the United States (%)
Residents speaking Spanish at home - Native, born elsewhere (%)
Residents speaking Spanish at home - Foreign born (%)
Residents speaking other language at home (%)
Residents speaking other language at home - Born in the United States (%)
Residents speaking other language at home - Native, born elsewhere (%)
Residents speaking other language at home - Foreign born (%)
Marital status - Never married (%)
Marital status - Now married (%)
Marital status - Separated (%)
Marital status - Widowed (%)
Marital status - Divorced (%)
Ancestries Reported - Arab (%)
Ancestries Reported - Czech (%)
Ancestries Reported - Danish (%)
Ancestries Reported - Dutch (%)
Ancestries Reported - English (%)
Ancestries Reported - French (%)
Ancestries Reported - French Canadian (%)
Ancestries Reported - German (%)
Ancestries Reported - Greek (%)
Ancestries Reported - Hungarian (%)
Ancestries Reported - Irish (%)
Ancestries Reported - Italian (%)
Ancestries Reported - Lithuanian (%)
Ancestries Reported - Norwegian (%)
Ancestries Reported - Polish (%)
Ancestries Reported - Portuguese (%)
Ancestries Reported - Russian (%)
Ancestries Reported - Scotch-Irish (%)
Ancestries Reported - Scottish (%)
Ancestries Reported - Slovak (%)
Ancestries Reported - Subsaharan African (%)
Ancestries Reported - Swedish (%)
Ancestries Reported - Swiss (%)
Ancestries Reported - Ukrainian (%)
Ancestries Reported - United States (%)
Ancestries Reported - Welsh (%)
Ancestries Reported - West Indian (%)
Ancestries Reported - Other (%)
Geographical mobility - Same house 1 year ago (%)
Geographical mobility - Same house 1 year ago (%) - White
Geographical mobility - Same house 1 year ago (%) - Black or African American
Geographical mobility - Same house 1 year ago (%) - Asian
Geographical mobility - Same house 1 year ago (%) - Hispanic or Latino
Geographical mobility - Same house 1 year ago (%) - American Indian and Alaska Native
Geographical mobility - Same house 1 year ago (%) - Multirace
Geographical mobility - Same house 1 year ago (%) - Other Race
Geographical mobility - Moved within same county (%)
Geographical mobility - Moved within same county (%) - White
Geographical mobility - Moved within same county (%) - Black or African American
Geographical mobility - Moved within same county (%) - Asian
Geographical mobility - Moved within same county (%) - Hispanic or Latino
Geographical mobility - Moved within same county (%) - American Indian and Alaska Native
Geographical mobility - Moved within same county (%) - Multirace
Geographical mobility - Moved within same county (%) - Other Race
Geographical mobility - Moved from different county within same state (%)
Geographical mobility - Moved from different county within same state (%) - White
Geographical mobility - Moved from different county within same state (%) - Black or African American
Geographical mobility - Moved from different county within same state (%) - Asian
Geographical mobility - Moved from different county within same state (%) - Hispanic or Latino
Geographical mobility - Moved from different county within same state (%) - American Indian and Alaska Native
Geographical mobility - Moved from different county within same state (%) - Multirace
Geographical mobility - Moved from different county within same state (%) - Other Race
Geographical mobility - Moved from different state (%)
Geographical mobility - Moved from different state (%) - White
Geographical mobility - Moved from different state (%) - Black or African American
Geographical mobility - Moved from different state (%) - Asian
Geographical mobility - Moved from different state (%) - Hispanic or Latino
Geographical mobility - Moved from different state (%) - American Indian and Alaska Native
Geographical mobility - Moved from different state (%) - Multirace
Geographical mobility - Moved from different state (%) - Other Race
Geographical mobility - Moved from abroad (%)
Geographical mobility - Moved from abroad (%) - White
Geographical mobility - Moved from abroad (%) - Black or African American
Geographical mobility - Moved from abroad (%) - Asian
Geographical mobility - Moved from abroad (%) - Hispanic or Latino
Geographical mobility - Moved from abroad (%) - American Indian and Alaska Native
Geographical mobility - Moved from abroad (%) - Multirace
Geographical mobility - Moved from abroad (%) - Other Race
Place of birth for the foreign-born population - Ireland (%)
Place of birth for the foreign-born population - Denmark (%)
Place of birth for the foreign-born population - Norway (%)
Place of birth for the foreign-born population - Sweden (%)
Place of birth for the foreign-born population - United Kingdom (%)
Place of birth for the foreign-born population - England (%)
Place of birth for the foreign-born population - Scotland (%)
Place of birth for the foreign-born population - Other Northern Europe (%)
Place of birth for the foreign-born population - Austria (%)
Place of birth for the foreign-born population - Belgium (%)
Place of birth for the foreign-born population - France (%)
Place of birth for the foreign-born population - Germany (%)
Place of birth for the foreign-born population - Netherlands (%)
Place of birth for the foreign-born population - Switzerland (%)
Place of birth for the foreign-born population - Other Western Europe (%)
Place of birth for the foreign-born population - Greece (%)
Place of birth for the foreign-born population - Italy (%)
Place of birth for the foreign-born population - Portugal (%)
Place of birth for the foreign-born population - Spain (%)
Place of birth for the foreign-born population - Other Southern Europe (%)
Place of birth for the foreign-born population - Albania (%)
Place of birth for the foreign-born population - Belarus (%)
Place of birth for the foreign-born population - Bosnia and Herzegovina (%)
Place of birth for the foreign-born population - Bulgaria (%)
Place of birth for the foreign-born population - Croatia (%)
Place of birth for the foreign-born population - Czechoslovakia (%)
Place of birth for the foreign-born population - Hungary (%)
Place of birth for the foreign-born population - Latvia (%)
Place of birth for the foreign-born population - Lithuania (%)
Place of birth for the foreign-born population - North Macedonia (Macedonia) (%)
Place of birth for the foreign-born population - Moldova (%)
Place of birth for the foreign-born population - Poland (%)
Place of birth for the foreign-born population - Romania (%)
Place of birth for the foreign-born population - Russia (%)
Place of birth for the foreign-born population - Serbia (%)
Place of birth for the foreign-born population - Ukraine (%)
Place of birth for the foreign-born population - Other Eastern Europe (%)
Place of birth for the foreign-born population - China (%)
Place of birth for the foreign-born population - Hong Kong (%)
Place of birth for the foreign-born population - Taiwan (%)
Place of birth for the foreign-born population - Japan (%)
Place of birth for the foreign-born population - Korea (%)
Place of birth for the foreign-born population - Other Eastern Asia (%)
Place of birth for the foreign-born population - Afghanistan (%)
Place of birth for the foreign-born population - Bangladesh (%)
Place of birth for the foreign-born population - India (%)
Place of birth for the foreign-born population - Iran (%)
Place of birth for the foreign-born population - Kazakhstan (%)
Place of birth for the foreign-born population - Nepal (%)
Place of birth for the foreign-born population - Pakistan (%)
Place of birth for the foreign-born population - Sri Lanka (%)
Place of birth for the foreign-born population - Uzbekistan (%)
Place of birth for the foreign-born population - Other South Central Asia (%)
Place of birth for the foreign-born population - Burma (%)
Place of birth for the foreign-born population - Cambodia (%)
Place of birth for the foreign-born population - Indonesia (%)
Place of birth for the foreign-born population - Laos (%)
Place of birth for the foreign-born population - Malaysia (%)
Place of birth for the foreign-born population - Philippines (%)
Place of birth for the foreign-born population - Singapore (%)
Place of birth for the foreign-born population - Thailand (%)
Place of birth for the foreign-born population - Vietnam (%)
Place of birth for the foreign-born population - Other South Eastern Asia (%)
Place of birth for the foreign-born population - Armenia (%)
Place of birth for the foreign-born population - Iraq (%)
Place of birth for the foreign-born population - Israel (%)
Place of birth for the foreign-born population - Jordan (%)
Place of birth for the foreign-born population - Kuwait (%)
Place of birth for the foreign-born population - Lebanon (%)
Place of birth for the foreign-born population - Saudi Arabia (%)
Place of birth for the foreign-born population - Syria (%)
Place of birth for the foreign-born population - Turkey (%)
Place of birth for the foreign-born population - Yemen (%)
Place of birth for the foreign-born population - Other Western Asia (%)
Place of birth for the foreign-born population - Eritrea (%)
Place of birth for the foreign-born population - Ethiopia (%)
Place of birth for the foreign-born population - Kenya (%)
Place of birth for the foreign-born population - Somalia (%)
Place of birth for the foreign-born population - Uganda (%)
Place of birth for the foreign-born population - Zimbabwe (%)
Place of birth for the foreign-born population - Other Eastern Africa (%)
Place of birth for the foreign-born population - Cameroon (%)
Place of birth for the foreign-born population - Congo (%)
Place of birth for the foreign-born population - Democratic Republic of Congo (Zaire) (%)
Place of birth for the foreign-born population - Other Middle Africa (%)
Place of birth for the foreign-born population - Egypt (%)
Place of birth for the foreign-born population - Morocco (%)
Place of birth for the foreign-born population - Sudan (%)
Place of birth for the foreign-born population - Other Northern Africa (%)
Place of birth for the foreign-born population - South Africa (%)
Place of birth for the foreign-born population - Other Southern Africa (%)
Place of birth for the foreign-born population - Cabo Verde (%)
Place of birth for the foreign-born population - Ghana (%)
Place of birth for the foreign-born population - Liberia (%)
Place of birth for the foreign-born population - Nigeria (%)
Place of birth for the foreign-born population - Senegal (%)
Place of birth for the foreign-born population - Sierra Leone (%)
Place of birth for the foreign-born population - Other Western Africa (%)
Place of birth for the foreign-born population - Australia (%)
Place of birth for the foreign-born population - New Zealand (%)
Place of birth for the foreign-born population - Fiji (%)
Place of birth for the foreign-born population - Micronesia (%)
Place of birth for the foreign-born population - Bahamas (%)
Place of birth for the foreign-born population - Barbados (%)
Place of birth for the foreign-born population - Cuba (%)
Place of birth for the foreign-born population - Dominica (%)
Place of birth for the foreign-born population - Dominican Republic (%)
Place of birth for the foreign-born population - Grenada (%)
Place of birth for the foreign-born population - Haiti (%)
Place of birth for the foreign-born population - Jamaica (%)
Place of birth for the foreign-born population - St. Vincent and the Grenadines (%)
Place of birth for the foreign-born population - Trinidad and Tobago (%)
Place of birth for the foreign-born population - West Indies (%)
Place of birth for the foreign-born population - Other Caribbean (%)
Place of birth for the foreign-born population - Belize (%)
Place of birth for the foreign-born population - Costa Rica (%)
Place of birth for the foreign-born population - El Salvador (%)
Place of birth for the foreign-born population - Guatemala (%)
Place of birth for the foreign-born population - Honduras (%)
Place of birth for the foreign-born population - Mexico (%)
Place of birth for the foreign-born population - Nicaragua (%)
Place of birth for the foreign-born population - Panama (%)
Place of birth for the foreign-born population - Other Central America (%)
Place of birth for the foreign-born population - Argentina (%)
Place of birth for the foreign-born population - Bolivia (%)
Place of birth for the foreign-born population - Brazil (%)
Place of birth for the foreign-born population - Chile (%)
Place of birth for the foreign-born population - Colombia (%)
Place of birth for the foreign-born population - Ecuador (%)
Place of birth for the foreign-born population - Guyana (%)
Place of birth for the foreign-born population - Peru (%)
Place of birth for the foreign-born population - Uruguay (%)
Place of birth for the foreign-born population - Venezuela (%)
Place of birth for the foreign-born population - Other South America (%)
Place of birth for the foreign-born population - Canada (%)
Place of birth for the foreign-born population - Other Northern America (%)
Place of birth for the foreign-born population - Other (%)
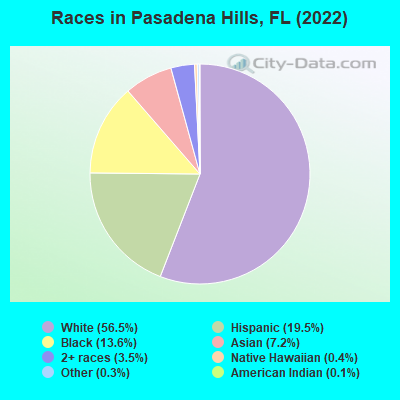
According to 2022 data, the most numerous races in Pasadena Hills, FL are White alone (7,643 residents), Hispanic (2,643 residents), and Black alone (1,838 residents). 81.0% of Pasadena Hills residents speak English at home.
Race distribution in Pasadena Hills 7,643 56.5% White alone 2,643 19.5% Hispanic 1,838 13.6% Black alone 980 7.2% Asian alone 480 3.5% Two or more races 49 0.4% Native Hawaiian and Other 38 0.3% Other race alone 18 0.1% American Indian alone
2000 2022
10,458,509 65.4% White alone 2,682,715 16.8% Hispanic 2,264,268 14.2% Black alone 261,693 1.6% Asian alone 236,954 1.5% Two or more races 42,358 0.3% American Indian alone 28,994 0.2% Other race alone 6,887 0.04% Native Hawaiian and Other
11,309,403 50.8% White alone 6,025,039 27.1% Hispanic 3,241,015 14.6% Black alone 861,630 3.9% Two or more races 623,692 2.8% Asian alone 152,054 0.7% Other race alone 22,504 0.1% American Indian alone 9,486 0.04% Native Hawaiian and Other
Income and house value in Pasadena Hills Median household income in 2022 $71,807 White non-Hispanic householders$94,998 Black householders$80,920 Two or more races householders$73,182 Hispanic or Latino race householders
Median age by race in Pasadena Hills
46.3 Median age for White residents47.9 45.6 39.6 Median age for Black or African American residents39.5 40.2 12.0 Median age for American Indian / Alaska Native residents16.1 11.9 28.8 Median age for Asian residents44.5 28.5 -835,555,554.7 Median age for Native Hawaiian / Pacific Islander residents-858,307,848.3 -444,051,825.2 45.0 Median age for Other race residents52.4 41.7 45.5 Median age for Two or more races residents43.1 47.9 49.3 Median age for White alone residents48.8 49.7 35.0 Median age for Hispanic or Latino residents28.3 37.1
Owner/renter occupied households by race in Pasadena Hills
House owners and renters - White residents 2,966 89.9% Owner occupied333 10.1% Renter occupiedHouse owners and renters - Black or African American residents 535 79.2% Owner occupied141 20.8% Renter occupiedHouse owners and renters - American Indian / Alaska Native residents 13 100.0% Owner occupiedHouse owners and renters - Asian residents 272 93.2% Owner occupied20 6.8% Renter occupiedHouse owners and renters - Native Hawaiian / Pacific Islander residents 78 100.0% Owner occupiedHouse owners and renters - Other race residents 156 100.0% Owner occupiedHouse owners and renters - Two or more races residents 557 97.4% Owner occupied15 2.6% Renter occupiedHouse owners and renters - White alone residents 2,749 88.7% Owner occupied352 11.3% Renter occupiedHouse owners and renters - Hispanic or Latino residents 820 98.3% Owner occupied15 1.7% Renter occupied
Language usage in Pasadena Hills
English speakers - Total 81.0% of residents of Pasadena Hills speak English at home.
14.2% of residents speak Spanish at home 1,364 75.2% Speak English very well449 24.8% Speak English less than very well5.2% of residents speak other language at home 648 96.4% Speak English very well24 3.6% Speak English less than very well
English speakers - Born in the United States 94.5% of residents of Pasadena Hills speak English at home.
4.1% of residents speak Spanish at home 229 100.0% Speak English very well1.0% of residents speak other language at home 44 78.6% Speak English very well12 21.4% Speak English less than very well
English speakers - Native, born elsewhere 14.2% of residents of Pasadena Hills speak English at home.
85.0% of residents speak Spanish at home 359 64.0% Speak English very well202 36.0% Speak English less than very well3.6% of residents speak other language at home 24 100.0% Speak English very well
English speakers - Foreign-born 50.9% of residents of Pasadena Hills speak English at home.
24.7% of residents speak Spanish at home 392 66.1% Speak English very well201 33.9% Speak English less than very well25.4% of residents speak other language at home 600 98.5% Speak English very well9 1.5% Speak English less than very well
White (Caucasian) - Speak only English Native:
94.6% (7,231)Foreign-born:
52.9% (194)
White (Caucasian) - Speak another language Native:
5.1% (392)Foreign-born:
47.3% (173)
Black or African American - Speak only English Native:
93.5% (1,090)Foreign-born:
87.4% (732)
Black or African American - Speak another language Native:
6.3% (74)Foreign-born:
15.2% (127)
Asian - Speak only English Native:
100.0% (257)Foreign-born:
69.0% (504)
Other race - Speak another language Native:
100.0% (213)Foreign-born:
78.8% (260)
Two or more races - Speak only English Native:
43.9% (475)Foreign-born:
5.2% (17)
Two or more races - Speak another language Native:
60.6% (656)Foreign-born:
96.6% (326)
White alone - Speak only English Native:
99.2% (6,892)Foreign-born:
62.7% (218)
White alone - Speak another language Native:
0.8% (53)Foreign-born:
32.7% (114)
Hispanic or Latino - Speak only English Native:
32.6% (582)Foreign-born:
5.5% (34)
Hispanic or Latino - Speak another language Native:
68.3% (1,221)Foreign-born:
95.8% (594)
Foreign-born residents in Pasadena Hills
Marital status for residents in Pasadena Hills Marital status - White (Caucasian) population 15 years and over
Males 24.0% Never married65.0% Now married0.9% Separated2.9% Widowed7.2% DivorcedFemales 17.1% Never married55.8% Now married1.3% Separated17.0% Widowed8.8% DivorcedWomen who gave birth in the past 12 months Now married:
12.4% (16)Unmarried:
87.6% (114)
Women who did not give birth in the past 12 months Now married:
63.5% (1,093)Unmarried:
36.5% (629)
Marital status - Black or African American population 15 years and over
Males 21.9% Never married69.3% Now married3.0% Separated0.0% Widowed5.8% DivorcedFemales 18.8% Never married61.4% Now married1.6% Separated5.8% Widowed12.4% DivorcedWomen who did not give birth in the past 12 months Now married:
76.8% (337)Unmarried:
23.2% (102)
Marital status - American Indian / Alaska Native population 15 years and over
Males 0.0% Never married100.0% Now married0.0% Separated0.0% Widowed0.0% DivorcedFemales 36.4% Never married63.6% Now married0.0% Separated0.0% Widowed0.0% DivorcedWomen who did not give birth in the past 12 months Now married:
63.6% (11)Unmarried:
36.4% (7)
Marital status - Asian population 15 years and over
Males 33.9% Never married66.1% Now married0.0% Separated0.0% Widowed0.0% DivorcedFemales 55.6% Never married44.4% Now married0.0% Separated0.0% Widowed0.0% DivorcedWomen who did not give birth in the past 12 months Now married:
25.7% (92)Unmarried:
74.3% (266)
Marital status - Native Hawaiian / Pacific Islander population 15 years and over
Males 0.0% Never married100.0% Now married0.0% Separated0.0% Widowed0.0% DivorcedFemales 0.0% Never married100.0% Now married0.0% Separated0.0% Widowed0.0% DivorcedMarital status - Other race population 15 years and over
Males 0.0% Never married68.0% Now married0.0% Separated0.0% Widowed32.0% DivorcedFemales 24.2% Never married54.4% Now married9.8% Separated0.0% Widowed11.6% DivorcedWomen who gave birth in the past 12 months Now married:
100.0% (37)Unmarried:
0.0% (0)
Women who did not give birth in the past 12 months Now married:
40.8% (94)Unmarried:
59.2% (137)
Marital status - Two or more races population 15 years and over
Males 14.2% Never married79.6% Now married0.0% Separated5.2% Widowed1.0% DivorcedFemales 12.8% Never married81.4% Now married0.0% Separated5.8% Widowed0.0% DivorcedWomen who did not give birth in the past 12 months Now married:
69.0% (137)Unmarried:
31.0% (62)
Marital status - White alone, not Hispanic / Latino population 15 years and over
Males 25.0% Never married64.3% Now married1.0% Separated3.2% Widowed6.6% DivorcedFemales 16.8% Never married54.0% Now married1.5% Separated19.8% Widowed8.0% DivorcedWomen who gave birth in the past 12 months Now married:
24.6% (17)Unmarried:
75.4% (52)
Women who did not give birth in the past 12 months Now married:
60.7% (864)Unmarried:
39.3% (559)
Marital status - Hispanic or Latino population 15 years and over
Males 15.6% Never married70.9% Now married0.0% Separated3.3% Widowed10.2% DivorcedFemales 18.8% Never married64.6% Now married2.0% Separated1.7% Widowed12.9% DivorcedWomen who gave birth in the past 12 months Now married:
23.6% (24)Unmarried:
76.4% (79)
Women who did not give birth in the past 12 months Now married:
62.8% (507)Unmarried:
37.2% (300)
Ancestries in Pasadena Hills
863 12.1% English858 12.0% American422 5.9% Italian339 4.8% German277 3.9% Jamaican216 3.0% Irish185 2.6% Egyptian143 2.0% Eastern European131 1.8% European100 1.4% Scotch-Irish98 1.4% Polish84 1.2% Dutch56 0.8% Moroccan47 0.7% Swedish42 0.6% Scottish37 0.5% French31 0.4% Ukrainian26 0.4% Welsh24 0.3% Turkish22 0.3% Albanian20 0.3% Haitian15 0.2% Scandinavian14 0.2% Slovene13 0.2% British12 0.2% French Canadian12 0.2% Pennsylvania German12 0.2% Swiss9 0.1% Greek4 0.06% Hungarian
Children Nativity (place of birth) in Pasadena Hills
Children under 6 years - Living with two parents Both parents native 467 100.0% NativeBoth parents foreign-born 33 100.0% NativeOne native, one foreign-born parent 121 100.0% NativeChildren under 6 years - Living with one parent Native parent 270 100.0% NativeChildren 6 to 17 years - Living with two parents Both parents native 1,046 96.2% Native41 3.8% Foreign-bornBoth parents foreign-born 287 69.2% Native128 30.8% Foreign-bornOne native, one foreign-born parent 414 100.0% NativeChildren 6 to 17 years - Living with one parent Native parent 309 100.0% Native
Grandparents responsible for own grandchildren in Pasadena Hills
Grandparents (30 to 59 years) White / Caucasian 18 100.0% Not responsible for grandchildrenHispanic or Latino 24 100.0% Not responsible for grandchildren
Grandparents (60 years and over) White / Caucasian 46 100.0% Not responsible for grandchildren