Races in Palm Valley, Florida (FL) Detailed Stats
Data:
Races - White alone (%)
Races - White alone (% change since 2000)
Races - Black alone (%)
Races - Black alone (% change since 2000)
Races - American Indian alone (%)
Races - American Indian alone (% change since 2000)
Races - Asian alone (%)
Races - Asian alone (% change since 2000)
Races - Hispanic (%)
Races - Hispanic (% change since 2000)
Races - Native Hawaiian and Other Pacific Islander alone (%)
Races - Native Hawaiian and Other Pacific Islander alone (% change since 2000)
Races - Two or more races(%)
Races - Two or more races(% change since 2000)
Races - Other race alone (%)
Races - Other race alone (% change since 2000)
Racial diversity
Place of birth - Born in state of residence (%)
Place of birth - Born in state of residence (%) - White
Place of birth - Born in state of residence (%) - Black or African American
Place of birth - Born in state of residence (%) - Asian
Place of birth - Born in state of residence (%) - Hispanic or Latino
Place of birth - Born in state of residence (%) - American Indian and Alaska Native
Place of birth - Born in state of residence (%) - Multirace
Place of birth - Born in state of residence (%) - Other Race
Place of birth - Born in other state (%)
Place of birth - Born in other state (%) - White
Place of birth - Born in other state (%) - Black or African American
Place of birth - Born in other state (%) - Asian
Place of birth - Born in other state (%) - Hispanic or Latino
Place of birth - Born in other state (%) - American Indian and Alaska Native
Place of birth - Born in other state (%) - Multirace
Place of birth - Born in other state (%) - Other Race
Place of birth - Native, outside of US (%)
Place of birth - Native, outside of US (%) - White
Place of birth - Native, outside of US (%) - Black or African American
Place of birth - Native, outside of US (%) - Asian
Place of birth - Native, outside of US (%) - Hispanic or Latino
Place of birth - Native, outside of US (%) - American Indian and Alaska Native
Place of birth - Native, outside of US (%) - Multirace
Place of birth - Native, outside of US (%) - Other Race
Place of birth - Foreign born (%)
Place of birth - Foreign born (%) - White
Place of birth - Foreign born (%) - Black or African American
Place of birth - Foreign born (%) - Asian
Place of birth - Foreign born (%) - Hispanic or Latino
Place of birth - Foreign born (%) - American Indian and Alaska Native
Place of birth - Foreign born (%) - Multirace
Place of birth - Foreign born (%) - Other Race
Residents speaking English at home (%)
Residents speaking English at home - Born in the United States (%)
Residents speaking English at home - Native, born elsewhere (%)
Residents speaking English at home - Foreign born (%)
Residents speaking Spanish at home (%)
Residents speaking Spanish at home - Born in the United States (%)
Residents speaking Spanish at home - Native, born elsewhere (%)
Residents speaking Spanish at home - Foreign born (%)
Residents speaking other language at home (%)
Residents speaking other language at home - Born in the United States (%)
Residents speaking other language at home - Native, born elsewhere (%)
Residents speaking other language at home - Foreign born (%)
Marital status - Never married (%)
Marital status - Now married (%)
Marital status - Separated (%)
Marital status - Widowed (%)
Marital status - Divorced (%)
Ancestries Reported - Arab (%)
Ancestries Reported - Czech (%)
Ancestries Reported - Danish (%)
Ancestries Reported - Dutch (%)
Ancestries Reported - English (%)
Ancestries Reported - French (%)
Ancestries Reported - French Canadian (%)
Ancestries Reported - German (%)
Ancestries Reported - Greek (%)
Ancestries Reported - Hungarian (%)
Ancestries Reported - Irish (%)
Ancestries Reported - Italian (%)
Ancestries Reported - Lithuanian (%)
Ancestries Reported - Norwegian (%)
Ancestries Reported - Polish (%)
Ancestries Reported - Portuguese (%)
Ancestries Reported - Russian (%)
Ancestries Reported - Scotch-Irish (%)
Ancestries Reported - Scottish (%)
Ancestries Reported - Slovak (%)
Ancestries Reported - Subsaharan African (%)
Ancestries Reported - Swedish (%)
Ancestries Reported - Swiss (%)
Ancestries Reported - Ukrainian (%)
Ancestries Reported - United States (%)
Ancestries Reported - Welsh (%)
Ancestries Reported - West Indian (%)
Ancestries Reported - Other (%)
Geographical mobility - Same house 1 year ago (%)
Geographical mobility - Same house 1 year ago (%) - White
Geographical mobility - Same house 1 year ago (%) - Black or African American
Geographical mobility - Same house 1 year ago (%) - Asian
Geographical mobility - Same house 1 year ago (%) - Hispanic or Latino
Geographical mobility - Same house 1 year ago (%) - American Indian and Alaska Native
Geographical mobility - Same house 1 year ago (%) - Multirace
Geographical mobility - Same house 1 year ago (%) - Other Race
Geographical mobility - Moved within same county (%)
Geographical mobility - Moved within same county (%) - White
Geographical mobility - Moved within same county (%) - Black or African American
Geographical mobility - Moved within same county (%) - Asian
Geographical mobility - Moved within same county (%) - Hispanic or Latino
Geographical mobility - Moved within same county (%) - American Indian and Alaska Native
Geographical mobility - Moved within same county (%) - Multirace
Geographical mobility - Moved within same county (%) - Other Race
Geographical mobility - Moved from different county within same state (%)
Geographical mobility - Moved from different county within same state (%) - White
Geographical mobility - Moved from different county within same state (%) - Black or African American
Geographical mobility - Moved from different county within same state (%) - Asian
Geographical mobility - Moved from different county within same state (%) - Hispanic or Latino
Geographical mobility - Moved from different county within same state (%) - American Indian and Alaska Native
Geographical mobility - Moved from different county within same state (%) - Multirace
Geographical mobility - Moved from different county within same state (%) - Other Race
Geographical mobility - Moved from different state (%)
Geographical mobility - Moved from different state (%) - White
Geographical mobility - Moved from different state (%) - Black or African American
Geographical mobility - Moved from different state (%) - Asian
Geographical mobility - Moved from different state (%) - Hispanic or Latino
Geographical mobility - Moved from different state (%) - American Indian and Alaska Native
Geographical mobility - Moved from different state (%) - Multirace
Geographical mobility - Moved from different state (%) - Other Race
Geographical mobility - Moved from abroad (%)
Geographical mobility - Moved from abroad (%) - White
Geographical mobility - Moved from abroad (%) - Black or African American
Geographical mobility - Moved from abroad (%) - Asian
Geographical mobility - Moved from abroad (%) - Hispanic or Latino
Geographical mobility - Moved from abroad (%) - American Indian and Alaska Native
Geographical mobility - Moved from abroad (%) - Multirace
Geographical mobility - Moved from abroad (%) - Other Race
Place of birth for the foreign-born population - Ireland (%)
Place of birth for the foreign-born population - Denmark (%)
Place of birth for the foreign-born population - Norway (%)
Place of birth for the foreign-born population - Sweden (%)
Place of birth for the foreign-born population - United Kingdom (%)
Place of birth for the foreign-born population - England (%)
Place of birth for the foreign-born population - Scotland (%)
Place of birth for the foreign-born population - Other Northern Europe (%)
Place of birth for the foreign-born population - Austria (%)
Place of birth for the foreign-born population - Belgium (%)
Place of birth for the foreign-born population - France (%)
Place of birth for the foreign-born population - Germany (%)
Place of birth for the foreign-born population - Netherlands (%)
Place of birth for the foreign-born population - Switzerland (%)
Place of birth for the foreign-born population - Other Western Europe (%)
Place of birth for the foreign-born population - Greece (%)
Place of birth for the foreign-born population - Italy (%)
Place of birth for the foreign-born population - Portugal (%)
Place of birth for the foreign-born population - Spain (%)
Place of birth for the foreign-born population - Other Southern Europe (%)
Place of birth for the foreign-born population - Albania (%)
Place of birth for the foreign-born population - Belarus (%)
Place of birth for the foreign-born population - Bosnia and Herzegovina (%)
Place of birth for the foreign-born population - Bulgaria (%)
Place of birth for the foreign-born population - Croatia (%)
Place of birth for the foreign-born population - Czechoslovakia (%)
Place of birth for the foreign-born population - Hungary (%)
Place of birth for the foreign-born population - Latvia (%)
Place of birth for the foreign-born population - Lithuania (%)
Place of birth for the foreign-born population - North Macedonia (Macedonia) (%)
Place of birth for the foreign-born population - Moldova (%)
Place of birth for the foreign-born population - Poland (%)
Place of birth for the foreign-born population - Romania (%)
Place of birth for the foreign-born population - Russia (%)
Place of birth for the foreign-born population - Serbia (%)
Place of birth for the foreign-born population - Ukraine (%)
Place of birth for the foreign-born population - Other Eastern Europe (%)
Place of birth for the foreign-born population - China (%)
Place of birth for the foreign-born population - Hong Kong (%)
Place of birth for the foreign-born population - Taiwan (%)
Place of birth for the foreign-born population - Japan (%)
Place of birth for the foreign-born population - Korea (%)
Place of birth for the foreign-born population - Other Eastern Asia (%)
Place of birth for the foreign-born population - Afghanistan (%)
Place of birth for the foreign-born population - Bangladesh (%)
Place of birth for the foreign-born population - India (%)
Place of birth for the foreign-born population - Iran (%)
Place of birth for the foreign-born population - Kazakhstan (%)
Place of birth for the foreign-born population - Nepal (%)
Place of birth for the foreign-born population - Pakistan (%)
Place of birth for the foreign-born population - Sri Lanka (%)
Place of birth for the foreign-born population - Uzbekistan (%)
Place of birth for the foreign-born population - Other South Central Asia (%)
Place of birth for the foreign-born population - Burma (%)
Place of birth for the foreign-born population - Cambodia (%)
Place of birth for the foreign-born population - Indonesia (%)
Place of birth for the foreign-born population - Laos (%)
Place of birth for the foreign-born population - Malaysia (%)
Place of birth for the foreign-born population - Philippines (%)
Place of birth for the foreign-born population - Singapore (%)
Place of birth for the foreign-born population - Thailand (%)
Place of birth for the foreign-born population - Vietnam (%)
Place of birth for the foreign-born population - Other South Eastern Asia (%)
Place of birth for the foreign-born population - Armenia (%)
Place of birth for the foreign-born population - Iraq (%)
Place of birth for the foreign-born population - Israel (%)
Place of birth for the foreign-born population - Jordan (%)
Place of birth for the foreign-born population - Kuwait (%)
Place of birth for the foreign-born population - Lebanon (%)
Place of birth for the foreign-born population - Saudi Arabia (%)
Place of birth for the foreign-born population - Syria (%)
Place of birth for the foreign-born population - Turkey (%)
Place of birth for the foreign-born population - Yemen (%)
Place of birth for the foreign-born population - Other Western Asia (%)
Place of birth for the foreign-born population - Eritrea (%)
Place of birth for the foreign-born population - Ethiopia (%)
Place of birth for the foreign-born population - Kenya (%)
Place of birth for the foreign-born population - Somalia (%)
Place of birth for the foreign-born population - Uganda (%)
Place of birth for the foreign-born population - Zimbabwe (%)
Place of birth for the foreign-born population - Other Eastern Africa (%)
Place of birth for the foreign-born population - Cameroon (%)
Place of birth for the foreign-born population - Congo (%)
Place of birth for the foreign-born population - Democratic Republic of Congo (Zaire) (%)
Place of birth for the foreign-born population - Other Middle Africa (%)
Place of birth for the foreign-born population - Egypt (%)
Place of birth for the foreign-born population - Morocco (%)
Place of birth for the foreign-born population - Sudan (%)
Place of birth for the foreign-born population - Other Northern Africa (%)
Place of birth for the foreign-born population - South Africa (%)
Place of birth for the foreign-born population - Other Southern Africa (%)
Place of birth for the foreign-born population - Cabo Verde (%)
Place of birth for the foreign-born population - Ghana (%)
Place of birth for the foreign-born population - Liberia (%)
Place of birth for the foreign-born population - Nigeria (%)
Place of birth for the foreign-born population - Senegal (%)
Place of birth for the foreign-born population - Sierra Leone (%)
Place of birth for the foreign-born population - Other Western Africa (%)
Place of birth for the foreign-born population - Australia (%)
Place of birth for the foreign-born population - New Zealand (%)
Place of birth for the foreign-born population - Fiji (%)
Place of birth for the foreign-born population - Micronesia (%)
Place of birth for the foreign-born population - Bahamas (%)
Place of birth for the foreign-born population - Barbados (%)
Place of birth for the foreign-born population - Cuba (%)
Place of birth for the foreign-born population - Dominica (%)
Place of birth for the foreign-born population - Dominican Republic (%)
Place of birth for the foreign-born population - Grenada (%)
Place of birth for the foreign-born population - Haiti (%)
Place of birth for the foreign-born population - Jamaica (%)
Place of birth for the foreign-born population - St. Vincent and the Grenadines (%)
Place of birth for the foreign-born population - Trinidad and Tobago (%)
Place of birth for the foreign-born population - West Indies (%)
Place of birth for the foreign-born population - Other Caribbean (%)
Place of birth for the foreign-born population - Belize (%)
Place of birth for the foreign-born population - Costa Rica (%)
Place of birth for the foreign-born population - El Salvador (%)
Place of birth for the foreign-born population - Guatemala (%)
Place of birth for the foreign-born population - Honduras (%)
Place of birth for the foreign-born population - Mexico (%)
Place of birth for the foreign-born population - Nicaragua (%)
Place of birth for the foreign-born population - Panama (%)
Place of birth for the foreign-born population - Other Central America (%)
Place of birth for the foreign-born population - Argentina (%)
Place of birth for the foreign-born population - Bolivia (%)
Place of birth for the foreign-born population - Brazil (%)
Place of birth for the foreign-born population - Chile (%)
Place of birth for the foreign-born population - Colombia (%)
Place of birth for the foreign-born population - Ecuador (%)
Place of birth for the foreign-born population - Guyana (%)
Place of birth for the foreign-born population - Peru (%)
Place of birth for the foreign-born population - Uruguay (%)
Place of birth for the foreign-born population - Venezuela (%)
Place of birth for the foreign-born population - Other South America (%)
Place of birth for the foreign-born population - Canada (%)
Place of birth for the foreign-born population - Other Northern America (%)
Place of birth for the foreign-born population - Other (%)
According to 2022 data, the most numerous races in Palm Valley, FL are White alone (18,557 residents), Hispanic (1,315 residents), and Black alone (567 residents). 92.8% of Palm Valley residents speak English at home. 7.8% of Palm Valley, FL residents are foreign-born (3.3% born in Europe, 1.9% born in Asia, 1.5% born in Latin America), which is 168.2% less than the foreign-born rate of 21.0% across the entire state of Florida.
Race distribution in Palm Valley
2000 2022
10,458,509 65.4% White alone 2,682,715 16.8% Hispanic 2,264,268 14.2% Black alone 261,693 1.6% Asian alone 236,954 1.5% Two or more races 42,358 0.3% American Indian alone 28,994 0.2% Other race alone 6,887 0.04% Native Hawaiian and Other
11,309,403 50.8% White alone 6,025,039 27.1% Hispanic 3,241,015 14.6% Black alone 861,630 3.9% Two or more races 623,692 2.8% Asian alone 152,054 0.7% Other race alone 22,504 0.1% American Indian alone 9,486 0.04% Native Hawaiian and Other
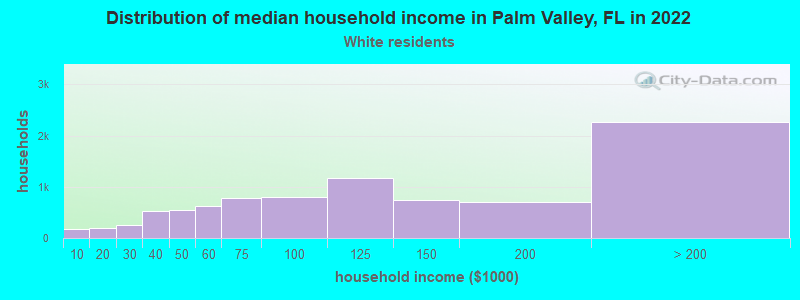
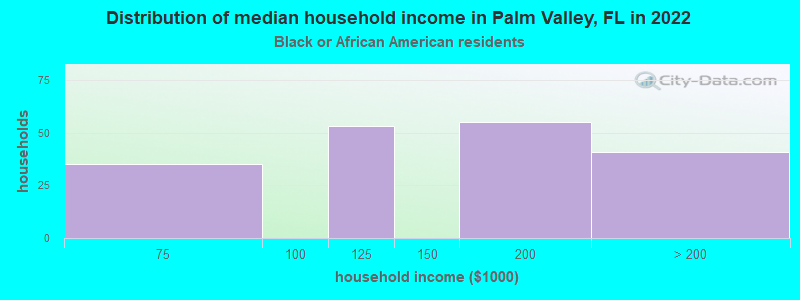
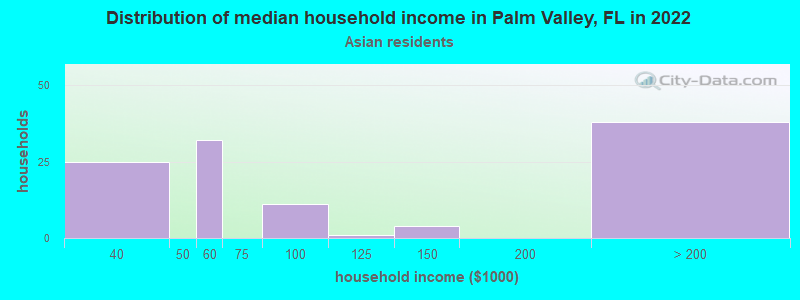
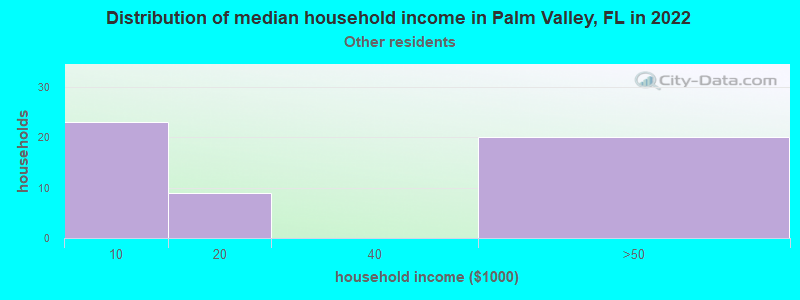
Income and house value in Palm Valley Median household income in 2022 $117,959 White non-Hispanic householders$164,437 Black householdersover $200,000 Two or more races householders$142,923 Hispanic or Latino race householdersMedian 2022 house value $728,409 White Non-Hispanic householders$435,180 Black or African American householders $434,014 Asian householders$702,176 Two or more races householders$848,790 Hispanic or Latino householders
Median age by race in Palm Valley
53.5 Median age for White residents52.8 54.2 37.3 Median age for Black or African American residents18.8 47.6 -801,364,023.1 Median age for American Indian / Alaska Native residents-611,418,047.3 -594,925,633.7 45.6 Median age for Asian residents35.3 50.2 -679,849,340.2 Median age for Native Hawaiian / Pacific Islander residents-666,666,666.0 -443,298,968.6 62.0 Median age for Other race residents82.4 55.4 29.1 Median age for Two or more races residents18.5 31.2 53.1 Median age for White alone residents52.4 53.9 33.2 Median age for Hispanic or Latino residents30.4 37.6
Owner/renter occupied households by race in Palm Valley
House owners and renters - White residents 7,334 83.4% Owner occupied1,463 16.6% Renter occupiedHouse owners and renters - Black or African American residents 205 100.0% Owner occupiedHouse owners and renters - Asian residents 106 81.5% Owner occupied24 18.5% Renter occupiedHouse owners and renters - Other race residents 86 100.0% Owner occupiedHouse owners and renters - Two or more races residents 312 75.6% Owner occupied101 24.4% Renter occupiedHouse owners and renters - White alone residents 7,360 83.8% Owner occupied1,419 16.2% Renter occupiedHouse owners and renters - Hispanic or Latino residents 270 80.7% Owner occupied65 19.3% Renter occupied
Language usage in Palm Valley
English speakers - Total 92.8% of residents of Palm Valley speak English at home.
3.4% of residents speak Spanish at home 684 94.2% Speak English very well42 5.8% Speak English less than very well3.9% of residents speak other language at home 748 90.0% Speak English very well83 10.0% Speak English less than very well
English speakers - Born in the United States 97.2% of residents of Palm Valley speak English at home.
2.1% of residents speak Spanish at home 256 93.4% Speak English very well18 6.6% Speak English less than very well0.7% of residents speak other language at home 81 88.0% Speak English very well11 12.0% Speak English less than very well
English speakers - Native, born elsewhere 48.4% of residents of Palm Valley speak English at home.
38.6% of residents speak Spanish at home 93 69.4% Speak English very well41 30.6% Speak English less than very well4.9% of residents speak other language at home 17 100.0% Speak English very well
English speakers - Foreign-born 64.9% of residents of Palm Valley speak English at home.
10.5% of residents speak Spanish at home 180 91.8% Speak English very well16 8.2% Speak English less than very well31.1% of residents speak other language at home 523 89.9% Speak English very well59 10.1% Speak English less than very well
White (Caucasian) - Speak only English Native:
97.0% (16,422)Foreign-born:
67.0% (782)
White (Caucasian) - Speak another language Native:
3.0% (509)Foreign-born:
32.7% (382)
Black or African American - Speak only English Native:
99.8% (396)Foreign-born:
97.0% (70)
Asian - Speak only English Native:
100.0% (144)Foreign-born:
33.8% (100)
Other race - Speak another language Native:
36.7% (27)Foreign-born:
94.1% (131)
Two or more races - Speak only English Native:
76.1% (1,141)Foreign-born:
100.0% (56)
Two or more races - Speak another language Native:
23.4% (351)Foreign-born:
29.1% (16)
White alone - Speak only English Native:
97.2% (16,404)Foreign-born:
64.0% (820)
White alone - Speak another language Native:
3.0% (499)Foreign-born:
31.4% (402)
Hispanic or Latino - Speak only English Native:
62.2% (647)Foreign-born:
45.7% (104)
Hispanic or Latino - Speak another language Native:
36.8% (382)Foreign-born:
64.6% (148)
Foreign-born residents in Palm Valley 1,704 residents are foreign born (3.3% Europe , 1.9% Asia , 1.5% Latin America ).
This city:
7.8%Florida:
21.1%
Marital status for residents in Palm Valley Marital status - White (Caucasian) population 15 years and over
Males 20.2% Never married62.6% Now married0.3% Separated4.9% Widowed12.0% DivorcedFemales 21.6% Never married53.4% Now married1.2% Separated11.3% Widowed12.4% DivorcedWomen who gave birth in the past 12 months Now married:
100.0% (97)Unmarried:
0.0% (0)
Women who did not give birth in the past 12 months Now married:
43.8% (1,488)Unmarried:
56.2% (1,906)
Marital status - Black or African American population 15 years and over
Males 41.1% Never married43.0% Now married0.0% Separated0.0% Widowed15.9% DivorcedFemales 0.0% Never married73.6% Now married0.0% Separated26.4% Widowed0.0% DivorcedWomen who did not give birth in the past 12 months Now married:
100.0% (80)Unmarried:
0.0% (0)
Marital status - Asian population 15 years and over
Males 19.6% Never married80.4% Now married0.0% Separated0.0% Widowed0.0% DivorcedFemales 14.8% Never married76.2% Now married0.0% Separated4.8% Widowed4.2% DivorcedWomen who did not give birth in the past 12 months Now married:
64.1% (61)Unmarried:
35.9% (34)
Marital status - Other race population 15 years and over
Males 0.0% Never married33.3% Now married66.7% Separated0.0% Widowed0.0% DivorcedFemales 36.0% Never married15.1% Now married0.0% Separated31.4% Widowed17.4% DivorcedWomen who did not give birth in the past 12 months Now married:
29.5% (19)Unmarried:
70.5% (44)
Marital status - Two or more races population 15 years and over
Males 45.1% Never married54.9% Now married0.0% Separated0.0% Widowed0.0% DivorcedFemales 17.3% Never married61.4% Now married0.0% Separated0.0% Widowed21.3% DivorcedWomen who gave birth in the past 12 months Now married:
100.0% (75)Unmarried:
0.0% (0)
Women who did not give birth in the past 12 months Now married:
43.0% (94)Unmarried:
57.0% (125)
Marital status - White alone, not Hispanic / Latino population 15 years and over
Males 20.1% Never married62.5% Now married0.3% Separated5.0% Widowed12.1% DivorcedFemales 21.1% Never married53.8% Now married1.2% Separated11.3% Widowed12.6% DivorcedWomen who gave birth in the past 12 months Now married:
100.0% (96)Unmarried:
0.0% (0)
Women who did not give birth in the past 12 months Now married:
44.3% (1,473)Unmarried:
55.7% (1,850)
Marital status - Hispanic or Latino population 15 years and over
Males 29.7% Never married64.5% Now married2.0% Separated0.0% Widowed3.7% DivorcedFemales 32.8% Never married43.0% Now married0.0% Separated6.7% Widowed17.5% DivorcedWomen who gave birth in the past 12 months Now married:
100.0% (69)Unmarried:
0.0% (0)
Women who did not give birth in the past 12 months Now married:
39.9% (162)Unmarried:
60.1% (243)
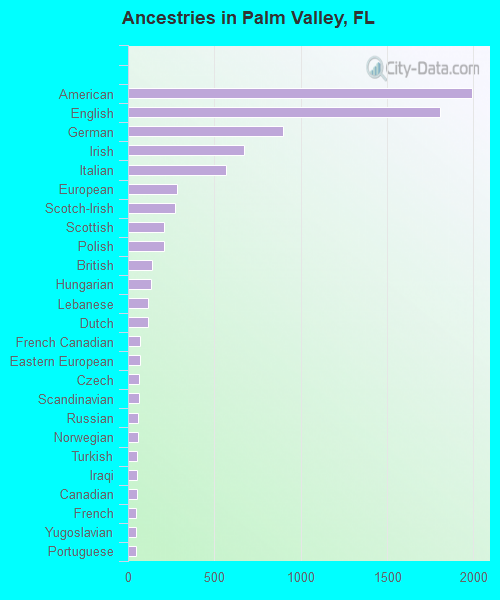
Ancestries in Palm Valley
1,991 20.4% American1,809 18.6% English898 9.2% German672 6.9% Irish566 5.8% Italian285 2.9% European271 2.8% Scotch-Irish211 2.2% Scottish208 2.1% Polish141 1.4% British132 1.4% Hungarian115 1.2% Lebanese114 1.2% Dutch68 0.7% French Canadian68 0.7% Eastern European66 0.7% Czech65 0.7% Scandinavian59 0.6% Russian56 0.6% Norwegian54 0.6% Turkish50 0.5% Iraqi50 0.5% Canadian47 0.5% French45 0.5% Yugoslavian45 0.5% Portuguese41 0.4% Northern European40 0.4% Armenian39 0.4% African39 0.4% Jamaican31 0.3% Albanian30 0.3% Swedish27 0.3% Croatian23 0.2% Welsh21 0.2% Romanian18 0.2% Greek18 0.2% Austrian17 0.2% Swiss14 0.1% Pennsylvania German14 0.1% Israeli12 0.1% Nigerian6 0.06% Iranian6 0.06% Ukrainian5 0.05% Australian
Children Nativity (place of birth) in Palm Valley
Children under 6 years - Living with two parents Both parents native 400 100.0% NativeBoth parents foreign-born 117 100.0% NativeOne native, one foreign-born parent 66 100.0% NativeChildren under 6 years - Living with one parent Native parent 94 100.0% NativeChildren 6 to 17 years - Living with two parents Both parents native 2,313 99.6% Native9 0.4% Foreign-bornBoth parents foreign-born 123 98.0% Native2 2.0% Foreign-bornOne native, one foreign-born parent 509 100.0% NativeChildren 6 to 17 years - Living with one parent Native parent 322 93.2% Native24 6.8% Foreign-bornForeign-born parent 64 67.9% Native30 32.1% Foreign-born
Grandparents responsible for own grandchildren in Palm Valley
Grandparents (30 to 59 years) White / Caucasian 27 74.3% Responsible for grandchildren9 25.7% Not responsible for grandchildrenTwo or more races 5 100.0% Not responsible for grandchildrenWhite alone, not Hispanic / Latino 31 77.2% Responsible for grandchildren9 22.8% Not responsible for grandchildrenHispanic or Latino 3 100.0% Not responsible for grandchildrenGrandparents (60 years and over) White / Caucasian 110 59.6% Responsible for grandchildren75 40.4% Not responsible for grandchildrenTwo or more races 11 58.2% Responsible for grandchildren8 41.8% Not responsible for grandchildrenWhite alone, not Hispanic / Latino 110 58.3% Responsible for grandchildren79 41.7% Not responsible for grandchildren