Races in Palm River-Clair Mel, Florida (FL) Detailed Stats
Data:
Races - White alone (%)
Races - White alone (% change since 2000)
Races - Black alone (%)
Races - Black alone (% change since 2000)
Races - American Indian alone (%)
Races - American Indian alone (% change since 2000)
Races - Asian alone (%)
Races - Asian alone (% change since 2000)
Races - Hispanic (%)
Races - Hispanic (% change since 2000)
Races - Native Hawaiian and Other Pacific Islander alone (%)
Races - Native Hawaiian and Other Pacific Islander alone (% change since 2000)
Races - Two or more races(%)
Races - Two or more races(% change since 2000)
Races - Other race alone (%)
Races - Other race alone (% change since 2000)
Racial diversity
Place of birth - Born in state of residence (%)
Place of birth - Born in state of residence (%) - White
Place of birth - Born in state of residence (%) - Black or African American
Place of birth - Born in state of residence (%) - Asian
Place of birth - Born in state of residence (%) - Hispanic or Latino
Place of birth - Born in state of residence (%) - American Indian and Alaska Native
Place of birth - Born in state of residence (%) - Multirace
Place of birth - Born in state of residence (%) - Other Race
Place of birth - Born in other state (%)
Place of birth - Born in other state (%) - White
Place of birth - Born in other state (%) - Black or African American
Place of birth - Born in other state (%) - Asian
Place of birth - Born in other state (%) - Hispanic or Latino
Place of birth - Born in other state (%) - American Indian and Alaska Native
Place of birth - Born in other state (%) - Multirace
Place of birth - Born in other state (%) - Other Race
Place of birth - Native, outside of US (%)
Place of birth - Native, outside of US (%) - White
Place of birth - Native, outside of US (%) - Black or African American
Place of birth - Native, outside of US (%) - Asian
Place of birth - Native, outside of US (%) - Hispanic or Latino
Place of birth - Native, outside of US (%) - American Indian and Alaska Native
Place of birth - Native, outside of US (%) - Multirace
Place of birth - Native, outside of US (%) - Other Race
Place of birth - Foreign born (%)
Place of birth - Foreign born (%) - White
Place of birth - Foreign born (%) - Black or African American
Place of birth - Foreign born (%) - Asian
Place of birth - Foreign born (%) - Hispanic or Latino
Place of birth - Foreign born (%) - American Indian and Alaska Native
Place of birth - Foreign born (%) - Multirace
Place of birth - Foreign born (%) - Other Race
Residents speaking English at home (%)
Residents speaking English at home - Born in the United States (%)
Residents speaking English at home - Native, born elsewhere (%)
Residents speaking English at home - Foreign born (%)
Residents speaking Spanish at home (%)
Residents speaking Spanish at home - Born in the United States (%)
Residents speaking Spanish at home - Native, born elsewhere (%)
Residents speaking Spanish at home - Foreign born (%)
Residents speaking other language at home (%)
Residents speaking other language at home - Born in the United States (%)
Residents speaking other language at home - Native, born elsewhere (%)
Residents speaking other language at home - Foreign born (%)
Marital status - Never married (%)
Marital status - Now married (%)
Marital status - Separated (%)
Marital status - Widowed (%)
Marital status - Divorced (%)
Ancestries Reported - Arab (%)
Ancestries Reported - Czech (%)
Ancestries Reported - Danish (%)
Ancestries Reported - Dutch (%)
Ancestries Reported - English (%)
Ancestries Reported - French (%)
Ancestries Reported - French Canadian (%)
Ancestries Reported - German (%)
Ancestries Reported - Greek (%)
Ancestries Reported - Hungarian (%)
Ancestries Reported - Irish (%)
Ancestries Reported - Italian (%)
Ancestries Reported - Lithuanian (%)
Ancestries Reported - Norwegian (%)
Ancestries Reported - Polish (%)
Ancestries Reported - Portuguese (%)
Ancestries Reported - Russian (%)
Ancestries Reported - Scotch-Irish (%)
Ancestries Reported - Scottish (%)
Ancestries Reported - Slovak (%)
Ancestries Reported - Subsaharan African (%)
Ancestries Reported - Swedish (%)
Ancestries Reported - Swiss (%)
Ancestries Reported - Ukrainian (%)
Ancestries Reported - United States (%)
Ancestries Reported - Welsh (%)
Ancestries Reported - West Indian (%)
Ancestries Reported - Other (%)
Geographical mobility - Same house 1 year ago (%)
Geographical mobility - Same house 1 year ago (%) - White
Geographical mobility - Same house 1 year ago (%) - Black or African American
Geographical mobility - Same house 1 year ago (%) - Asian
Geographical mobility - Same house 1 year ago (%) - Hispanic or Latino
Geographical mobility - Same house 1 year ago (%) - American Indian and Alaska Native
Geographical mobility - Same house 1 year ago (%) - Multirace
Geographical mobility - Same house 1 year ago (%) - Other Race
Geographical mobility - Moved within same county (%)
Geographical mobility - Moved within same county (%) - White
Geographical mobility - Moved within same county (%) - Black or African American
Geographical mobility - Moved within same county (%) - Asian
Geographical mobility - Moved within same county (%) - Hispanic or Latino
Geographical mobility - Moved within same county (%) - American Indian and Alaska Native
Geographical mobility - Moved within same county (%) - Multirace
Geographical mobility - Moved within same county (%) - Other Race
Geographical mobility - Moved from different county within same state (%)
Geographical mobility - Moved from different county within same state (%) - White
Geographical mobility - Moved from different county within same state (%) - Black or African American
Geographical mobility - Moved from different county within same state (%) - Asian
Geographical mobility - Moved from different county within same state (%) - Hispanic or Latino
Geographical mobility - Moved from different county within same state (%) - American Indian and Alaska Native
Geographical mobility - Moved from different county within same state (%) - Multirace
Geographical mobility - Moved from different county within same state (%) - Other Race
Geographical mobility - Moved from different state (%)
Geographical mobility - Moved from different state (%) - White
Geographical mobility - Moved from different state (%) - Black or African American
Geographical mobility - Moved from different state (%) - Asian
Geographical mobility - Moved from different state (%) - Hispanic or Latino
Geographical mobility - Moved from different state (%) - American Indian and Alaska Native
Geographical mobility - Moved from different state (%) - Multirace
Geographical mobility - Moved from different state (%) - Other Race
Geographical mobility - Moved from abroad (%)
Geographical mobility - Moved from abroad (%) - White
Geographical mobility - Moved from abroad (%) - Black or African American
Geographical mobility - Moved from abroad (%) - Asian
Geographical mobility - Moved from abroad (%) - Hispanic or Latino
Geographical mobility - Moved from abroad (%) - American Indian and Alaska Native
Geographical mobility - Moved from abroad (%) - Multirace
Geographical mobility - Moved from abroad (%) - Other Race
Place of birth for the foreign-born population - Ireland (%)
Place of birth for the foreign-born population - Denmark (%)
Place of birth for the foreign-born population - Norway (%)
Place of birth for the foreign-born population - Sweden (%)
Place of birth for the foreign-born population - United Kingdom (%)
Place of birth for the foreign-born population - England (%)
Place of birth for the foreign-born population - Scotland (%)
Place of birth for the foreign-born population - Other Northern Europe (%)
Place of birth for the foreign-born population - Austria (%)
Place of birth for the foreign-born population - Belgium (%)
Place of birth for the foreign-born population - France (%)
Place of birth for the foreign-born population - Germany (%)
Place of birth for the foreign-born population - Netherlands (%)
Place of birth for the foreign-born population - Switzerland (%)
Place of birth for the foreign-born population - Other Western Europe (%)
Place of birth for the foreign-born population - Greece (%)
Place of birth for the foreign-born population - Italy (%)
Place of birth for the foreign-born population - Portugal (%)
Place of birth for the foreign-born population - Spain (%)
Place of birth for the foreign-born population - Other Southern Europe (%)
Place of birth for the foreign-born population - Albania (%)
Place of birth for the foreign-born population - Belarus (%)
Place of birth for the foreign-born population - Bosnia and Herzegovina (%)
Place of birth for the foreign-born population - Bulgaria (%)
Place of birth for the foreign-born population - Croatia (%)
Place of birth for the foreign-born population - Czechoslovakia (%)
Place of birth for the foreign-born population - Hungary (%)
Place of birth for the foreign-born population - Latvia (%)
Place of birth for the foreign-born population - Lithuania (%)
Place of birth for the foreign-born population - North Macedonia (Macedonia) (%)
Place of birth for the foreign-born population - Moldova (%)
Place of birth for the foreign-born population - Poland (%)
Place of birth for the foreign-born population - Romania (%)
Place of birth for the foreign-born population - Russia (%)
Place of birth for the foreign-born population - Serbia (%)
Place of birth for the foreign-born population - Ukraine (%)
Place of birth for the foreign-born population - Other Eastern Europe (%)
Place of birth for the foreign-born population - China (%)
Place of birth for the foreign-born population - Hong Kong (%)
Place of birth for the foreign-born population - Taiwan (%)
Place of birth for the foreign-born population - Japan (%)
Place of birth for the foreign-born population - Korea (%)
Place of birth for the foreign-born population - Other Eastern Asia (%)
Place of birth for the foreign-born population - Afghanistan (%)
Place of birth for the foreign-born population - Bangladesh (%)
Place of birth for the foreign-born population - India (%)
Place of birth for the foreign-born population - Iran (%)
Place of birth for the foreign-born population - Kazakhstan (%)
Place of birth for the foreign-born population - Nepal (%)
Place of birth for the foreign-born population - Pakistan (%)
Place of birth for the foreign-born population - Sri Lanka (%)
Place of birth for the foreign-born population - Uzbekistan (%)
Place of birth for the foreign-born population - Other South Central Asia (%)
Place of birth for the foreign-born population - Burma (%)
Place of birth for the foreign-born population - Cambodia (%)
Place of birth for the foreign-born population - Indonesia (%)
Place of birth for the foreign-born population - Laos (%)
Place of birth for the foreign-born population - Malaysia (%)
Place of birth for the foreign-born population - Philippines (%)
Place of birth for the foreign-born population - Singapore (%)
Place of birth for the foreign-born population - Thailand (%)
Place of birth for the foreign-born population - Vietnam (%)
Place of birth for the foreign-born population - Other South Eastern Asia (%)
Place of birth for the foreign-born population - Armenia (%)
Place of birth for the foreign-born population - Iraq (%)
Place of birth for the foreign-born population - Israel (%)
Place of birth for the foreign-born population - Jordan (%)
Place of birth for the foreign-born population - Kuwait (%)
Place of birth for the foreign-born population - Lebanon (%)
Place of birth for the foreign-born population - Saudi Arabia (%)
Place of birth for the foreign-born population - Syria (%)
Place of birth for the foreign-born population - Turkey (%)
Place of birth for the foreign-born population - Yemen (%)
Place of birth for the foreign-born population - Other Western Asia (%)
Place of birth for the foreign-born population - Eritrea (%)
Place of birth for the foreign-born population - Ethiopia (%)
Place of birth for the foreign-born population - Kenya (%)
Place of birth for the foreign-born population - Somalia (%)
Place of birth for the foreign-born population - Uganda (%)
Place of birth for the foreign-born population - Zimbabwe (%)
Place of birth for the foreign-born population - Other Eastern Africa (%)
Place of birth for the foreign-born population - Cameroon (%)
Place of birth for the foreign-born population - Congo (%)
Place of birth for the foreign-born population - Democratic Republic of Congo (Zaire) (%)
Place of birth for the foreign-born population - Other Middle Africa (%)
Place of birth for the foreign-born population - Egypt (%)
Place of birth for the foreign-born population - Morocco (%)
Place of birth for the foreign-born population - Sudan (%)
Place of birth for the foreign-born population - Other Northern Africa (%)
Place of birth for the foreign-born population - South Africa (%)
Place of birth for the foreign-born population - Other Southern Africa (%)
Place of birth for the foreign-born population - Cabo Verde (%)
Place of birth for the foreign-born population - Ghana (%)
Place of birth for the foreign-born population - Liberia (%)
Place of birth for the foreign-born population - Nigeria (%)
Place of birth for the foreign-born population - Senegal (%)
Place of birth for the foreign-born population - Sierra Leone (%)
Place of birth for the foreign-born population - Other Western Africa (%)
Place of birth for the foreign-born population - Australia (%)
Place of birth for the foreign-born population - New Zealand (%)
Place of birth for the foreign-born population - Fiji (%)
Place of birth for the foreign-born population - Micronesia (%)
Place of birth for the foreign-born population - Bahamas (%)
Place of birth for the foreign-born population - Barbados (%)
Place of birth for the foreign-born population - Cuba (%)
Place of birth for the foreign-born population - Dominica (%)
Place of birth for the foreign-born population - Dominican Republic (%)
Place of birth for the foreign-born population - Grenada (%)
Place of birth for the foreign-born population - Haiti (%)
Place of birth for the foreign-born population - Jamaica (%)
Place of birth for the foreign-born population - St. Vincent and the Grenadines (%)
Place of birth for the foreign-born population - Trinidad and Tobago (%)
Place of birth for the foreign-born population - West Indies (%)
Place of birth for the foreign-born population - Other Caribbean (%)
Place of birth for the foreign-born population - Belize (%)
Place of birth for the foreign-born population - Costa Rica (%)
Place of birth for the foreign-born population - El Salvador (%)
Place of birth for the foreign-born population - Guatemala (%)
Place of birth for the foreign-born population - Honduras (%)
Place of birth for the foreign-born population - Mexico (%)
Place of birth for the foreign-born population - Nicaragua (%)
Place of birth for the foreign-born population - Panama (%)
Place of birth for the foreign-born population - Other Central America (%)
Place of birth for the foreign-born population - Argentina (%)
Place of birth for the foreign-born population - Bolivia (%)
Place of birth for the foreign-born population - Brazil (%)
Place of birth for the foreign-born population - Chile (%)
Place of birth for the foreign-born population - Colombia (%)
Place of birth for the foreign-born population - Ecuador (%)
Place of birth for the foreign-born population - Guyana (%)
Place of birth for the foreign-born population - Peru (%)
Place of birth for the foreign-born population - Uruguay (%)
Place of birth for the foreign-born population - Venezuela (%)
Place of birth for the foreign-born population - Other South America (%)
Place of birth for the foreign-born population - Canada (%)
Place of birth for the foreign-born population - Other Northern America (%)
Place of birth for the foreign-born population - Other (%)
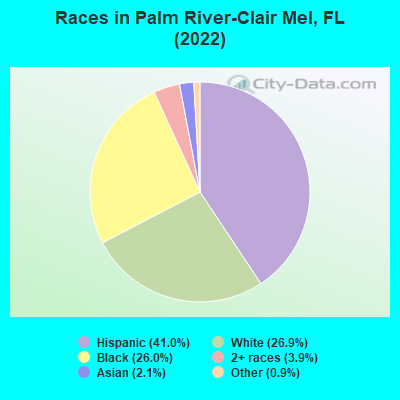
According to 2022 data, the most numerous races in Palm River-Clair Mel, FL are White alone (7,143 residents), Hispanic (10,866 residents), and Black alone (6,890 residents). 61.3% of Palm River-Clair Mel residents speak English at home. 21.0% of Palm River-Clair Mel, FL residents are foreign-born (17.7% born in Latin America), which is about the same as the foreign-born rate of 21.0% across the entire state of Florida.
Race distribution in Palm River-Clair Mel
2000 2022
10,458,509 65.4% White alone 2,682,715 16.8% Hispanic 2,264,268 14.2% Black alone 261,693 1.6% Asian alone 236,954 1.5% Two or more races 42,358 0.3% American Indian alone 28,994 0.2% Other race alone 6,887 0.04% Native Hawaiian and Other
11,309,403 50.8% White alone 6,025,039 27.1% Hispanic 3,241,015 14.6% Black alone 861,630 3.9% Two or more races 623,692 2.8% Asian alone 152,054 0.7% Other race alone 22,504 0.1% American Indian alone 9,486 0.04% Native Hawaiian and Other
Income and house value in Palm River-Clair Mel Median household income in 2022 $79,912 White non-Hispanic householders$58,095 Black householders$106,884 Asian householders$55,647 Some other race householders$47,443 Two or more races householders$54,050 Hispanic or Latino race householdersMedian 2022 house value $271,828 White Non-Hispanic householders$260,566 Black or African American householders$126,205 American Indian or Alaska Native householders $304,059 Asian householders$252,800 Some other race householders$284,254 Two or more races householders$257,459 Hispanic or Latino householders
Median age by race in Palm River-Clair Mel
34.2 Median age for White residents30.9 38.5 35.3 Median age for Black or African American residents39.6 34.0 39.1 Median age for American Indian / Alaska Native residents-676,245,210.1 37.5 38.4 Median age for Asian residents37.9 39.7 -848,484,847.6 Median age for Native Hawaiian / Pacific Islander residents-776,729,559.0 -490,118,576.6 37.7 Median age for Other race residents40.7 36.2 31.8 Median age for Two or more races residents30.6 35.3 33.8 Median age for White alone residents28.4 40.7 35.8 Median age for Hispanic or Latino residents35.5 36.5
Owner/renter occupied households by race in Palm River-Clair Mel
House owners and renters - White residents 2,740 67.7% Owner occupied1,304 32.3% Renter occupiedHouse owners and renters - Black or African American residents 1,651 62.3% Owner occupied998 37.7% Renter occupiedHouse owners and renters - American Indian / Alaska Native residents 43 100.0% Owner occupiedHouse owners and renters - Asian residents 130 59.7% Owner occupied88 40.3% Renter occupiedHouse owners and renters - Other race residents 458 51.4% Owner occupied433 48.6% Renter occupiedHouse owners and renters - Two or more races residents 1,520 60.7% Owner occupied984 39.3% Renter occupiedHouse owners and renters - White alone residents 1,985 68.1% Owner occupied931 31.9% Renter occupiedHouse owners and renters - Hispanic or Latino residents 2,189 57.7% Owner occupied1,607 42.3% Renter occupied
Language usage in Palm River-Clair Mel
English speakers - Total 61.3% of residents of Palm River-Clair Mel speak English at home.
33.5% of residents speak Spanish at home 4,013 48.5% Speak English very well4,267 51.5% Speak English less than very well5.2% of residents speak other language at home 949 74.4% Speak English very well326 25.6% Speak English less than very well
English speakers - Born in the United States 83.3% of residents of Palm River-Clair Mel speak English at home.
14.3% of residents speak Spanish at home 910 86.7% Speak English very well140 13.3% Speak English less than very well2.0% of residents speak other language at home 150 100.0% Speak English very well
English speakers - Native, born elsewhere 12.3% of residents of Palm River-Clair Mel speak English at home.
84.6% of residents speak Spanish at home 1,062 57.4% Speak English very well789 42.6% Speak English less than very well
English speakers - Foreign-born 10.4% of residents of Palm River-Clair Mel speak English at home.
74.3% of residents speak Spanish at home 1,220 28.4% Speak English very well3,081 71.6% Speak English less than very well15.6% of residents speak other language at home 583 64.4% Speak English very well322 35.6% Speak English less than very well
White (Caucasian) - Speak only English Native:
84.8% (7,168)Foreign-born:
4.8% (43)
White (Caucasian) - Speak another language Native:
10.3% (874)Foreign-born:
82.6% (740)
Black or African American - Speak only English Native:
95.4% (5,554)Foreign-born:
59.2% (466)
Black or African American - Speak another language Native:
4.6% (268)Foreign-born:
40.6% (320)
American Indian / Alaska Native - Speak another language Native:
100.0% (85)Foreign-born:
100.0% (56)
Asian - Speak only English Native:
44.2% (38)Foreign-born:
25.1% (100)
Asian - Speak another language Native:
56.9% (49)Foreign-born:
75.1% (300)
Other race - Speak another language Native:
76.8% (1,052)Foreign-born:
100.0% (1,375)
Two or more races - Speak only English Native:
41.5% (1,554)Foreign-born:
2.6% (62)
Two or more races - Speak another language Native:
59.7% (2,234)Foreign-born:
99.2% (2,376)
White alone - Speak only English Native:
97.4% (6,559)Foreign-born:
19.9% (33)
White alone - Speak another language Native:
2.6% (175)Foreign-born:
78.3% (128)
Hispanic or Latino - Speak only English Native:
30.9% (1,760)Foreign-born:
1.4% (61)
Hispanic or Latino - Speak another language Native:
66.8% (3,808)Foreign-born:
98.9% (4,313)
Foreign-born residents in Palm River-Clair Mel 5,568 residents are foreign born (17.7% Latin America ).
This city:
21.0%Florida:
21.1%
Marital status for residents in Palm River-Clair Mel Marital status - White (Caucasian) population 15 years and over
Males 47.4% Never married35.8% Now married3.1% Separated2.0% Widowed11.7% DivorcedFemales 32.6% Never married35.0% Now married0.6% Separated13.4% Widowed18.4% DivorcedWomen who gave birth in the past 12 months Now married:
50.5% (95)Unmarried:
49.5% (93)
Women who did not give birth in the past 12 months Now married:
31.4% (634)Unmarried:
68.6% (1,383)
Marital status - Black or African American population 15 years and over
Males 46.1% Never married34.8% Now married0.7% Separated2.5% Widowed16.0% DivorcedFemales 42.1% Never married20.6% Now married6.0% Separated9.6% Widowed21.7% DivorcedWomen who gave birth in the past 12 months Now married:
0.0% (0)Unmarried:
100.0% (49)
Women who did not give birth in the past 12 months Now married:
21.8% (363)Unmarried:
78.2% (1,300)
Marital status - American Indian / Alaska Native population 15 years and over
Males 50.0% Never married50.0% Now married0.0% Separated0.0% Widowed0.0% DivorcedFemales 24.2% Never married16.7% Now married24.2% Separated10.6% Widowed24.2% DivorcedWomen who did not give birth in the past 12 months Now married:
33.3% (32)Unmarried:
66.7% (64)
Marital status - Asian population 15 years and over
Males 9.9% Never married66.2% Now married15.9% Separated0.0% Widowed7.9% DivorcedFemales 3.0% Never married62.0% Now married0.0% Separated26.6% Widowed8.4% DivorcedWomen who gave birth in the past 12 months Now married:
100.0% (43)Unmarried:
0.0% (0)
Women who did not give birth in the past 12 months Now married:
73.9% (91)Unmarried:
26.1% (32)
Marital status - Other race population 15 years and over
Males 30.9% Never married46.2% Now married6.7% Separated2.7% Widowed13.5% DivorcedFemales 28.2% Never married38.0% Now married4.5% Separated10.8% Widowed18.6% DivorcedWomen who gave birth in the past 12 months Now married:
75.9% (60)Unmarried:
24.1% (19)
Women who did not give birth in the past 12 months Now married:
40.1% (268)Unmarried:
59.9% (399)
Marital status - Two or more races population 15 years and over
Males 39.6% Never married44.5% Now married1.4% Separated0.0% Widowed14.5% DivorcedFemales 30.6% Never married43.8% Now married0.5% Separated5.6% Widowed19.6% DivorcedWomen who gave birth in the past 12 months Now married:
29.6% (44)Unmarried:
70.4% (106)
Women who did not give birth in the past 12 months Now married:
40.5% (637)Unmarried:
59.5% (937)
Marital status - White alone, not Hispanic / Latino population 15 years and over
Males 46.1% Never married36.4% Now married1.4% Separated3.3% Widowed12.9% DivorcedFemales 27.5% Never married35.8% Now married0.1% Separated18.9% Widowed17.6% DivorcedWomen who gave birth in the past 12 months Now married:
56.2% (41)Unmarried:
43.8% (32)
Women who did not give birth in the past 12 months Now married:
35.9% (478)Unmarried:
64.1% (855)
Marital status - Hispanic or Latino population 15 years and over
Males 41.1% Never married41.9% Now married3.6% Separated0.6% Widowed12.8% DivorcedFemales 32.9% Never married37.3% Now married2.1% Separated6.4% Widowed21.3% DivorcedWomen who gave birth in the past 12 months Now married:
41.0% (116)Unmarried:
59.0% (167)
Women who did not give birth in the past 12 months Now married:
34.3% (838)Unmarried:
65.7% (1,606)
Ancestries in Palm River-Clair Mel
1,736 9.7% American461 2.6% Italian398 2.2% Haitian286 1.6% German246 1.4% Jamaican245 1.4% Moroccan193 1.1% English151 0.8% Irish122 0.7% Norwegian69 0.4% Brazilian68 0.4% Cape Verdean52 0.3% African50 0.3% European43 0.2% Hungarian40 0.2% Swedish31 0.2% Lebanese27 0.2% Trinidadian and Tobagonian25 0.1% Ukrainian20 0.1% Scottish17 0.10% Scotch-Irish16 0.09% British14 0.08% French14 0.08% Greek9 0.05% Lithuanian5 0.03% Danish
Geographical mobility in Palm River-Clair Mel Same house 1 year ago 8,300 83.9% White (Caucasian)6,498 92.4% Black or African American123 85.7% American Indian / Alaska Native496 90.8% Asian2,148 75.6% Other race6,079 89.9% Two or more races5,971 84.2% White alone, not Hispanic / Latino8,904 84.1% Hispanic or LatinoMoved within same county 932 9.4% White / Caucasian446 6.3% Black or African American19 13.1% American Indian / Alaska Native30 5.4% Asian430 15.1% Other race373 5.5% Two or more races658 9.3% White alone, not Hispanic / Latino948 8.9% Hispanic or LatinoMoved within same state 209 2.1% White / Caucasian72 1.0% Black or African American30 0.4% Two or more races134 1.9% White alone, not Hispanic / Latino158 1.5% Hispanic or LatinoMoved from different state 217 2.2% White / Caucasian51 0.7% Black or African American43 1.5% Other race166 2.5% Two or more races233 3.3% White alone, not Hispanic / Latino164 1.6% Hispanic or LatinoMoved from abroad 66 0.7% White60 0.9% Black or African American21 3.9% Asian153 5.4% Other race100 1.5% Two or more races17 0.2% White alone, not Hispanic / Latino416 3.9% Hispanic or Latino
Children Nativity (place of birth) in Palm River-Clair Mel
Children under 6 years - Living with two parents Both parents native 505 100.0% NativeBoth parents foreign-born 163 93.7% Native11 6.3% Foreign-bornOne native, one foreign-born parent 90 100.0% NativeChildren under 6 years - Living with one parent Native parent 956 100.0% NativeForeign-born parent 173 100.0% NativeChildren 6 to 17 years - Living with two parents Both parents native 1,508 100.0% NativeBoth parents foreign-born 248 62.5% Native149 37.5% Foreign-bornOne native, one foreign-born parent 243 88.0% Native33 12.0% Foreign-bornChildren 6 to 17 years - Living with one parent Native parent 734 79.9% Native185 20.1% Foreign-bornForeign-born parent 609 69.4% Native269 30.6% Foreign-born
Grandparents responsible for own grandchildren in Palm River-Clair Mel
Grandparents (30 to 59 years) White / Caucasian 124 89.9% Responsible for grandchildren14 10.1% Not responsible for grandchildrenBlack or African American 144 71.4% Responsible for grandchildren57 28.6% Not responsible for grandchildrenAmerican Indian / Alaska Native 15 46.7% Responsible for grandchildren18 53.3% Not responsible for grandchildrenAsian 17 100.0% Not responsible for grandchildrenOther race 9 26.7% Responsible for grandchildren26 73.3% Not responsible for grandchildrenTwo or more races 30 33.6% Responsible for grandchildren60 66.4% Not responsible for grandchildrenWhite alone, not Hispanic / Latino 128 100.0% Responsible for grandchildrenHispanic or Latino 98 57.7% Responsible for grandchildren72 42.3% Not responsible for grandchildrenGrandparents (60 years and over) White / Caucasian 22 27.0% Responsible for grandchildren59 73.0% Not responsible for grandchildrenBlack or African American 16 28.5% Responsible for grandchildren41 71.5% Not responsible for grandchildrenAsian 7 100.0% Not responsible for grandchildrenOther race 33 100.0% Not responsible for grandchildrenTwo or more races 86 100.0% Not responsible for grandchildrenWhite alone, not Hispanic / Latino 12 100.0% Not responsible for grandchildrenHispanic or Latino 14 8.4% Responsible for grandchildren155 91.6% Not responsible for grandchildren