Races in Oviedo, Florida (FL) Detailed Stats
Data:
Races - White alone (%)
Races - White alone (% change since 2000)
Races - Black alone (%)
Races - Black alone (% change since 2000)
Races - American Indian alone (%)
Races - American Indian alone (% change since 2000)
Races - Asian alone (%)
Races - Asian alone (% change since 2000)
Races - Hispanic (%)
Races - Hispanic (% change since 2000)
Races - Native Hawaiian and Other Pacific Islander alone (%)
Races - Native Hawaiian and Other Pacific Islander alone (% change since 2000)
Races - Two or more races(%)
Races - Two or more races(% change since 2000)
Races - Other race alone (%)
Races - Other race alone (% change since 2000)
Racial diversity
Place of birth - Born in state of residence (%)
Place of birth - Born in state of residence (%) - White
Place of birth - Born in state of residence (%) - Black or African American
Place of birth - Born in state of residence (%) - Asian
Place of birth - Born in state of residence (%) - Hispanic or Latino
Place of birth - Born in state of residence (%) - American Indian and Alaska Native
Place of birth - Born in state of residence (%) - Multirace
Place of birth - Born in state of residence (%) - Other Race
Place of birth - Born in other state (%)
Place of birth - Born in other state (%) - White
Place of birth - Born in other state (%) - Black or African American
Place of birth - Born in other state (%) - Asian
Place of birth - Born in other state (%) - Hispanic or Latino
Place of birth - Born in other state (%) - American Indian and Alaska Native
Place of birth - Born in other state (%) - Multirace
Place of birth - Born in other state (%) - Other Race
Place of birth - Native, outside of US (%)
Place of birth - Native, outside of US (%) - White
Place of birth - Native, outside of US (%) - Black or African American
Place of birth - Native, outside of US (%) - Asian
Place of birth - Native, outside of US (%) - Hispanic or Latino
Place of birth - Native, outside of US (%) - American Indian and Alaska Native
Place of birth - Native, outside of US (%) - Multirace
Place of birth - Native, outside of US (%) - Other Race
Place of birth - Foreign born (%)
Place of birth - Foreign born (%) - White
Place of birth - Foreign born (%) - Black or African American
Place of birth - Foreign born (%) - Asian
Place of birth - Foreign born (%) - Hispanic or Latino
Place of birth - Foreign born (%) - American Indian and Alaska Native
Place of birth - Foreign born (%) - Multirace
Place of birth - Foreign born (%) - Other Race
Residents speaking English at home (%)
Residents speaking English at home - Born in the United States (%)
Residents speaking English at home - Native, born elsewhere (%)
Residents speaking English at home - Foreign born (%)
Residents speaking Spanish at home (%)
Residents speaking Spanish at home - Born in the United States (%)
Residents speaking Spanish at home - Native, born elsewhere (%)
Residents speaking Spanish at home - Foreign born (%)
Residents speaking other language at home (%)
Residents speaking other language at home - Born in the United States (%)
Residents speaking other language at home - Native, born elsewhere (%)
Residents speaking other language at home - Foreign born (%)
Marital status - Never married (%)
Marital status - Now married (%)
Marital status - Separated (%)
Marital status - Widowed (%)
Marital status - Divorced (%)
Ancestries Reported - Arab (%)
Ancestries Reported - Czech (%)
Ancestries Reported - Danish (%)
Ancestries Reported - Dutch (%)
Ancestries Reported - English (%)
Ancestries Reported - French (%)
Ancestries Reported - French Canadian (%)
Ancestries Reported - German (%)
Ancestries Reported - Greek (%)
Ancestries Reported - Hungarian (%)
Ancestries Reported - Irish (%)
Ancestries Reported - Italian (%)
Ancestries Reported - Lithuanian (%)
Ancestries Reported - Norwegian (%)
Ancestries Reported - Polish (%)
Ancestries Reported - Portuguese (%)
Ancestries Reported - Russian (%)
Ancestries Reported - Scotch-Irish (%)
Ancestries Reported - Scottish (%)
Ancestries Reported - Slovak (%)
Ancestries Reported - Subsaharan African (%)
Ancestries Reported - Swedish (%)
Ancestries Reported - Swiss (%)
Ancestries Reported - Ukrainian (%)
Ancestries Reported - United States (%)
Ancestries Reported - Welsh (%)
Ancestries Reported - West Indian (%)
Ancestries Reported - Other (%)
Geographical mobility - Same house 1 year ago (%)
Geographical mobility - Same house 1 year ago (%) - White
Geographical mobility - Same house 1 year ago (%) - Black or African American
Geographical mobility - Same house 1 year ago (%) - Asian
Geographical mobility - Same house 1 year ago (%) - Hispanic or Latino
Geographical mobility - Same house 1 year ago (%) - American Indian and Alaska Native
Geographical mobility - Same house 1 year ago (%) - Multirace
Geographical mobility - Same house 1 year ago (%) - Other Race
Geographical mobility - Moved within same county (%)
Geographical mobility - Moved within same county (%) - White
Geographical mobility - Moved within same county (%) - Black or African American
Geographical mobility - Moved within same county (%) - Asian
Geographical mobility - Moved within same county (%) - Hispanic or Latino
Geographical mobility - Moved within same county (%) - American Indian and Alaska Native
Geographical mobility - Moved within same county (%) - Multirace
Geographical mobility - Moved within same county (%) - Other Race
Geographical mobility - Moved from different county within same state (%)
Geographical mobility - Moved from different county within same state (%) - White
Geographical mobility - Moved from different county within same state (%) - Black or African American
Geographical mobility - Moved from different county within same state (%) - Asian
Geographical mobility - Moved from different county within same state (%) - Hispanic or Latino
Geographical mobility - Moved from different county within same state (%) - American Indian and Alaska Native
Geographical mobility - Moved from different county within same state (%) - Multirace
Geographical mobility - Moved from different county within same state (%) - Other Race
Geographical mobility - Moved from different state (%)
Geographical mobility - Moved from different state (%) - White
Geographical mobility - Moved from different state (%) - Black or African American
Geographical mobility - Moved from different state (%) - Asian
Geographical mobility - Moved from different state (%) - Hispanic or Latino
Geographical mobility - Moved from different state (%) - American Indian and Alaska Native
Geographical mobility - Moved from different state (%) - Multirace
Geographical mobility - Moved from different state (%) - Other Race
Geographical mobility - Moved from abroad (%)
Geographical mobility - Moved from abroad (%) - White
Geographical mobility - Moved from abroad (%) - Black or African American
Geographical mobility - Moved from abroad (%) - Asian
Geographical mobility - Moved from abroad (%) - Hispanic or Latino
Geographical mobility - Moved from abroad (%) - American Indian and Alaska Native
Geographical mobility - Moved from abroad (%) - Multirace
Geographical mobility - Moved from abroad (%) - Other Race
Place of birth for the foreign-born population - Ireland (%)
Place of birth for the foreign-born population - Denmark (%)
Place of birth for the foreign-born population - Norway (%)
Place of birth for the foreign-born population - Sweden (%)
Place of birth for the foreign-born population - United Kingdom (%)
Place of birth for the foreign-born population - England (%)
Place of birth for the foreign-born population - Scotland (%)
Place of birth for the foreign-born population - Other Northern Europe (%)
Place of birth for the foreign-born population - Austria (%)
Place of birth for the foreign-born population - Belgium (%)
Place of birth for the foreign-born population - France (%)
Place of birth for the foreign-born population - Germany (%)
Place of birth for the foreign-born population - Netherlands (%)
Place of birth for the foreign-born population - Switzerland (%)
Place of birth for the foreign-born population - Other Western Europe (%)
Place of birth for the foreign-born population - Greece (%)
Place of birth for the foreign-born population - Italy (%)
Place of birth for the foreign-born population - Portugal (%)
Place of birth for the foreign-born population - Spain (%)
Place of birth for the foreign-born population - Other Southern Europe (%)
Place of birth for the foreign-born population - Albania (%)
Place of birth for the foreign-born population - Belarus (%)
Place of birth for the foreign-born population - Bosnia and Herzegovina (%)
Place of birth for the foreign-born population - Bulgaria (%)
Place of birth for the foreign-born population - Croatia (%)
Place of birth for the foreign-born population - Czechoslovakia (%)
Place of birth for the foreign-born population - Hungary (%)
Place of birth for the foreign-born population - Latvia (%)
Place of birth for the foreign-born population - Lithuania (%)
Place of birth for the foreign-born population - North Macedonia (Macedonia) (%)
Place of birth for the foreign-born population - Moldova (%)
Place of birth for the foreign-born population - Poland (%)
Place of birth for the foreign-born population - Romania (%)
Place of birth for the foreign-born population - Russia (%)
Place of birth for the foreign-born population - Serbia (%)
Place of birth for the foreign-born population - Ukraine (%)
Place of birth for the foreign-born population - Other Eastern Europe (%)
Place of birth for the foreign-born population - China (%)
Place of birth for the foreign-born population - Hong Kong (%)
Place of birth for the foreign-born population - Taiwan (%)
Place of birth for the foreign-born population - Japan (%)
Place of birth for the foreign-born population - Korea (%)
Place of birth for the foreign-born population - Other Eastern Asia (%)
Place of birth for the foreign-born population - Afghanistan (%)
Place of birth for the foreign-born population - Bangladesh (%)
Place of birth for the foreign-born population - India (%)
Place of birth for the foreign-born population - Iran (%)
Place of birth for the foreign-born population - Kazakhstan (%)
Place of birth for the foreign-born population - Nepal (%)
Place of birth for the foreign-born population - Pakistan (%)
Place of birth for the foreign-born population - Sri Lanka (%)
Place of birth for the foreign-born population - Uzbekistan (%)
Place of birth for the foreign-born population - Other South Central Asia (%)
Place of birth for the foreign-born population - Burma (%)
Place of birth for the foreign-born population - Cambodia (%)
Place of birth for the foreign-born population - Indonesia (%)
Place of birth for the foreign-born population - Laos (%)
Place of birth for the foreign-born population - Malaysia (%)
Place of birth for the foreign-born population - Philippines (%)
Place of birth for the foreign-born population - Singapore (%)
Place of birth for the foreign-born population - Thailand (%)
Place of birth for the foreign-born population - Vietnam (%)
Place of birth for the foreign-born population - Other South Eastern Asia (%)
Place of birth for the foreign-born population - Armenia (%)
Place of birth for the foreign-born population - Iraq (%)
Place of birth for the foreign-born population - Israel (%)
Place of birth for the foreign-born population - Jordan (%)
Place of birth for the foreign-born population - Kuwait (%)
Place of birth for the foreign-born population - Lebanon (%)
Place of birth for the foreign-born population - Saudi Arabia (%)
Place of birth for the foreign-born population - Syria (%)
Place of birth for the foreign-born population - Turkey (%)
Place of birth for the foreign-born population - Yemen (%)
Place of birth for the foreign-born population - Other Western Asia (%)
Place of birth for the foreign-born population - Eritrea (%)
Place of birth for the foreign-born population - Ethiopia (%)
Place of birth for the foreign-born population - Kenya (%)
Place of birth for the foreign-born population - Somalia (%)
Place of birth for the foreign-born population - Uganda (%)
Place of birth for the foreign-born population - Zimbabwe (%)
Place of birth for the foreign-born population - Other Eastern Africa (%)
Place of birth for the foreign-born population - Cameroon (%)
Place of birth for the foreign-born population - Congo (%)
Place of birth for the foreign-born population - Democratic Republic of Congo (Zaire) (%)
Place of birth for the foreign-born population - Other Middle Africa (%)
Place of birth for the foreign-born population - Egypt (%)
Place of birth for the foreign-born population - Morocco (%)
Place of birth for the foreign-born population - Sudan (%)
Place of birth for the foreign-born population - Other Northern Africa (%)
Place of birth for the foreign-born population - South Africa (%)
Place of birth for the foreign-born population - Other Southern Africa (%)
Place of birth for the foreign-born population - Cabo Verde (%)
Place of birth for the foreign-born population - Ghana (%)
Place of birth for the foreign-born population - Liberia (%)
Place of birth for the foreign-born population - Nigeria (%)
Place of birth for the foreign-born population - Senegal (%)
Place of birth for the foreign-born population - Sierra Leone (%)
Place of birth for the foreign-born population - Other Western Africa (%)
Place of birth for the foreign-born population - Australia (%)
Place of birth for the foreign-born population - New Zealand (%)
Place of birth for the foreign-born population - Fiji (%)
Place of birth for the foreign-born population - Micronesia (%)
Place of birth for the foreign-born population - Bahamas (%)
Place of birth for the foreign-born population - Barbados (%)
Place of birth for the foreign-born population - Cuba (%)
Place of birth for the foreign-born population - Dominica (%)
Place of birth for the foreign-born population - Dominican Republic (%)
Place of birth for the foreign-born population - Grenada (%)
Place of birth for the foreign-born population - Haiti (%)
Place of birth for the foreign-born population - Jamaica (%)
Place of birth for the foreign-born population - St. Vincent and the Grenadines (%)
Place of birth for the foreign-born population - Trinidad and Tobago (%)
Place of birth for the foreign-born population - West Indies (%)
Place of birth for the foreign-born population - Other Caribbean (%)
Place of birth for the foreign-born population - Belize (%)
Place of birth for the foreign-born population - Costa Rica (%)
Place of birth for the foreign-born population - El Salvador (%)
Place of birth for the foreign-born population - Guatemala (%)
Place of birth for the foreign-born population - Honduras (%)
Place of birth for the foreign-born population - Mexico (%)
Place of birth for the foreign-born population - Nicaragua (%)
Place of birth for the foreign-born population - Panama (%)
Place of birth for the foreign-born population - Other Central America (%)
Place of birth for the foreign-born population - Argentina (%)
Place of birth for the foreign-born population - Bolivia (%)
Place of birth for the foreign-born population - Brazil (%)
Place of birth for the foreign-born population - Chile (%)
Place of birth for the foreign-born population - Colombia (%)
Place of birth for the foreign-born population - Ecuador (%)
Place of birth for the foreign-born population - Guyana (%)
Place of birth for the foreign-born population - Peru (%)
Place of birth for the foreign-born population - Uruguay (%)
Place of birth for the foreign-born population - Venezuela (%)
Place of birth for the foreign-born population - Other South America (%)
Place of birth for the foreign-born population - Canada (%)
Place of birth for the foreign-born population - Other Northern America (%)
Place of birth for the foreign-born population - Other (%)
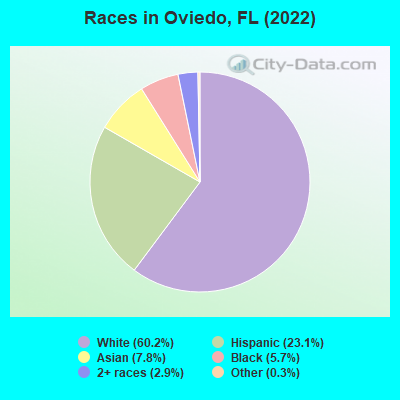
According to 2022 data, the most numerous races in Oviedo, FL are White alone (24,168 residents), Hispanic (9,297 residents), and Black alone (2,276 residents). 77.1% of Oviedo residents speak English at home. 15.0% of Oviedo, FL residents are foreign-born (5.5% born in Latin America, 5.0% born in Asia, 2.2% born in Europe), which is 40.3% less than the foreign-born rate of 21.0% across the entire state of Florida.
Race distribution in Oviedo
2000 2022
10,458,509 65.4% White alone 2,682,715 16.8% Hispanic 2,264,268 14.2% Black alone 261,693 1.6% Asian alone 236,954 1.5% Two or more races 42,358 0.3% American Indian alone 28,994 0.2% Other race alone 6,887 0.04% Native Hawaiian and Other
11,309,403 50.8% White alone 6,025,039 27.1% Hispanic 3,241,015 14.6% Black alone 861,630 3.9% Two or more races 623,692 2.8% Asian alone 152,054 0.7% Other race alone 22,504 0.1% American Indian alone 9,486 0.04% Native Hawaiian and Other
Income and house value in Oviedo Median household income in 2022 $123,153 White non-Hispanic householders$67,928 Black householders$119,984 Asian householders$111,033 Some other race householders$112,671 Two or more races householders$111,242 Hispanic or Latino race householdersMedian 2022 house value $476,999 White Non-Hispanic householders$382,163 Black or African American householders$484,755 American Indian or Alaska Native householders $466,070 Asian householders$395,913 Some other race householders$411,777 Two or more races householders$422,706 Hispanic or Latino householders
Median age by race in Oviedo
39.3 Median age for White residents39.2 39.6 32.4 Median age for Black or African American residents25.3 39.9 29.8 Median age for American Indian / Alaska Native residents14.4 -503,171,246.9 37.7 Median age for Asian residents35.9 40.9 -679,849,340.2 Median age for Native Hawaiian / Pacific Islander residents-858,307,848.3 -443,298,968.6 30.3 Median age for Other race residents30.1 30.6 31.1 Median age for Two or more races residents32.6 31.2 39.2 Median age for White alone residents39.6 39.3 30.3 Median age for Hispanic or Latino residents30.3 30.4
Owner/renter occupied households by race in Oviedo
House owners and renters - White residents 7,160 78.9% Owner occupied1,917 21.1% Renter occupiedHouse owners and renters - Black or African American residents 567 70.8% Owner occupied234 29.2% Renter occupiedHouse owners and renters - American Indian / Alaska Native residents 34 88.3% Owner occupied5 11.7% Renter occupiedHouse owners and renters - Asian residents 781 80.7% Owner occupied187 19.3% Renter occupiedHouse owners and renters - Other race residents 212 59.9% Owner occupied142 40.1% Renter occupiedHouse owners and renters - Two or more races residents 1,862 87.1% Owner occupied275 12.9% Renter occupiedHouse owners and renters - White alone residents 6,848 79.6% Owner occupied1,758 20.4% Renter occupiedHouse owners and renters - Hispanic or Latino residents 1,883 75.2% Owner occupied621 24.8% Renter occupied
Language usage in Oviedo
English speakers - Total 77.1% of residents of Oviedo speak English at home.
13.1% of residents speak Spanish at home 3,632 72.9% Speak English very well1,347 27.1% Speak English less than very well9.9% of residents speak other language at home 2,603 69.1% Speak English very well1,164 30.9% Speak English less than very well
English speakers - Born in the United States 87.9% of residents of Oviedo speak English at home.
9.6% of residents speak Spanish at home 1,426 83.1% Speak English very well291 16.9% Speak English less than very well2.4% of residents speak other language at home 345 81.6% Speak English very well78 18.4% Speak English less than very well
English speakers - Native, born elsewhere 51.0% of residents of Oviedo speak English at home.
47.1% of residents speak Spanish at home 605 70.6% Speak English very well252 29.4% Speak English less than very well6.7% of residents speak other language at home 121 100.0% Speak English very well
English speakers - Foreign-born 21.5% of residents of Oviedo speak English at home.
30.4% of residents speak Spanish at home 1,173 62.3% Speak English very well711 37.7% Speak English less than very well48.8% of residents speak other language at home 1,997 66.1% Speak English very well1,025 33.9% Speak English less than very well
White (Caucasian) - Speak only English Native:
96.7% (21,749)Foreign-born:
25.1% (411)
White (Caucasian) - Speak another language Native:
4.0% (907)Foreign-born:
74.8% (1,227)
Black or African American - Speak only English Native:
96.1% (1,738)Foreign-born:
68.2% (280)
Black or African American - Speak another language Native:
2.3% (41)Foreign-born:
18.6% (76)
American Indian / Alaska Native - Speak another language Native:
100.0% (118)Foreign-born:
100.0% (17)
Asian - Speak only English Native:
67.0% (585)Foreign-born:
17.9% (396)
Asian - Speak another language Native:
32.4% (283)Foreign-born:
81.8% (1,811)
Other race - Speak only English Native:
51.3% (718)Foreign-born:
6.4% (11)
Other race - Speak another language Native:
52.3% (732)Foreign-born:
100.0% (172)
Two or more races - Speak only English Native:
63.5% (3,388)Foreign-born:
6.7% (123)
Two or more races - Speak another language Native:
36.5% (1,950)Foreign-born:
91.4% (1,688)
White alone - Speak only English Native:
97.2% (20,736)Foreign-born:
26.5% (429)
White alone - Speak another language Native:
2.8% (601)Foreign-born:
76.4% (1,238)
Hispanic or Latino - Speak only English Native:
60.2% (3,977)Foreign-born:
4.8% (95)
Hispanic or Latino - Speak another language Native:
42.1% (2,781)Foreign-born:
94.4% (1,868)
Foreign-born residents in Oviedo 6,012 residents are foreign born (5.5% Latin America , 5.0% Asia , 2.2% Europe ).
This city:
15.0%Florida:
21.1%
Marital status for residents in Oviedo Marital status - White (Caucasian) population 15 years and over
Males 30.1% Never married62.2% Now married0.5% Separated1.3% Widowed6.0% DivorcedFemales 24.3% Never married58.1% Now married1.2% Separated5.1% Widowed11.2% DivorcedWomen who gave birth in the past 12 months Now married:
94.5% (326)Unmarried:
5.5% (19)
Women who did not give birth in the past 12 months Now married:
52.9% (2,986)Unmarried:
47.1% (2,654)
Marital status - Black or African American population 15 years and over
Males 52.7% Never married42.7% Now married0.0% Separated3.7% Widowed0.9% DivorcedFemales 31.4% Never married33.4% Now married10.1% Separated1.7% Widowed23.5% DivorcedWomen who did not give birth in the past 12 months Now married:
38.9% (208)Unmarried:
61.1% (327)
Marital status - American Indian / Alaska Native population 15 years and over
Males 39.6% Never married60.4% Now married0.0% Separated0.0% Widowed0.0% DivorcedFemales 0.0% Never married100.0% Now married0.0% Separated0.0% Widowed0.0% DivorcedWomen who did not give birth in the past 12 months Now married:
100.0% (34)Unmarried:
0.0% (0)
Marital status - Asian population 15 years and over
Males 37.2% Never married62.1% Now married0.0% Separated0.0% Widowed0.8% DivorcedFemales 19.6% Never married68.7% Now married0.0% Separated9.9% Widowed1.8% DivorcedWomen who gave birth in the past 12 months Now married:
100.0% (114)Unmarried:
0.0% (0)
Women who did not give birth in the past 12 months Now married:
61.4% (462)Unmarried:
38.6% (291)
Marital status - Other race population 15 years and over
Males 39.3% Never married57.0% Now married0.0% Separated0.0% Widowed3.7% DivorcedFemales 35.5% Never married45.7% Now married0.0% Separated0.0% Widowed18.8% DivorcedWomen who gave birth in the past 12 months Now married:
100.0% (8)Unmarried:
0.0% (0)
Women who did not give birth in the past 12 months Now married:
37.6% (150)Unmarried:
62.4% (249)
Marital status - Two or more races population 15 years and over
Males 42.7% Never married50.4% Now married2.1% Separated0.0% Widowed4.9% DivorcedFemales 37.6% Never married46.5% Now married0.0% Separated3.6% Widowed12.2% DivorcedWomen who gave birth in the past 12 months Now married:
100.0% (151)Unmarried:
0.0% (0)
Women who did not give birth in the past 12 months Now married:
36.1% (835)Unmarried:
63.9% (1,476)
Marital status - White alone, not Hispanic / Latino population 15 years and over
Males 28.6% Never married63.5% Now married0.6% Separated1.4% Widowed6.0% DivorcedFemales 23.3% Never married59.1% Now married1.4% Separated5.2% Widowed11.0% DivorcedWomen who gave birth in the past 12 months Now married:
93.8% (311)Unmarried:
6.2% (20)
Women who did not give birth in the past 12 months Now married:
53.7% (2,898)Unmarried:
46.3% (2,496)
Marital status - Hispanic or Latino population 15 years and over
Males 41.1% Never married53.0% Now married1.2% Separated0.0% Widowed4.7% DivorcedFemales 32.8% Never married49.3% Now married0.0% Separated3.2% Widowed14.7% DivorcedWomen who gave birth in the past 12 months Now married:
100.0% (208)Unmarried:
0.0% (0)
Women who did not give birth in the past 12 months Now married:
40.5% (996)Unmarried:
59.5% (1,465)
Ancestries in Oviedo
2,242 11.6% American1,480 7.6% German1,102 5.7% Italian1,038 5.3% English916 4.7% Irish508 2.6% European471 2.4% Polish324 1.7% Egyptian309 1.6% Jamaican182 0.9% Scottish163 0.8% Greek154 0.8% British146 0.8% Norwegian119 0.6% Romanian108 0.6% Lebanese100 0.5% Iranian98 0.5% Trinidadian and Tobagonian92 0.5% French91 0.5% Arab91 0.5% Brazilian78 0.4% Scotch-Irish74 0.4% Canadian66 0.3% Lithuanian58 0.3% West Indian56 0.3% Yugoslavian54 0.3% Swiss51 0.3% Swedish46 0.2% Dutch42 0.2% French Canadian41 0.2% Russian33 0.2% Eastern European33 0.2% Turkish28 0.1% Belgian26 0.1% Finnish26 0.1% African25 0.1% Guyanese23 0.1% Ukrainian23 0.1% British West Indian22 0.1% Czech21 0.1% Slavic20 0.1% Slovak20 0.1% Welsh18 0.09% Portuguese18 0.09% Celtic17 0.09% Czechoslovakian17 0.09% Croatian16 0.08% Haitian14 0.07% Belizean13 0.07% Austrian11 0.06% Jordanian6 0.03% Ethiopian
Geographical mobility in Oviedo Same house 1 year ago 21,706 86.4% White (Caucasian)2,024 89.3% Black or African American155 100.0% American Indian / Alaska Native3,036 89.7% Asian1,151 77.1% Other race6,544 86.5% Two or more races20,915 87.6% White alone, not Hispanic / Latino7,250 79.9% Hispanic or LatinoMoved within same county 1,215 4.8% White / Caucasian31 1.3% Black or African American319 9.4% Asian38 2.5% Other race440 5.8% Two or more races968 4.1% White alone, not Hispanic / Latino857 9.4% Hispanic or LatinoMoved within same state 735 2.9% White / Caucasian154 6.8% Black or African American13 0.4% Asian18 1.2% Other race683 9.0% Two or more races770 3.2% White alone, not Hispanic / Latino318 3.5% Hispanic or LatinoMoved from different state 1,263 5.0% White / Caucasian100 4.4% Black or African American95 2.8% Asian459 30.7% Other race14 0.2% Two or more races1,095 4.6% White alone, not Hispanic / Latino453 5.0% Hispanic or LatinoMoved from abroad 352 1.4% White22 0.6% Asian88 5.9% Other race8 0.1% Two or more races262 1.1% White alone, not Hispanic / Latino140 1.5% Hispanic or Latino
Children Nativity (place of birth) in Oviedo
Children under 6 years - Living with two parents Both parents native 1,214 100.0% NativeBoth parents foreign-born 191 87.4% Native28 12.6% Foreign-bornOne native, one foreign-born parent 646 100.0% NativeChildren under 6 years - Living with one parent Native parent 306 100.0% NativeForeign-born parent 3 100.0% NativeChildren 6 to 17 years - Living with two parents Both parents native 3,933 99.9% Native3 0.1% Foreign-bornBoth parents foreign-born 727 71.2% Native294 28.8% Foreign-bornOne native, one foreign-born parent 646 98.2% Native12 1.8% Foreign-bornChildren 6 to 17 years - Living with one parent Native parent 1,360 100.0% NativeForeign-born parent 254 52.9% Native226 47.1% Foreign-born
Grandparents responsible for own grandchildren in Oviedo
Grandparents (30 to 59 years) White / Caucasian 33 65.3% Responsible for grandchildren18 34.7% Not responsible for grandchildrenBlack or African American 26 100.0% Responsible for grandchildrenAsian 4 100.0% Not responsible for grandchildrenTwo or more races 55 23.3% Responsible for grandchildren181 76.7% Not responsible for grandchildrenWhite alone, not Hispanic / Latino 21 48.7% Responsible for grandchildren22 51.3% Not responsible for grandchildrenHispanic or Latino 20 16.0% Responsible for grandchildren104 84.0% Not responsible for grandchildrenGrandparents (60 years and over) White / Caucasian 22 8.3% Responsible for grandchildren246 91.7% Not responsible for grandchildrenBlack or African American 5 100.0% Not responsible for grandchildrenAsian 100 100.0% Not responsible for grandchildrenWhite alone, not Hispanic / Latino 24 9.1% Responsible for grandchildren238 90.9% Not responsible for grandchildrenHispanic or Latino 49 100.0% Not responsible for grandchildren