Races in Oakleaf Plantation, Florida (FL) Detailed Stats
Data:
Races - White alone (%)
Races - White alone (% change since 2000)
Races - Black alone (%)
Races - Black alone (% change since 2000)
Races - American Indian alone (%)
Races - American Indian alone (% change since 2000)
Races - Asian alone (%)
Races - Asian alone (% change since 2000)
Races - Hispanic (%)
Races - Hispanic (% change since 2000)
Races - Native Hawaiian and Other Pacific Islander alone (%)
Races - Native Hawaiian and Other Pacific Islander alone (% change since 2000)
Races - Two or more races(%)
Races - Two or more races(% change since 2000)
Races - Other race alone (%)
Races - Other race alone (% change since 2000)
Racial diversity
Place of birth - Born in state of residence (%)
Place of birth - Born in state of residence (%) - White
Place of birth - Born in state of residence (%) - Black or African American
Place of birth - Born in state of residence (%) - Asian
Place of birth - Born in state of residence (%) - Hispanic or Latino
Place of birth - Born in state of residence (%) - American Indian and Alaska Native
Place of birth - Born in state of residence (%) - Multirace
Place of birth - Born in state of residence (%) - Other Race
Place of birth - Born in other state (%)
Place of birth - Born in other state (%) - White
Place of birth - Born in other state (%) - Black or African American
Place of birth - Born in other state (%) - Asian
Place of birth - Born in other state (%) - Hispanic or Latino
Place of birth - Born in other state (%) - American Indian and Alaska Native
Place of birth - Born in other state (%) - Multirace
Place of birth - Born in other state (%) - Other Race
Place of birth - Native, outside of US (%)
Place of birth - Native, outside of US (%) - White
Place of birth - Native, outside of US (%) - Black or African American
Place of birth - Native, outside of US (%) - Asian
Place of birth - Native, outside of US (%) - Hispanic or Latino
Place of birth - Native, outside of US (%) - American Indian and Alaska Native
Place of birth - Native, outside of US (%) - Multirace
Place of birth - Native, outside of US (%) - Other Race
Place of birth - Foreign born (%)
Place of birth - Foreign born (%) - White
Place of birth - Foreign born (%) - Black or African American
Place of birth - Foreign born (%) - Asian
Place of birth - Foreign born (%) - Hispanic or Latino
Place of birth - Foreign born (%) - American Indian and Alaska Native
Place of birth - Foreign born (%) - Multirace
Place of birth - Foreign born (%) - Other Race
Residents speaking English at home (%)
Residents speaking English at home - Born in the United States (%)
Residents speaking English at home - Native, born elsewhere (%)
Residents speaking English at home - Foreign born (%)
Residents speaking Spanish at home (%)
Residents speaking Spanish at home - Born in the United States (%)
Residents speaking Spanish at home - Native, born elsewhere (%)
Residents speaking Spanish at home - Foreign born (%)
Residents speaking other language at home (%)
Residents speaking other language at home - Born in the United States (%)
Residents speaking other language at home - Native, born elsewhere (%)
Residents speaking other language at home - Foreign born (%)
Marital status - Never married (%)
Marital status - Now married (%)
Marital status - Separated (%)
Marital status - Widowed (%)
Marital status - Divorced (%)
Ancestries Reported - Arab (%)
Ancestries Reported - Czech (%)
Ancestries Reported - Danish (%)
Ancestries Reported - Dutch (%)
Ancestries Reported - English (%)
Ancestries Reported - French (%)
Ancestries Reported - French Canadian (%)
Ancestries Reported - German (%)
Ancestries Reported - Greek (%)
Ancestries Reported - Hungarian (%)
Ancestries Reported - Irish (%)
Ancestries Reported - Italian (%)
Ancestries Reported - Lithuanian (%)
Ancestries Reported - Norwegian (%)
Ancestries Reported - Polish (%)
Ancestries Reported - Portuguese (%)
Ancestries Reported - Russian (%)
Ancestries Reported - Scotch-Irish (%)
Ancestries Reported - Scottish (%)
Ancestries Reported - Slovak (%)
Ancestries Reported - Subsaharan African (%)
Ancestries Reported - Swedish (%)
Ancestries Reported - Swiss (%)
Ancestries Reported - Ukrainian (%)
Ancestries Reported - United States (%)
Ancestries Reported - Welsh (%)
Ancestries Reported - West Indian (%)
Ancestries Reported - Other (%)
Geographical mobility - Same house 1 year ago (%)
Geographical mobility - Same house 1 year ago (%) - White
Geographical mobility - Same house 1 year ago (%) - Black or African American
Geographical mobility - Same house 1 year ago (%) - Asian
Geographical mobility - Same house 1 year ago (%) - Hispanic or Latino
Geographical mobility - Same house 1 year ago (%) - American Indian and Alaska Native
Geographical mobility - Same house 1 year ago (%) - Multirace
Geographical mobility - Same house 1 year ago (%) - Other Race
Geographical mobility - Moved within same county (%)
Geographical mobility - Moved within same county (%) - White
Geographical mobility - Moved within same county (%) - Black or African American
Geographical mobility - Moved within same county (%) - Asian
Geographical mobility - Moved within same county (%) - Hispanic or Latino
Geographical mobility - Moved within same county (%) - American Indian and Alaska Native
Geographical mobility - Moved within same county (%) - Multirace
Geographical mobility - Moved within same county (%) - Other Race
Geographical mobility - Moved from different county within same state (%)
Geographical mobility - Moved from different county within same state (%) - White
Geographical mobility - Moved from different county within same state (%) - Black or African American
Geographical mobility - Moved from different county within same state (%) - Asian
Geographical mobility - Moved from different county within same state (%) - Hispanic or Latino
Geographical mobility - Moved from different county within same state (%) - American Indian and Alaska Native
Geographical mobility - Moved from different county within same state (%) - Multirace
Geographical mobility - Moved from different county within same state (%) - Other Race
Geographical mobility - Moved from different state (%)
Geographical mobility - Moved from different state (%) - White
Geographical mobility - Moved from different state (%) - Black or African American
Geographical mobility - Moved from different state (%) - Asian
Geographical mobility - Moved from different state (%) - Hispanic or Latino
Geographical mobility - Moved from different state (%) - American Indian and Alaska Native
Geographical mobility - Moved from different state (%) - Multirace
Geographical mobility - Moved from different state (%) - Other Race
Geographical mobility - Moved from abroad (%)
Geographical mobility - Moved from abroad (%) - White
Geographical mobility - Moved from abroad (%) - Black or African American
Geographical mobility - Moved from abroad (%) - Asian
Geographical mobility - Moved from abroad (%) - Hispanic or Latino
Geographical mobility - Moved from abroad (%) - American Indian and Alaska Native
Geographical mobility - Moved from abroad (%) - Multirace
Geographical mobility - Moved from abroad (%) - Other Race
Place of birth for the foreign-born population - Ireland (%)
Place of birth for the foreign-born population - Denmark (%)
Place of birth for the foreign-born population - Norway (%)
Place of birth for the foreign-born population - Sweden (%)
Place of birth for the foreign-born population - United Kingdom (%)
Place of birth for the foreign-born population - England (%)
Place of birth for the foreign-born population - Scotland (%)
Place of birth for the foreign-born population - Other Northern Europe (%)
Place of birth for the foreign-born population - Austria (%)
Place of birth for the foreign-born population - Belgium (%)
Place of birth for the foreign-born population - France (%)
Place of birth for the foreign-born population - Germany (%)
Place of birth for the foreign-born population - Netherlands (%)
Place of birth for the foreign-born population - Switzerland (%)
Place of birth for the foreign-born population - Other Western Europe (%)
Place of birth for the foreign-born population - Greece (%)
Place of birth for the foreign-born population - Italy (%)
Place of birth for the foreign-born population - Portugal (%)
Place of birth for the foreign-born population - Spain (%)
Place of birth for the foreign-born population - Other Southern Europe (%)
Place of birth for the foreign-born population - Albania (%)
Place of birth for the foreign-born population - Belarus (%)
Place of birth for the foreign-born population - Bosnia and Herzegovina (%)
Place of birth for the foreign-born population - Bulgaria (%)
Place of birth for the foreign-born population - Croatia (%)
Place of birth for the foreign-born population - Czechoslovakia (%)
Place of birth for the foreign-born population - Hungary (%)
Place of birth for the foreign-born population - Latvia (%)
Place of birth for the foreign-born population - Lithuania (%)
Place of birth for the foreign-born population - North Macedonia (Macedonia) (%)
Place of birth for the foreign-born population - Moldova (%)
Place of birth for the foreign-born population - Poland (%)
Place of birth for the foreign-born population - Romania (%)
Place of birth for the foreign-born population - Russia (%)
Place of birth for the foreign-born population - Serbia (%)
Place of birth for the foreign-born population - Ukraine (%)
Place of birth for the foreign-born population - Other Eastern Europe (%)
Place of birth for the foreign-born population - China (%)
Place of birth for the foreign-born population - Hong Kong (%)
Place of birth for the foreign-born population - Taiwan (%)
Place of birth for the foreign-born population - Japan (%)
Place of birth for the foreign-born population - Korea (%)
Place of birth for the foreign-born population - Other Eastern Asia (%)
Place of birth for the foreign-born population - Afghanistan (%)
Place of birth for the foreign-born population - Bangladesh (%)
Place of birth for the foreign-born population - India (%)
Place of birth for the foreign-born population - Iran (%)
Place of birth for the foreign-born population - Kazakhstan (%)
Place of birth for the foreign-born population - Nepal (%)
Place of birth for the foreign-born population - Pakistan (%)
Place of birth for the foreign-born population - Sri Lanka (%)
Place of birth for the foreign-born population - Uzbekistan (%)
Place of birth for the foreign-born population - Other South Central Asia (%)
Place of birth for the foreign-born population - Burma (%)
Place of birth for the foreign-born population - Cambodia (%)
Place of birth for the foreign-born population - Indonesia (%)
Place of birth for the foreign-born population - Laos (%)
Place of birth for the foreign-born population - Malaysia (%)
Place of birth for the foreign-born population - Philippines (%)
Place of birth for the foreign-born population - Singapore (%)
Place of birth for the foreign-born population - Thailand (%)
Place of birth for the foreign-born population - Vietnam (%)
Place of birth for the foreign-born population - Other South Eastern Asia (%)
Place of birth for the foreign-born population - Armenia (%)
Place of birth for the foreign-born population - Iraq (%)
Place of birth for the foreign-born population - Israel (%)
Place of birth for the foreign-born population - Jordan (%)
Place of birth for the foreign-born population - Kuwait (%)
Place of birth for the foreign-born population - Lebanon (%)
Place of birth for the foreign-born population - Saudi Arabia (%)
Place of birth for the foreign-born population - Syria (%)
Place of birth for the foreign-born population - Turkey (%)
Place of birth for the foreign-born population - Yemen (%)
Place of birth for the foreign-born population - Other Western Asia (%)
Place of birth for the foreign-born population - Eritrea (%)
Place of birth for the foreign-born population - Ethiopia (%)
Place of birth for the foreign-born population - Kenya (%)
Place of birth for the foreign-born population - Somalia (%)
Place of birth for the foreign-born population - Uganda (%)
Place of birth for the foreign-born population - Zimbabwe (%)
Place of birth for the foreign-born population - Other Eastern Africa (%)
Place of birth for the foreign-born population - Cameroon (%)
Place of birth for the foreign-born population - Congo (%)
Place of birth for the foreign-born population - Democratic Republic of Congo (Zaire) (%)
Place of birth for the foreign-born population - Other Middle Africa (%)
Place of birth for the foreign-born population - Egypt (%)
Place of birth for the foreign-born population - Morocco (%)
Place of birth for the foreign-born population - Sudan (%)
Place of birth for the foreign-born population - Other Northern Africa (%)
Place of birth for the foreign-born population - South Africa (%)
Place of birth for the foreign-born population - Other Southern Africa (%)
Place of birth for the foreign-born population - Cabo Verde (%)
Place of birth for the foreign-born population - Ghana (%)
Place of birth for the foreign-born population - Liberia (%)
Place of birth for the foreign-born population - Nigeria (%)
Place of birth for the foreign-born population - Senegal (%)
Place of birth for the foreign-born population - Sierra Leone (%)
Place of birth for the foreign-born population - Other Western Africa (%)
Place of birth for the foreign-born population - Australia (%)
Place of birth for the foreign-born population - New Zealand (%)
Place of birth for the foreign-born population - Fiji (%)
Place of birth for the foreign-born population - Micronesia (%)
Place of birth for the foreign-born population - Bahamas (%)
Place of birth for the foreign-born population - Barbados (%)
Place of birth for the foreign-born population - Cuba (%)
Place of birth for the foreign-born population - Dominica (%)
Place of birth for the foreign-born population - Dominican Republic (%)
Place of birth for the foreign-born population - Grenada (%)
Place of birth for the foreign-born population - Haiti (%)
Place of birth for the foreign-born population - Jamaica (%)
Place of birth for the foreign-born population - St. Vincent and the Grenadines (%)
Place of birth for the foreign-born population - Trinidad and Tobago (%)
Place of birth for the foreign-born population - West Indies (%)
Place of birth for the foreign-born population - Other Caribbean (%)
Place of birth for the foreign-born population - Belize (%)
Place of birth for the foreign-born population - Costa Rica (%)
Place of birth for the foreign-born population - El Salvador (%)
Place of birth for the foreign-born population - Guatemala (%)
Place of birth for the foreign-born population - Honduras (%)
Place of birth for the foreign-born population - Mexico (%)
Place of birth for the foreign-born population - Nicaragua (%)
Place of birth for the foreign-born population - Panama (%)
Place of birth for the foreign-born population - Other Central America (%)
Place of birth for the foreign-born population - Argentina (%)
Place of birth for the foreign-born population - Bolivia (%)
Place of birth for the foreign-born population - Brazil (%)
Place of birth for the foreign-born population - Chile (%)
Place of birth for the foreign-born population - Colombia (%)
Place of birth for the foreign-born population - Ecuador (%)
Place of birth for the foreign-born population - Guyana (%)
Place of birth for the foreign-born population - Peru (%)
Place of birth for the foreign-born population - Uruguay (%)
Place of birth for the foreign-born population - Venezuela (%)
Place of birth for the foreign-born population - Other South America (%)
Place of birth for the foreign-born population - Canada (%)
Place of birth for the foreign-born population - Other Northern America (%)
Place of birth for the foreign-born population - Other (%)
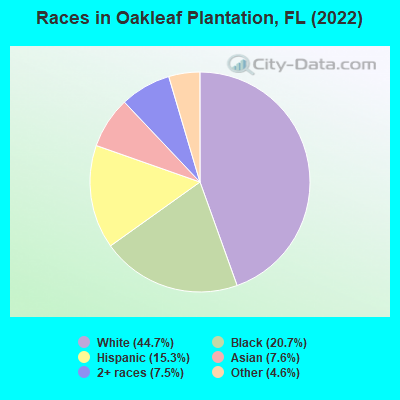
According to 2022 data, the most numerous races in Oakleaf Plantation, FL are White alone (13,485 residents), Hispanic (4,622 residents), and Black alone (6,240 residents). 83.9% of Oakleaf Plantation residents speak English at home.
Race distribution in Oakleaf Plantation 13,485 44.7% White alone 6,240 20.7% Black alone 4,622 15.3% Hispanic 2,288 7.6% Asian alone 2,276 7.5% Two or more races 1,382 4.6% Other race alone
2000 2022
10,458,509 65.4% White alone 2,682,715 16.8% Hispanic 2,264,268 14.2% Black alone 261,693 1.6% Asian alone 236,954 1.5% Two or more races 42,358 0.3% American Indian alone 28,994 0.2% Other race alone 6,887 0.04% Native Hawaiian and Other
11,309,403 50.8% White alone 6,025,039 27.1% Hispanic 3,241,015 14.6% Black alone 861,630 3.9% Two or more races 623,692 2.8% Asian alone 152,054 0.7% Other race alone 22,504 0.1% American Indian alone 9,486 0.04% Native Hawaiian and Other
Income and house value in Oakleaf Plantation Median household income in 2022 $111,586 White non-Hispanic householders$113,069 Black householders$87,372 Asian householders$112,657 Two or more races householders$140,415 Hispanic or Latino race householders
Median age by race in Oakleaf Plantation
35.6 Median age for White residents37.0 35.5 34.0 Median age for Black or African American residents37.1 30.7 -665,028,664.4 Median age for American Indian / Alaska Native residents-673,283,704.9 -594,925,633.7 44.2 Median age for Asian residents36.8 49.8 -679,849,340.2 Median age for Native Hawaiian / Pacific Islander residents-666,666,666.0 -666,666,666.0 38.4 Median age for Other race residents31.5 41.6 20.9 Median age for Two or more races residents21.7 20.0 37.1 Median age for White alone residents36.8 36.8 30.7 Median age for Hispanic or Latino residents29.4 28.1
Owner/renter occupied households by race in Oakleaf Plantation
House owners and renters - White residents 4,508 93.4% Owner occupied319 6.6% Renter occupiedHouse owners and renters - Black or African American residents 1,328 64.6% Owner occupied726 35.4% Renter occupiedHouse owners and renters - Asian residents 930 90.3% Owner occupied100 9.7% Renter occupiedHouse owners and renters - Other race residents 558 83.9% Owner occupied107 16.1% Renter occupiedHouse owners and renters - Two or more races residents 594 48.1% Owner occupied640 51.9% Renter occupiedHouse owners and renters - White alone residents 4,315 93.4% Owner occupied305 6.6% Renter occupiedHouse owners and renters - Hispanic or Latino residents 905 71.5% Owner occupied360 28.5% Renter occupied
Language usage in Oakleaf Plantation
English speakers - Total 83.9% of residents of Oakleaf Plantation speak English at home.
7.2% of residents speak Spanish at home 1,519 74.5% Speak English very well519 25.5% Speak English less than very well8.4% of residents speak other language at home 1,444 60.8% Speak English very well931 39.2% Speak English less than very well
English speakers - Born in the United States 96.7% of residents of Oakleaf Plantation speak English at home.
3.2% of residents speak Spanish at home 431 99.5% Speak English very well2 0.5% Speak English less than very well0.3% of residents speak other language at home 39 100.0% Speak English very well
English speakers - Native, born elsewhere 21.0% of residents of Oakleaf Plantation speak English at home.
53.7% of residents speak Spanish at home 464 54.9% Speak English very well381 45.1% Speak English less than very well8.4% of residents speak other language at home 132 100.0% Speak English very well
English speakers - Foreign-born 29.4% of residents of Oakleaf Plantation speak English at home.
8.1% of residents speak Spanish at home 147 56.1% Speak English very well115 43.9% Speak English less than very well64.0% of residents speak other language at home 1,163 56.3% Speak English very well904 43.7% Speak English less than very well
White (Caucasian) - Speak only English Native:
93.8% (12,672)Foreign-born:
33.9% (139)
White (Caucasian) - Speak another language Native:
4.6% (627)Foreign-born:
66.2% (272)
Black or African American - Speak only English Native:
95.6% (5,835)Foreign-born:
34.4% (122)
Black or African American - Speak another language Native:
4.2% (259)Foreign-born:
66.0% (234)
Asian - Speak only English Native:
63.1% (311)Foreign-born:
22.9% (370)
Asian - Speak another language Native:
21.7% (107)Foreign-born:
75.2% (1,216)
Other race - Speak only English Native:
84.4% (1,220)Foreign-born:
29.5% (86)
Other race - Speak another language Native:
22.9% (331)Foreign-born:
58.2% (170)
Two or more races - Speak another language Native:
19.1% (790)Foreign-born:
73.1% (59)
White alone - Speak only English Native:
98.2% (12,251)Foreign-born:
46.2% (142)
White alone - Speak another language Native:
1.7% (216)Foreign-born:
51.1% (157)
Hispanic or Latino - Speak only English Native:
58.0% (2,349)Foreign-born:
15.6% (47)
Hispanic or Latino - Speak another language Native:
40.7% (1,647)Foreign-born:
86.8% (263)
Foreign-born residents in Oakleaf Plantation
Marital status for residents in Oakleaf Plantation Marital status - White (Caucasian) population 15 years and over
Males 21.5% Never married65.9% Now married1.7% Separated3.0% Widowed8.0% DivorcedFemales 20.8% Never married60.6% Now married2.1% Separated4.5% Widowed12.0% DivorcedWomen who gave birth in the past 12 months Now married:
100.0% (176)Unmarried:
0.0% (0)
Women who did not give birth in the past 12 months Now married:
57.3% (2,145)Unmarried:
42.7% (1,595)
Marital status - Black or African American population 15 years and over
Males 16.6% Never married80.1% Now married0.0% Separated2.6% Widowed0.6% DivorcedFemales 34.2% Never married49.6% Now married4.7% Separated6.4% Widowed5.1% DivorcedWomen who gave birth in the past 12 months Now married:
100.0% (87)Unmarried:
0.0% (0)
Women who did not give birth in the past 12 months Now married:
50.7% (1,078)Unmarried:
49.3% (1,050)
Marital status - Asian population 15 years and over
Males 14.1% Never married85.9% Now married0.0% Separated0.0% Widowed0.0% DivorcedFemales 20.8% Never married50.7% Now married2.3% Separated14.6% Widowed11.6% DivorcedWomen who gave birth in the past 12 months Now married:
100.0% (33)Unmarried:
0.0% (0)
Women who did not give birth in the past 12 months Now married:
44.3% (260)Unmarried:
55.7% (327)
Marital status - Other race population 15 years and over
Males 11.7% Never married80.2% Now married0.0% Separated8.1% Widowed0.0% DivorcedFemales 28.3% Never married62.8% Now married0.0% Separated5.4% Widowed3.4% DivorcedWomen who gave birth in the past 12 months Now married:
100.0% (158)Unmarried:
0.0% (0)
Women who did not give birth in the past 12 months Now married:
44.9% (214)Unmarried:
55.1% (262)
Marital status - Two or more races population 15 years and over
Males 43.0% Never married15.3% Now married0.0% Separated2.0% Widowed39.7% DivorcedFemales 19.7% Never married30.7% Now married0.0% Separated2.7% Widowed46.9% DivorcedWomen who gave birth in the past 12 months Now married:
0.0% (0)Unmarried:
100.0% (334)
Women who did not give birth in the past 12 months Now married:
18.9% (164)Unmarried:
81.1% (703)
Marital status - White alone, not Hispanic / Latino population 15 years and over
Males 21.4% Never married65.3% Now married1.8% Separated3.1% Widowed8.4% DivorcedFemales 16.7% Never married63.3% Now married2.4% Separated5.2% Widowed12.5% DivorcedWomen who gave birth in the past 12 months Now married:
100.0% (109)Unmarried:
0.0% (0)
Women who did not give birth in the past 12 months Now married:
61.0% (1,989)Unmarried:
39.0% (1,270)
Marital status - Hispanic or Latino population 15 years and over
Males 20.5% Never married58.3% Now married0.0% Separated5.6% Widowed15.6% DivorcedFemales 28.6% Never married43.8% Now married0.0% Separated0.0% Widowed27.6% DivorcedWomen who gave birth in the past 12 months Now married:
53.4% (233)Unmarried:
46.6% (203)
Women who did not give birth in the past 12 months Now married:
27.6% (266)Unmarried:
72.4% (699)
Ancestries in Oakleaf Plantation
1,091 8.1% English831 6.2% Irish596 4.4% American457 3.4% Haitian353 2.6% Italian273 2.0% European154 1.1% French130 1.0% German81 0.6% Norwegian62 0.5% Swedish60 0.4% Scottish57 0.4% French Canadian57 0.4% African53 0.4% Trinidadian and Tobagonian51 0.4% West Indian43 0.3% Polish39 0.3% Palestinian35 0.3% Russian24 0.2% Guyanese22 0.2% British22 0.2% Pennsylvania German13 0.10% Brazilian
Geographical mobility in Oakleaf Plantation Same house 1 year ago 14,397 99.8% White (Caucasian)5,071 77.8% Black or African American2,746 92.1% Asian1,898 82.6% Other race4,147 89.4% Two or more races13,298 99.9% White alone, not Hispanic / Latino3,463 77.4% Hispanic or LatinoMoved within same county 165 1.1% White / Caucasian1,009 15.5% Black or African American120 4.0% Asian54 2.3% Other race56 1.2% Two or more races169 1.3% White alone, not Hispanic / Latino67 1.5% Hispanic or LatinoMoved within same state 291 2.0% White / Caucasian563 8.6% Black or African American119 4.0% Asian180 7.8% Other race434 9.4% Two or more races269 2.0% White alone, not Hispanic / Latino627 14.0% Hispanic or LatinoMoved from different state 25 0.2% White / Caucasian109 1.7% Black or African American72 1.6% Two or more races61 0.5% White alone, not Hispanic / LatinoMoved from abroad 139 2.1% Black or African American197 8.6% Other race257 5.7% Hispanic or Latino
Children Nativity (place of birth) in Oakleaf Plantation
Children under 6 years - Living with two parents Both parents native 869 100.0% NativeBoth parents foreign-born 37 100.0% NativeOne native, one foreign-born parent 315 100.0% NativeChildren under 6 years - Living with one parent Native parent 790 100.0% NativeForeign-born parent 78 100.0% NativeChildren 6 to 17 years - Living with two parents Both parents native 4,396 98.9% Native47 1.1% Foreign-bornBoth parents foreign-born 166 50.4% Native163 49.6% Foreign-bornOne native, one foreign-born parent 354 100.0% NativeChildren 6 to 17 years - Living with one parent Native parent 1,020 100.0% NativeForeign-born parent 342 50.6% Native334 49.4% Foreign-born
Grandparents responsible for own grandchildren in Oakleaf Plantation
Grandparents (30 to 59 years) White / Caucasian 48 28.3% Responsible for grandchildren123 71.7% Not responsible for grandchildrenBlack or African American 38 27.5% Responsible for grandchildren99 72.5% Not responsible for grandchildrenOther race 195 100.0% Not responsible for grandchildrenTwo or more races 136 100.0% Not responsible for grandchildrenWhite alone, not Hispanic / Latino 57 26.4% Responsible for grandchildren158 73.6% Not responsible for grandchildrenHispanic or Latino 47 17.6% Responsible for grandchildren222 82.4% Not responsible for grandchildrenGrandparents (60 years and over) White / Caucasian 79 32.8% Responsible for grandchildren161 67.2% Not responsible for grandchildrenBlack or African American 40 100.0% Not responsible for grandchildrenWhite alone, not Hispanic / Latino 79 32.0% Responsible for grandchildren167 68.0% Not responsible for grandchildren