Races in Oakbrook, Kentucky (KY) Detailed Stats
Data:
Races - White alone (%)
Races - White alone (% change since 2000)
Races - Black alone (%)
Races - Black alone (% change since 2000)
Races - American Indian alone (%)
Races - American Indian alone (% change since 2000)
Races - Asian alone (%)
Races - Asian alone (% change since 2000)
Races - Hispanic (%)
Races - Hispanic (% change since 2000)
Races - Native Hawaiian and Other Pacific Islander alone (%)
Races - Native Hawaiian and Other Pacific Islander alone (% change since 2000)
Races - Two or more races(%)
Races - Two or more races(% change since 2000)
Races - Other race alone (%)
Races - Other race alone (% change since 2000)
Racial diversity
Place of birth - Born in state of residence (%)
Place of birth - Born in state of residence (%) - White
Place of birth - Born in state of residence (%) - Black or African American
Place of birth - Born in state of residence (%) - Asian
Place of birth - Born in state of residence (%) - Hispanic or Latino
Place of birth - Born in state of residence (%) - American Indian and Alaska Native
Place of birth - Born in state of residence (%) - Multirace
Place of birth - Born in state of residence (%) - Other Race
Place of birth - Born in other state (%)
Place of birth - Born in other state (%) - White
Place of birth - Born in other state (%) - Black or African American
Place of birth - Born in other state (%) - Asian
Place of birth - Born in other state (%) - Hispanic or Latino
Place of birth - Born in other state (%) - American Indian and Alaska Native
Place of birth - Born in other state (%) - Multirace
Place of birth - Born in other state (%) - Other Race
Place of birth - Native, outside of US (%)
Place of birth - Native, outside of US (%) - White
Place of birth - Native, outside of US (%) - Black or African American
Place of birth - Native, outside of US (%) - Asian
Place of birth - Native, outside of US (%) - Hispanic or Latino
Place of birth - Native, outside of US (%) - American Indian and Alaska Native
Place of birth - Native, outside of US (%) - Multirace
Place of birth - Native, outside of US (%) - Other Race
Place of birth - Foreign born (%)
Place of birth - Foreign born (%) - White
Place of birth - Foreign born (%) - Black or African American
Place of birth - Foreign born (%) - Asian
Place of birth - Foreign born (%) - Hispanic or Latino
Place of birth - Foreign born (%) - American Indian and Alaska Native
Place of birth - Foreign born (%) - Multirace
Place of birth - Foreign born (%) - Other Race
Residents speaking English at home (%)
Residents speaking English at home - Born in the United States (%)
Residents speaking English at home - Native, born elsewhere (%)
Residents speaking English at home - Foreign born (%)
Residents speaking Spanish at home (%)
Residents speaking Spanish at home - Born in the United States (%)
Residents speaking Spanish at home - Native, born elsewhere (%)
Residents speaking Spanish at home - Foreign born (%)
Residents speaking other language at home (%)
Residents speaking other language at home - Born in the United States (%)
Residents speaking other language at home - Native, born elsewhere (%)
Residents speaking other language at home - Foreign born (%)
Marital status - Never married (%)
Marital status - Now married (%)
Marital status - Separated (%)
Marital status - Widowed (%)
Marital status - Divorced (%)
Ancestries Reported - Arab (%)
Ancestries Reported - Czech (%)
Ancestries Reported - Danish (%)
Ancestries Reported - Dutch (%)
Ancestries Reported - English (%)
Ancestries Reported - French (%)
Ancestries Reported - French Canadian (%)
Ancestries Reported - German (%)
Ancestries Reported - Greek (%)
Ancestries Reported - Hungarian (%)
Ancestries Reported - Irish (%)
Ancestries Reported - Italian (%)
Ancestries Reported - Lithuanian (%)
Ancestries Reported - Norwegian (%)
Ancestries Reported - Polish (%)
Ancestries Reported - Portuguese (%)
Ancestries Reported - Russian (%)
Ancestries Reported - Scotch-Irish (%)
Ancestries Reported - Scottish (%)
Ancestries Reported - Slovak (%)
Ancestries Reported - Subsaharan African (%)
Ancestries Reported - Swedish (%)
Ancestries Reported - Swiss (%)
Ancestries Reported - Ukrainian (%)
Ancestries Reported - United States (%)
Ancestries Reported - Welsh (%)
Ancestries Reported - West Indian (%)
Ancestries Reported - Other (%)
Geographical mobility - Same house 1 year ago (%)
Geographical mobility - Same house 1 year ago (%) - White
Geographical mobility - Same house 1 year ago (%) - Black or African American
Geographical mobility - Same house 1 year ago (%) - Asian
Geographical mobility - Same house 1 year ago (%) - Hispanic or Latino
Geographical mobility - Same house 1 year ago (%) - American Indian and Alaska Native
Geographical mobility - Same house 1 year ago (%) - Multirace
Geographical mobility - Same house 1 year ago (%) - Other Race
Geographical mobility - Moved within same county (%)
Geographical mobility - Moved within same county (%) - White
Geographical mobility - Moved within same county (%) - Black or African American
Geographical mobility - Moved within same county (%) - Asian
Geographical mobility - Moved within same county (%) - Hispanic or Latino
Geographical mobility - Moved within same county (%) - American Indian and Alaska Native
Geographical mobility - Moved within same county (%) - Multirace
Geographical mobility - Moved within same county (%) - Other Race
Geographical mobility - Moved from different county within same state (%)
Geographical mobility - Moved from different county within same state (%) - White
Geographical mobility - Moved from different county within same state (%) - Black or African American
Geographical mobility - Moved from different county within same state (%) - Asian
Geographical mobility - Moved from different county within same state (%) - Hispanic or Latino
Geographical mobility - Moved from different county within same state (%) - American Indian and Alaska Native
Geographical mobility - Moved from different county within same state (%) - Multirace
Geographical mobility - Moved from different county within same state (%) - Other Race
Geographical mobility - Moved from different state (%)
Geographical mobility - Moved from different state (%) - White
Geographical mobility - Moved from different state (%) - Black or African American
Geographical mobility - Moved from different state (%) - Asian
Geographical mobility - Moved from different state (%) - Hispanic or Latino
Geographical mobility - Moved from different state (%) - American Indian and Alaska Native
Geographical mobility - Moved from different state (%) - Multirace
Geographical mobility - Moved from different state (%) - Other Race
Geographical mobility - Moved from abroad (%)
Geographical mobility - Moved from abroad (%) - White
Geographical mobility - Moved from abroad (%) - Black or African American
Geographical mobility - Moved from abroad (%) - Asian
Geographical mobility - Moved from abroad (%) - Hispanic or Latino
Geographical mobility - Moved from abroad (%) - American Indian and Alaska Native
Geographical mobility - Moved from abroad (%) - Multirace
Geographical mobility - Moved from abroad (%) - Other Race
Place of birth for the foreign-born population - Ireland (%)
Place of birth for the foreign-born population - Denmark (%)
Place of birth for the foreign-born population - Norway (%)
Place of birth for the foreign-born population - Sweden (%)
Place of birth for the foreign-born population - United Kingdom (%)
Place of birth for the foreign-born population - England (%)
Place of birth for the foreign-born population - Scotland (%)
Place of birth for the foreign-born population - Other Northern Europe (%)
Place of birth for the foreign-born population - Austria (%)
Place of birth for the foreign-born population - Belgium (%)
Place of birth for the foreign-born population - France (%)
Place of birth for the foreign-born population - Germany (%)
Place of birth for the foreign-born population - Netherlands (%)
Place of birth for the foreign-born population - Switzerland (%)
Place of birth for the foreign-born population - Other Western Europe (%)
Place of birth for the foreign-born population - Greece (%)
Place of birth for the foreign-born population - Italy (%)
Place of birth for the foreign-born population - Portugal (%)
Place of birth for the foreign-born population - Spain (%)
Place of birth for the foreign-born population - Other Southern Europe (%)
Place of birth for the foreign-born population - Albania (%)
Place of birth for the foreign-born population - Belarus (%)
Place of birth for the foreign-born population - Bosnia and Herzegovina (%)
Place of birth for the foreign-born population - Bulgaria (%)
Place of birth for the foreign-born population - Croatia (%)
Place of birth for the foreign-born population - Czechoslovakia (%)
Place of birth for the foreign-born population - Hungary (%)
Place of birth for the foreign-born population - Latvia (%)
Place of birth for the foreign-born population - Lithuania (%)
Place of birth for the foreign-born population - North Macedonia (Macedonia) (%)
Place of birth for the foreign-born population - Moldova (%)
Place of birth for the foreign-born population - Poland (%)
Place of birth for the foreign-born population - Romania (%)
Place of birth for the foreign-born population - Russia (%)
Place of birth for the foreign-born population - Serbia (%)
Place of birth for the foreign-born population - Ukraine (%)
Place of birth for the foreign-born population - Other Eastern Europe (%)
Place of birth for the foreign-born population - China (%)
Place of birth for the foreign-born population - Hong Kong (%)
Place of birth for the foreign-born population - Taiwan (%)
Place of birth for the foreign-born population - Japan (%)
Place of birth for the foreign-born population - Korea (%)
Place of birth for the foreign-born population - Other Eastern Asia (%)
Place of birth for the foreign-born population - Afghanistan (%)
Place of birth for the foreign-born population - Bangladesh (%)
Place of birth for the foreign-born population - India (%)
Place of birth for the foreign-born population - Iran (%)
Place of birth for the foreign-born population - Kazakhstan (%)
Place of birth for the foreign-born population - Nepal (%)
Place of birth for the foreign-born population - Pakistan (%)
Place of birth for the foreign-born population - Sri Lanka (%)
Place of birth for the foreign-born population - Uzbekistan (%)
Place of birth for the foreign-born population - Other South Central Asia (%)
Place of birth for the foreign-born population - Burma (%)
Place of birth for the foreign-born population - Cambodia (%)
Place of birth for the foreign-born population - Indonesia (%)
Place of birth for the foreign-born population - Laos (%)
Place of birth for the foreign-born population - Malaysia (%)
Place of birth for the foreign-born population - Philippines (%)
Place of birth for the foreign-born population - Singapore (%)
Place of birth for the foreign-born population - Thailand (%)
Place of birth for the foreign-born population - Vietnam (%)
Place of birth for the foreign-born population - Other South Eastern Asia (%)
Place of birth for the foreign-born population - Armenia (%)
Place of birth for the foreign-born population - Iraq (%)
Place of birth for the foreign-born population - Israel (%)
Place of birth for the foreign-born population - Jordan (%)
Place of birth for the foreign-born population - Kuwait (%)
Place of birth for the foreign-born population - Lebanon (%)
Place of birth for the foreign-born population - Saudi Arabia (%)
Place of birth for the foreign-born population - Syria (%)
Place of birth for the foreign-born population - Turkey (%)
Place of birth for the foreign-born population - Yemen (%)
Place of birth for the foreign-born population - Other Western Asia (%)
Place of birth for the foreign-born population - Eritrea (%)
Place of birth for the foreign-born population - Ethiopia (%)
Place of birth for the foreign-born population - Kenya (%)
Place of birth for the foreign-born population - Somalia (%)
Place of birth for the foreign-born population - Uganda (%)
Place of birth for the foreign-born population - Zimbabwe (%)
Place of birth for the foreign-born population - Other Eastern Africa (%)
Place of birth for the foreign-born population - Cameroon (%)
Place of birth for the foreign-born population - Congo (%)
Place of birth for the foreign-born population - Democratic Republic of Congo (Zaire) (%)
Place of birth for the foreign-born population - Other Middle Africa (%)
Place of birth for the foreign-born population - Egypt (%)
Place of birth for the foreign-born population - Morocco (%)
Place of birth for the foreign-born population - Sudan (%)
Place of birth for the foreign-born population - Other Northern Africa (%)
Place of birth for the foreign-born population - South Africa (%)
Place of birth for the foreign-born population - Other Southern Africa (%)
Place of birth for the foreign-born population - Cabo Verde (%)
Place of birth for the foreign-born population - Ghana (%)
Place of birth for the foreign-born population - Liberia (%)
Place of birth for the foreign-born population - Nigeria (%)
Place of birth for the foreign-born population - Senegal (%)
Place of birth for the foreign-born population - Sierra Leone (%)
Place of birth for the foreign-born population - Other Western Africa (%)
Place of birth for the foreign-born population - Australia (%)
Place of birth for the foreign-born population - New Zealand (%)
Place of birth for the foreign-born population - Fiji (%)
Place of birth for the foreign-born population - Micronesia (%)
Place of birth for the foreign-born population - Bahamas (%)
Place of birth for the foreign-born population - Barbados (%)
Place of birth for the foreign-born population - Cuba (%)
Place of birth for the foreign-born population - Dominica (%)
Place of birth for the foreign-born population - Dominican Republic (%)
Place of birth for the foreign-born population - Grenada (%)
Place of birth for the foreign-born population - Haiti (%)
Place of birth for the foreign-born population - Jamaica (%)
Place of birth for the foreign-born population - St. Vincent and the Grenadines (%)
Place of birth for the foreign-born population - Trinidad and Tobago (%)
Place of birth for the foreign-born population - West Indies (%)
Place of birth for the foreign-born population - Other Caribbean (%)
Place of birth for the foreign-born population - Belize (%)
Place of birth for the foreign-born population - Costa Rica (%)
Place of birth for the foreign-born population - El Salvador (%)
Place of birth for the foreign-born population - Guatemala (%)
Place of birth for the foreign-born population - Honduras (%)
Place of birth for the foreign-born population - Mexico (%)
Place of birth for the foreign-born population - Nicaragua (%)
Place of birth for the foreign-born population - Panama (%)
Place of birth for the foreign-born population - Other Central America (%)
Place of birth for the foreign-born population - Argentina (%)
Place of birth for the foreign-born population - Bolivia (%)
Place of birth for the foreign-born population - Brazil (%)
Place of birth for the foreign-born population - Chile (%)
Place of birth for the foreign-born population - Colombia (%)
Place of birth for the foreign-born population - Ecuador (%)
Place of birth for the foreign-born population - Guyana (%)
Place of birth for the foreign-born population - Peru (%)
Place of birth for the foreign-born population - Uruguay (%)
Place of birth for the foreign-born population - Venezuela (%)
Place of birth for the foreign-born population - Other South America (%)
Place of birth for the foreign-born population - Canada (%)
Place of birth for the foreign-born population - Other Northern America (%)
Place of birth for the foreign-born population - Other (%)
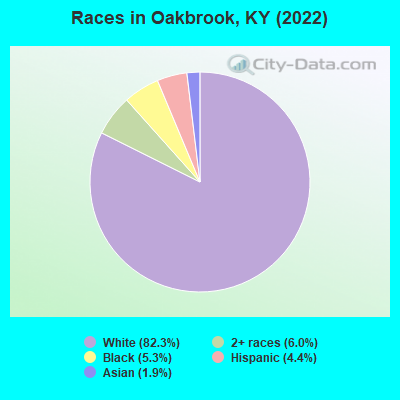
According to 2022 data, the most numerous races in Oakbrook, KY are White alone (8,449 residents), Black alone (541 residents), and Hispanic (451 residents). 90.1% of Oakbrook residents speak English at home. 7.1% of Oakbrook, KY residents are foreign-born (2.9% born in Latin America, 1.6% born in Asia, 1.3% born in Europe), which is 43.6% greater than the foreign-born rate of 4.0% across the entire state of Kentucky.
Race distribution in Oakbrook
2000 2022
3,608,013 89.3% White alone 293,639 7.3% Black alone 59,939 1.5% Hispanic 37,750 0.9% Two or more races 29,368 0.7% Asian alone 7,939 0.2% American Indian alone 3,846 0.10% Other race alone 1,275 0.03% Native Hawaiian and Other
3,710,998 82.2% White alone 343,194 7.6% Black alone 187,483 4.2% Hispanic 187,394 4.2% Two or more races 62,240 1.4% Asian alone 13,529 0.3% Other race alone 4,302 0.10% American Indian alone 3,170 0.07% Native Hawaiian and Other
Income and house value in Oakbrook Median household income in 2022 $102,855 White non-Hispanic householders$106,008 Two or more races householdersMedian 2022 house value $268,397 White Non-Hispanic householders$255,988 Black or African American householders $429,511 Asian householders$375,297 Two or more races householders$281,568 Hispanic or Latino householders
Median age by race in Oakbrook
44.1 Median age for White residents43.4 45.0 35.4 Median age for Black or African American residents35.6 20.7 -521,556,256.1 Median age for American Indian / Alaska Native residents-607,449,856.1 -630,065,358.8 41.9 Median age for Asian residents26.5 46.4 -914,965,985.5 Median age for Native Hawaiian / Pacific Islander residents-1,069,860,278.4 -853,801,168.7 26.0 Median age for Other race residents28.1 24.8 24.9 Median age for Two or more races residents8.2 31.5 44.2 Median age for White alone residents43.3 45.5 28.1 Median age for Hispanic or Latino residents33.0 28.0
Owner/renter occupied households by race in Oakbrook
House owners and renters - White residents 3,190 86.8% Owner occupied487 13.2% Renter occupiedHouse owners and renters - Black or African American residents 167 57.7% Owner occupied123 42.3% Renter occupiedHouse owners and renters - Asian residents 45 41.4% Owner occupied64 58.6% Renter occupiedHouse owners and renters - Other race residents 33 100.0% Owner occupiedHouse owners and renters - Two or more races residents 109 71.1% Owner occupied45 28.9% Renter occupiedHouse owners and renters - White alone residents 3,156 87.6% Owner occupied447 12.4% Renter occupiedHouse owners and renters - Hispanic or Latino residents 112 71.5% Owner occupied45 28.5% Renter occupied
Language usage in Oakbrook
English speakers - Total 90.1% of residents of Oakbrook speak English at home.
4.2% of residents speak Spanish at home 222 54.1% Speak English very well188 45.9% Speak English less than very well5.9% of residents speak other language at home 429 74.5% Speak English very well147 25.5% Speak English less than very well
English speakers - Born in the United States 98.8% of residents of Oakbrook speak English at home.
0.4% of residents speak Spanish at home 16 100.0% Speak English very well1.1% of residents speak other language at home 31 77.5% Speak English very well9 22.5% Speak English less than very well
English speakers - Native, born elsewhere 58.7% of residents of Oakbrook speak English at home.
27.4% of residents speak other language at home 49 100.0% Speak English very well
English speakers - Foreign-born 16.5% of residents of Oakbrook speak English at home.
46.0% of residents speak Spanish at home 249 69.9% Speak English very well107 30.1% Speak English less than very well45.1% of residents speak other language at home 224 64.2% Speak English very well125 35.8% Speak English less than very well
White (Caucasian) - Speak only English Native:
97.7% (7,717)Foreign-born:
52.1% (113)
White (Caucasian) - Speak another language Native:
2.3% (181)Foreign-born:
51.2% (112)
Black or African American - Speak another language Native:
1.4% (8)Foreign-born:
97.0% (66)
Asian - Speak only English Native:
55.7% (35)Foreign-born:
14.0% (18)
Asian - Speak another language Native:
99.3% (62)Foreign-born:
84.7% (110)
Other race - Speak another language Native:
56.6% (35)Foreign-born:
98.6% (278)
Two or more races - Speak another language Native:
19.6% (77)Foreign-born:
98.8% (93)
White alone - Speak only English Native:
97.5% (7,656)Foreign-born:
47.6% (113)
White alone - Speak another language Native:
2.9% (226)Foreign-born:
50.7% (121)
Hispanic or Latino - Speak another language Native:
25.4% (32)Foreign-born:
98.9% (351)
Foreign-born residents in Oakbrook 728 residents are foreign born (2.9% Latin America , 1.6% Asia , 1.3% Europe ).
This city:
7.1%Kentucky:
4.1%
Marital status for residents in Oakbrook Marital status - White (Caucasian) population 15 years and over
Males 32.4% Never married55.3% Now married2.3% Separated1.4% Widowed8.5% DivorcedFemales 23.3% Never married58.9% Now married0.9% Separated6.0% Widowed11.0% DivorcedWomen who gave birth in the past 12 months Now married:
89.5% (105)Unmarried:
10.5% (12)
Women who did not give birth in the past 12 months Now married:
45.7% (739)Unmarried:
54.3% (876)
Marital status - Black or African American population 15 years and over
Males 76.6% Never married11.3% Now married0.0% Separated0.0% Widowed12.0% DivorcedFemales 97.1% Never married2.9% Now married0.0% Separated0.0% Widowed0.0% DivorcedWomen who did not give birth in the past 12 months Now married:
2.9% (10)Unmarried:
97.1% (338)
Marital status - Asian population 15 years and over
Males 56.2% Never married35.2% Now married0.0% Separated0.0% Widowed8.6% DivorcedFemales 22.1% Never married33.7% Now married44.2% Separated0.0% Widowed0.0% DivorcedWomen who gave birth in the past 12 months Now married:
100.0% (11)Unmarried:
0.0% (0)
Women who did not give birth in the past 12 months Now married:
83.3% (45)Unmarried:
16.7% (9)
Marital status - Other race population 15 years and over
Males 16.4% Never married83.6% Now married0.0% Separated0.0% Widowed0.0% DivorcedFemales 0.0% Never married89.4% Now married0.0% Separated0.0% Widowed10.6% DivorcedWomen who did not give birth in the past 12 months Now married:
89.4% (100)Unmarried:
10.6% (12)
Marital status - Two or more races population 15 years and over
Males 15.1% Never married82.2% Now married1.4% Separated0.0% Widowed1.4% DivorcedFemales 13.2% Never married86.8% Now married0.0% Separated0.0% Widowed0.0% DivorcedWomen who gave birth in the past 12 months Now married:
100.0% (9)Unmarried:
0.0% (0)
Women who did not give birth in the past 12 months Now married:
78.8% (117)Unmarried:
21.2% (31)
Marital status - White alone, not Hispanic / Latino population 15 years and over
Males 32.5% Never married55.3% Now married2.3% Separated1.4% Widowed8.5% DivorcedFemales 22.3% Never married60.0% Now married0.9% Separated6.1% Widowed10.7% DivorcedWomen who gave birth in the past 12 months Now married:
89.5% (107)Unmarried:
10.5% (13)
Women who did not give birth in the past 12 months Now married:
47.2% (749)Unmarried:
52.8% (838)
Marital status - Hispanic or Latino population 15 years and over
Males 15.8% Never married83.3% Now married0.0% Separated0.0% Widowed0.9% DivorcedFemales 33.1% Never married52.8% Now married0.0% Separated0.0% Widowed14.0% DivorcedWomen who gave birth in the past 12 months Now married:
100.0% (5)Unmarried:
0.0% (0)
Women who did not give birth in the past 12 months Now married:
56.1% (94)Unmarried:
43.9% (74)
Ancestries in Oakbrook
1,196 27.3% German508 11.6% American442 10.1% English342 7.8% Irish328 7.5% European165 3.8% Italian109 2.5% Brazilian58 1.3% Scottish54 1.2% Polish48 1.1% Welsh33 0.8% Yugoslavian25 0.6% Palestinian19 0.4% Bulgarian16 0.4% French15 0.3% Ghanaian14 0.3% Hungarian11 0.3% Finnish9 0.2% Danish8 0.2% Portuguese8 0.2% Scotch-Irish7 0.2% Canadian7 0.2% French Canadian6 0.1% British4 0.09% Slovene
Children Nativity (place of birth) in Oakbrook
Children under 6 years - Living with two parents Both parents native 394 100.0% NativeBoth parents foreign-born 29 100.0% NativeChildren under 6 years - Living with one parent Native parent 102 100.0% NativeForeign-born parent 69 100.0% NativeChildren 6 to 17 years - Living with two parents Both parents native 680 100.0% NativeBoth parents foreign-born 45 44.6% Native56 55.4% Foreign-bornOne native, one foreign-born parent 53 100.0% NativeChildren 6 to 17 years - Living with one parent Native parent 288 100.0% Native
Grandparents responsible for own grandchildren in Oakbrook
Grandparents (30 to 59 years) White / Caucasian 51 60.3% Responsible for grandchildren33 39.7% Not responsible for grandchildrenTwo or more races 5 100.0% Responsible for grandchildrenWhite alone, not Hispanic / Latino 51 60.3% Responsible for grandchildren33 39.7% Not responsible for grandchildrenGrandparents (60 years and over) White / Caucasian 22 51.4% Responsible for grandchildren21 48.6% Not responsible for grandchildrenWhite alone, not Hispanic / Latino 26 54.4% Responsible for grandchildren22 45.6% Not responsible for grandchildren