Races in Oak Lawn, Illinois (IL) Detailed Stats
Data:
Races - White alone (%)
Races - White alone (% change since 2000)
Races - Black alone (%)
Races - Black alone (% change since 2000)
Races - American Indian alone (%)
Races - American Indian alone (% change since 2000)
Races - Asian alone (%)
Races - Asian alone (% change since 2000)
Races - Hispanic (%)
Races - Hispanic (% change since 2000)
Races - Native Hawaiian and Other Pacific Islander alone (%)
Races - Native Hawaiian and Other Pacific Islander alone (% change since 2000)
Races - Two or more races(%)
Races - Two or more races(% change since 2000)
Races - Other race alone (%)
Races - Other race alone (% change since 2000)
Racial diversity
Place of birth - Born in state of residence (%)
Place of birth - Born in state of residence (%) - White
Place of birth - Born in state of residence (%) - Black or African American
Place of birth - Born in state of residence (%) - Asian
Place of birth - Born in state of residence (%) - Hispanic or Latino
Place of birth - Born in state of residence (%) - American Indian and Alaska Native
Place of birth - Born in state of residence (%) - Multirace
Place of birth - Born in state of residence (%) - Other Race
Place of birth - Born in other state (%)
Place of birth - Born in other state (%) - White
Place of birth - Born in other state (%) - Black or African American
Place of birth - Born in other state (%) - Asian
Place of birth - Born in other state (%) - Hispanic or Latino
Place of birth - Born in other state (%) - American Indian and Alaska Native
Place of birth - Born in other state (%) - Multirace
Place of birth - Born in other state (%) - Other Race
Place of birth - Native, outside of US (%)
Place of birth - Native, outside of US (%) - White
Place of birth - Native, outside of US (%) - Black or African American
Place of birth - Native, outside of US (%) - Asian
Place of birth - Native, outside of US (%) - Hispanic or Latino
Place of birth - Native, outside of US (%) - American Indian and Alaska Native
Place of birth - Native, outside of US (%) - Multirace
Place of birth - Native, outside of US (%) - Other Race
Place of birth - Foreign born (%)
Place of birth - Foreign born (%) - White
Place of birth - Foreign born (%) - Black or African American
Place of birth - Foreign born (%) - Asian
Place of birth - Foreign born (%) - Hispanic or Latino
Place of birth - Foreign born (%) - American Indian and Alaska Native
Place of birth - Foreign born (%) - Multirace
Place of birth - Foreign born (%) - Other Race
Residents speaking English at home (%)
Residents speaking English at home - Born in the United States (%)
Residents speaking English at home - Native, born elsewhere (%)
Residents speaking English at home - Foreign born (%)
Residents speaking Spanish at home (%)
Residents speaking Spanish at home - Born in the United States (%)
Residents speaking Spanish at home - Native, born elsewhere (%)
Residents speaking Spanish at home - Foreign born (%)
Residents speaking other language at home (%)
Residents speaking other language at home - Born in the United States (%)
Residents speaking other language at home - Native, born elsewhere (%)
Residents speaking other language at home - Foreign born (%)
Marital status - Never married (%)
Marital status - Now married (%)
Marital status - Separated (%)
Marital status - Widowed (%)
Marital status - Divorced (%)
Ancestries Reported - Arab (%)
Ancestries Reported - Czech (%)
Ancestries Reported - Danish (%)
Ancestries Reported - Dutch (%)
Ancestries Reported - English (%)
Ancestries Reported - French (%)
Ancestries Reported - French Canadian (%)
Ancestries Reported - German (%)
Ancestries Reported - Greek (%)
Ancestries Reported - Hungarian (%)
Ancestries Reported - Irish (%)
Ancestries Reported - Italian (%)
Ancestries Reported - Lithuanian (%)
Ancestries Reported - Norwegian (%)
Ancestries Reported - Polish (%)
Ancestries Reported - Portuguese (%)
Ancestries Reported - Russian (%)
Ancestries Reported - Scotch-Irish (%)
Ancestries Reported - Scottish (%)
Ancestries Reported - Slovak (%)
Ancestries Reported - Subsaharan African (%)
Ancestries Reported - Swedish (%)
Ancestries Reported - Swiss (%)
Ancestries Reported - Ukrainian (%)
Ancestries Reported - United States (%)
Ancestries Reported - Welsh (%)
Ancestries Reported - West Indian (%)
Ancestries Reported - Other (%)
Geographical mobility - Same house 1 year ago (%)
Geographical mobility - Same house 1 year ago (%) - White
Geographical mobility - Same house 1 year ago (%) - Black or African American
Geographical mobility - Same house 1 year ago (%) - Asian
Geographical mobility - Same house 1 year ago (%) - Hispanic or Latino
Geographical mobility - Same house 1 year ago (%) - American Indian and Alaska Native
Geographical mobility - Same house 1 year ago (%) - Multirace
Geographical mobility - Same house 1 year ago (%) - Other Race
Geographical mobility - Moved within same county (%)
Geographical mobility - Moved within same county (%) - White
Geographical mobility - Moved within same county (%) - Black or African American
Geographical mobility - Moved within same county (%) - Asian
Geographical mobility - Moved within same county (%) - Hispanic or Latino
Geographical mobility - Moved within same county (%) - American Indian and Alaska Native
Geographical mobility - Moved within same county (%) - Multirace
Geographical mobility - Moved within same county (%) - Other Race
Geographical mobility - Moved from different county within same state (%)
Geographical mobility - Moved from different county within same state (%) - White
Geographical mobility - Moved from different county within same state (%) - Black or African American
Geographical mobility - Moved from different county within same state (%) - Asian
Geographical mobility - Moved from different county within same state (%) - Hispanic or Latino
Geographical mobility - Moved from different county within same state (%) - American Indian and Alaska Native
Geographical mobility - Moved from different county within same state (%) - Multirace
Geographical mobility - Moved from different county within same state (%) - Other Race
Geographical mobility - Moved from different state (%)
Geographical mobility - Moved from different state (%) - White
Geographical mobility - Moved from different state (%) - Black or African American
Geographical mobility - Moved from different state (%) - Asian
Geographical mobility - Moved from different state (%) - Hispanic or Latino
Geographical mobility - Moved from different state (%) - American Indian and Alaska Native
Geographical mobility - Moved from different state (%) - Multirace
Geographical mobility - Moved from different state (%) - Other Race
Geographical mobility - Moved from abroad (%)
Geographical mobility - Moved from abroad (%) - White
Geographical mobility - Moved from abroad (%) - Black or African American
Geographical mobility - Moved from abroad (%) - Asian
Geographical mobility - Moved from abroad (%) - Hispanic or Latino
Geographical mobility - Moved from abroad (%) - American Indian and Alaska Native
Geographical mobility - Moved from abroad (%) - Multirace
Geographical mobility - Moved from abroad (%) - Other Race
Place of birth for the foreign-born population - Ireland (%)
Place of birth for the foreign-born population - Denmark (%)
Place of birth for the foreign-born population - Norway (%)
Place of birth for the foreign-born population - Sweden (%)
Place of birth for the foreign-born population - United Kingdom (%)
Place of birth for the foreign-born population - England (%)
Place of birth for the foreign-born population - Scotland (%)
Place of birth for the foreign-born population - Other Northern Europe (%)
Place of birth for the foreign-born population - Austria (%)
Place of birth for the foreign-born population - Belgium (%)
Place of birth for the foreign-born population - France (%)
Place of birth for the foreign-born population - Germany (%)
Place of birth for the foreign-born population - Netherlands (%)
Place of birth for the foreign-born population - Switzerland (%)
Place of birth for the foreign-born population - Other Western Europe (%)
Place of birth for the foreign-born population - Greece (%)
Place of birth for the foreign-born population - Italy (%)
Place of birth for the foreign-born population - Portugal (%)
Place of birth for the foreign-born population - Spain (%)
Place of birth for the foreign-born population - Other Southern Europe (%)
Place of birth for the foreign-born population - Albania (%)
Place of birth for the foreign-born population - Belarus (%)
Place of birth for the foreign-born population - Bosnia and Herzegovina (%)
Place of birth for the foreign-born population - Bulgaria (%)
Place of birth for the foreign-born population - Croatia (%)
Place of birth for the foreign-born population - Czechoslovakia (%)
Place of birth for the foreign-born population - Hungary (%)
Place of birth for the foreign-born population - Latvia (%)
Place of birth for the foreign-born population - Lithuania (%)
Place of birth for the foreign-born population - North Macedonia (Macedonia) (%)
Place of birth for the foreign-born population - Moldova (%)
Place of birth for the foreign-born population - Poland (%)
Place of birth for the foreign-born population - Romania (%)
Place of birth for the foreign-born population - Russia (%)
Place of birth for the foreign-born population - Serbia (%)
Place of birth for the foreign-born population - Ukraine (%)
Place of birth for the foreign-born population - Other Eastern Europe (%)
Place of birth for the foreign-born population - China (%)
Place of birth for the foreign-born population - Hong Kong (%)
Place of birth for the foreign-born population - Taiwan (%)
Place of birth for the foreign-born population - Japan (%)
Place of birth for the foreign-born population - Korea (%)
Place of birth for the foreign-born population - Other Eastern Asia (%)
Place of birth for the foreign-born population - Afghanistan (%)
Place of birth for the foreign-born population - Bangladesh (%)
Place of birth for the foreign-born population - India (%)
Place of birth for the foreign-born population - Iran (%)
Place of birth for the foreign-born population - Kazakhstan (%)
Place of birth for the foreign-born population - Nepal (%)
Place of birth for the foreign-born population - Pakistan (%)
Place of birth for the foreign-born population - Sri Lanka (%)
Place of birth for the foreign-born population - Uzbekistan (%)
Place of birth for the foreign-born population - Other South Central Asia (%)
Place of birth for the foreign-born population - Burma (%)
Place of birth for the foreign-born population - Cambodia (%)
Place of birth for the foreign-born population - Indonesia (%)
Place of birth for the foreign-born population - Laos (%)
Place of birth for the foreign-born population - Malaysia (%)
Place of birth for the foreign-born population - Philippines (%)
Place of birth for the foreign-born population - Singapore (%)
Place of birth for the foreign-born population - Thailand (%)
Place of birth for the foreign-born population - Vietnam (%)
Place of birth for the foreign-born population - Other South Eastern Asia (%)
Place of birth for the foreign-born population - Armenia (%)
Place of birth for the foreign-born population - Iraq (%)
Place of birth for the foreign-born population - Israel (%)
Place of birth for the foreign-born population - Jordan (%)
Place of birth for the foreign-born population - Kuwait (%)
Place of birth for the foreign-born population - Lebanon (%)
Place of birth for the foreign-born population - Saudi Arabia (%)
Place of birth for the foreign-born population - Syria (%)
Place of birth for the foreign-born population - Turkey (%)
Place of birth for the foreign-born population - Yemen (%)
Place of birth for the foreign-born population - Other Western Asia (%)
Place of birth for the foreign-born population - Eritrea (%)
Place of birth for the foreign-born population - Ethiopia (%)
Place of birth for the foreign-born population - Kenya (%)
Place of birth for the foreign-born population - Somalia (%)
Place of birth for the foreign-born population - Uganda (%)
Place of birth for the foreign-born population - Zimbabwe (%)
Place of birth for the foreign-born population - Other Eastern Africa (%)
Place of birth for the foreign-born population - Cameroon (%)
Place of birth for the foreign-born population - Congo (%)
Place of birth for the foreign-born population - Democratic Republic of Congo (Zaire) (%)
Place of birth for the foreign-born population - Other Middle Africa (%)
Place of birth for the foreign-born population - Egypt (%)
Place of birth for the foreign-born population - Morocco (%)
Place of birth for the foreign-born population - Sudan (%)
Place of birth for the foreign-born population - Other Northern Africa (%)
Place of birth for the foreign-born population - South Africa (%)
Place of birth for the foreign-born population - Other Southern Africa (%)
Place of birth for the foreign-born population - Cabo Verde (%)
Place of birth for the foreign-born population - Ghana (%)
Place of birth for the foreign-born population - Liberia (%)
Place of birth for the foreign-born population - Nigeria (%)
Place of birth for the foreign-born population - Senegal (%)
Place of birth for the foreign-born population - Sierra Leone (%)
Place of birth for the foreign-born population - Other Western Africa (%)
Place of birth for the foreign-born population - Australia (%)
Place of birth for the foreign-born population - New Zealand (%)
Place of birth for the foreign-born population - Fiji (%)
Place of birth for the foreign-born population - Micronesia (%)
Place of birth for the foreign-born population - Bahamas (%)
Place of birth for the foreign-born population - Barbados (%)
Place of birth for the foreign-born population - Cuba (%)
Place of birth for the foreign-born population - Dominica (%)
Place of birth for the foreign-born population - Dominican Republic (%)
Place of birth for the foreign-born population - Grenada (%)
Place of birth for the foreign-born population - Haiti (%)
Place of birth for the foreign-born population - Jamaica (%)
Place of birth for the foreign-born population - St. Vincent and the Grenadines (%)
Place of birth for the foreign-born population - Trinidad and Tobago (%)
Place of birth for the foreign-born population - West Indies (%)
Place of birth for the foreign-born population - Other Caribbean (%)
Place of birth for the foreign-born population - Belize (%)
Place of birth for the foreign-born population - Costa Rica (%)
Place of birth for the foreign-born population - El Salvador (%)
Place of birth for the foreign-born population - Guatemala (%)
Place of birth for the foreign-born population - Honduras (%)
Place of birth for the foreign-born population - Mexico (%)
Place of birth for the foreign-born population - Nicaragua (%)
Place of birth for the foreign-born population - Panama (%)
Place of birth for the foreign-born population - Other Central America (%)
Place of birth for the foreign-born population - Argentina (%)
Place of birth for the foreign-born population - Bolivia (%)
Place of birth for the foreign-born population - Brazil (%)
Place of birth for the foreign-born population - Chile (%)
Place of birth for the foreign-born population - Colombia (%)
Place of birth for the foreign-born population - Ecuador (%)
Place of birth for the foreign-born population - Guyana (%)
Place of birth for the foreign-born population - Peru (%)
Place of birth for the foreign-born population - Uruguay (%)
Place of birth for the foreign-born population - Venezuela (%)
Place of birth for the foreign-born population - Other South America (%)
Place of birth for the foreign-born population - Canada (%)
Place of birth for the foreign-born population - Other Northern America (%)
Place of birth for the foreign-born population - Other (%)
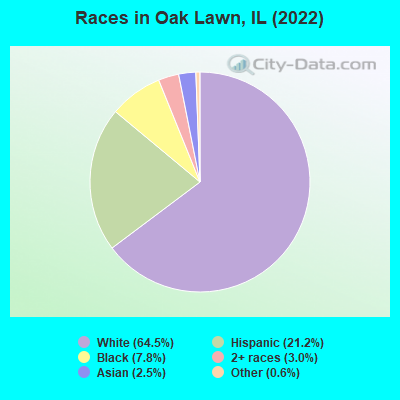
According to 2022 data, the most numerous races in Oak Lawn, IL are White alone (36,365 residents), Hispanic (11,953 residents), and Black alone (4,377 residents). 70.3% of Oak Lawn residents speak English at home. 16.7% of Oak Lawn, IL residents are foreign-born (5.5% born in Europe, 5.3% born in Asia, 5.0% born in Latin America), which is 16.1% greater than the foreign-born rate of 14.0% across the entire state of Illinois.
Race distribution in Oak Lawn
2000 2022
8,424,140 67.8% White alone 1,856,152 14.9% Black alone 1,530,262 12.3% Hispanic 419,916 3.4% Asian alone 153,996 1.2% Two or more races 13,479 0.1% Other race alone 18,232 0.1% American Indian alone 3,116 0.03% Native Hawaiian and Other
7,356,301 58.5% White alone 2,299,726 18.3% Hispanic 1,660,423 13.2% Black alone 747,296 5.9% Asian alone 458,599 3.6% Two or more races 45,386 0.4% Other race alone 10,405 0.08% American Indian alone 3,896 0.03% Native Hawaiian and Other
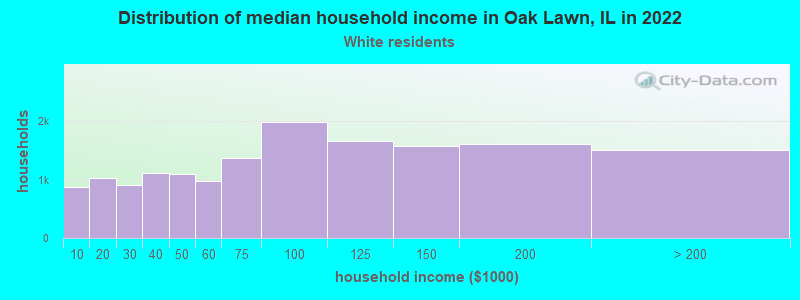
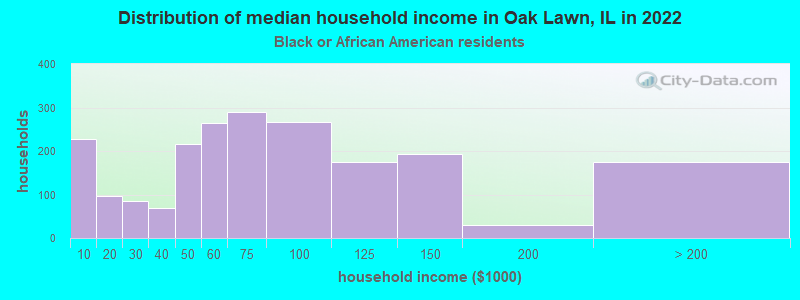
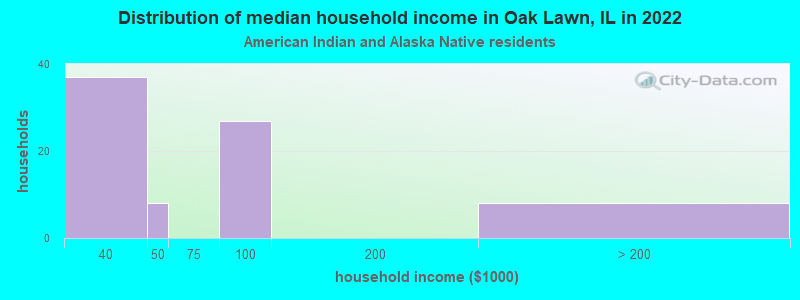
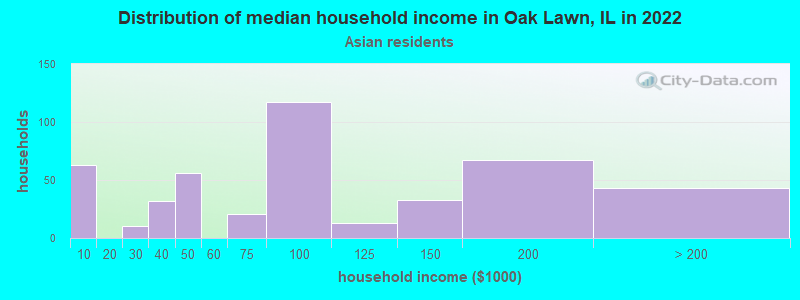
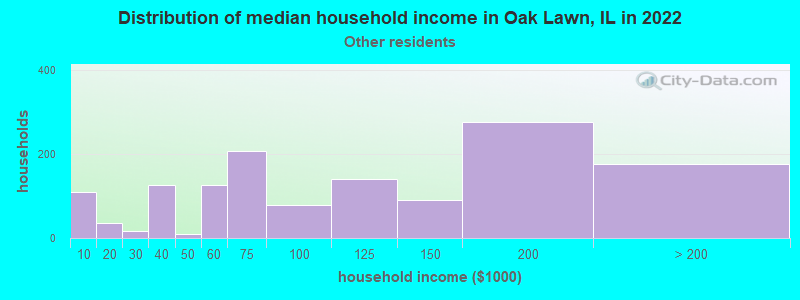
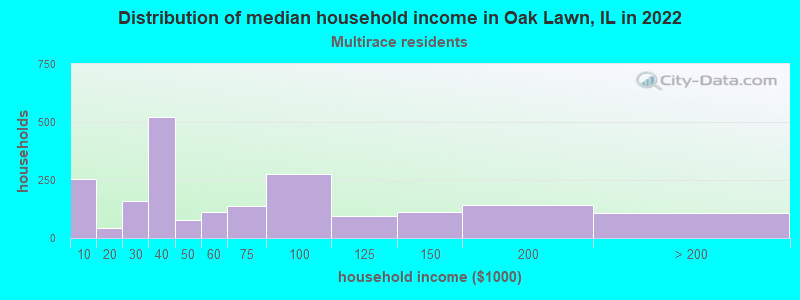
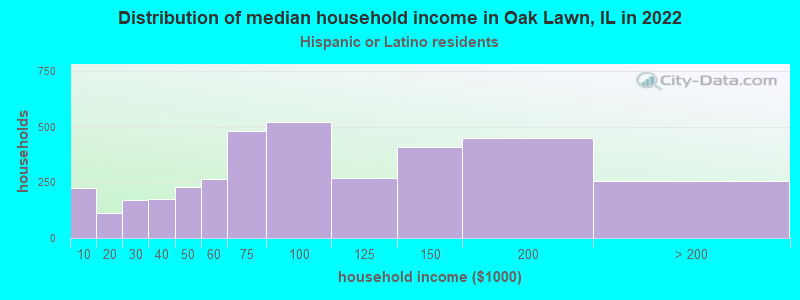
Income and house value in Oak Lawn Median household income in 2022 $77,274 White non-Hispanic householders$63,013 Black householders$83,807 Asian householders$82,577 Some other race householders$50,759 Two or more races householders$80,053 Hispanic or Latino race householdersMedian 2022 house value $273,003 White Non-Hispanic householders$314,695 Black or African American householders$281,551 American Indian or Alaska Native householders $292,017 Asian householders$298,472 Some other race householders$285,737 Two or more races householders$287,482 Hispanic or Latino householders
Median age by race in Oak Lawn
46.7 Median age for White residents44.6 48.5 38.0 Median age for Black or African American residents37.1 41.2 37.3 Median age for American Indian / Alaska Native residents43.7 33.5 37.1 Median age for Asian residents37.1 38.3 -687,999,999.3 Median age for Native Hawaiian / Pacific Islander residents-918,721,460.3 -610,229,276.3 32.7 Median age for Other race residents33.4 32.4 27.4 Median age for Two or more races residents28.3 27.6 48.4 Median age for White alone residents46.5 50.0 29.9 Median age for Hispanic or Latino residents29.5 30.2
Owner/renter occupied households by race in Oak Lawn
House owners and renters - White residents 13,584 86.4% Owner occupied2,133 13.6% Renter occupiedHouse owners and renters - Black or African American residents 1,072 51.1% Owner occupied1,025 48.9% Renter occupiedHouse owners and renters - American Indian / Alaska Native residents 103 100.0% Owner occupiedHouse owners and renters - Asian residents 415 84.8% Owner occupied74 15.2% Renter occupiedHouse owners and renters - Native Hawaiian / Pacific Islander residents 12 100.0% Owner occupiedHouse owners and renters - Other race residents 995 69.2% Owner occupied443 30.8% Renter occupiedHouse owners and renters - Two or more races residents 1,626 83.2% Owner occupied328 16.8% Renter occupiedHouse owners and renters - White alone residents 13,115 86.2% Owner occupied2,095 13.8% Renter occupiedHouse owners and renters - Hispanic or Latino residents 3,005 82.3% Owner occupied648 17.7% Renter occupied
Language usage in Oak Lawn
English speakers - Total 70.3% of residents of Oak Lawn speak English at home.
13.9% of residents speak Spanish at home 5,091 69.2% Speak English very well2,266 30.8% Speak English less than very well15.6% of residents speak other language at home 4,510 54.7% Speak English very well3,731 45.3% Speak English less than very well
English speakers - Born in the United States 83.0% of residents of Oak Lawn speak English at home.
12.8% of residents speak Spanish at home 445 82.3% Speak English very well96 17.7% Speak English less than very well3.9% of residents speak other language at home 150 91.5% Speak English very well14 8.5% Speak English less than very well
English speakers - Native, born elsewhere 38.8% of residents of Oak Lawn speak English at home.
14.2% of residents speak Spanish at home 107 90.7% Speak English very well11 9.3% Speak English less than very well48.4% of residents speak other language at home 215 53.3% Speak English very well188 46.7% Speak English less than very well
English speakers - Foreign-born 13.1% of residents of Oak Lawn speak English at home.
28.1% of residents speak Spanish at home 1,090 41.3% Speak English very well1,548 58.7% Speak English less than very well58.4% of residents speak other language at home 2,379 43.4% Speak English very well3,097 56.6% Speak English less than very well
White (Caucasian) - Speak only English Native:
91.4% (27,843)Foreign-born:
17.6% (807)
White (Caucasian) - Speak another language Native:
9.4% (2,852)Foreign-born:
82.7% (3,800)
Black or African American - Speak only English Native:
96.4% (3,754)Foreign-born:
3.3% (7)
Black or African American - Speak another language Native:
3.6% (141)Foreign-born:
88.7% (180)
American Indian / Alaska Native - Speak only English Native:
14.3% (25)Foreign-born:
5.9% (7)
American Indian / Alaska Native - Speak another language Native:
92.0% (163)Foreign-born:
92.7% (104)
Asian - Speak only English Native:
43.9% (115)Foreign-born:
15.4% (169)
Asian - Speak another language Native:
56.0% (146)Foreign-born:
84.0% (925)
Other race - Speak only English Native:
38.5% (1,142)Foreign-born:
2.5% (41)
Other race - Speak another language Native:
62.6% (1,857)Foreign-born:
97.7% (1,569)
Two or more races - Speak only English Native:
61.2% (2,805)Foreign-born:
12.7% (105)
Two or more races - Speak another language Native:
38.1% (1,747)Foreign-born:
87.3% (727)
White alone - Speak only English Native:
90.5% (26,667)Foreign-born:
15.7% (795)
White alone - Speak another language Native:
9.6% (2,823)Foreign-born:
84.2% (4,262)
Hispanic or Latino - Speak only English Native:
47.1% (3,864)Foreign-born:
6.6% (182)
Hispanic or Latino - Speak another language Native:
53.8% (4,406)Foreign-born:
93.1% (2,559)
Foreign-born residents in Oak Lawn 9,407 residents are foreign born (5.5% Europe , 5.3% Asia , 5.0% Latin America ).
This city:
16.7%Illinois:
14.1%
Marital status for residents in Oak Lawn Marital status - White (Caucasian) population 15 years and over
Males 33.7% Never married52.9% Now married0.5% Separated4.7% Widowed8.1% DivorcedFemales 28.1% Never married48.7% Now married1.7% Separated11.8% Widowed9.7% DivorcedWomen who gave birth in the past 12 months Now married:
74.0% (316)Unmarried:
26.0% (111)
Women who did not give birth in the past 12 months Now married:
46.0% (3,106)Unmarried:
54.0% (3,651)
Marital status - Black or African American population 15 years and over
Males 44.2% Never married30.2% Now married3.7% Separated3.4% Widowed18.4% DivorcedFemales 50.8% Never married22.4% Now married1.8% Separated15.6% Widowed9.4% DivorcedWomen who gave birth in the past 12 months Now married:
63.6% (7)Unmarried:
36.4% (4)
Women who did not give birth in the past 12 months Now married:
30.3% (375)Unmarried:
69.7% (862)
Marital status - American Indian / Alaska Native population 15 years and over
Males 13.2% Never married71.1% Now married15.8% Separated0.0% Widowed0.0% DivorcedFemales 50.4% Never married38.7% Now married0.0% Separated10.9% Widowed0.0% DivorcedWomen who did not give birth in the past 12 months Now married:
6.2% (7)Unmarried:
93.8% (108)
Marital status - Asian population 15 years and over
Males 20.7% Never married77.7% Now married0.0% Separated0.0% Widowed1.6% DivorcedFemales 18.0% Never married75.3% Now married0.0% Separated2.8% Widowed3.9% DivorcedWomen who gave birth in the past 12 months Now married:
93.5% (73)Unmarried:
6.5% (5)
Women who did not give birth in the past 12 months Now married:
66.1% (238)Unmarried:
33.9% (122)
Marital status - Other race population 15 years and over
Males 46.8% Never married49.9% Now married1.3% Separated0.0% Widowed2.0% DivorcedFemales 45.8% Never married47.0% Now married0.0% Separated2.9% Widowed4.3% DivorcedWomen who gave birth in the past 12 months Now married:
100.0% (56)Unmarried:
0.0% (0)
Women who did not give birth in the past 12 months Now married:
38.7% (529)Unmarried:
61.3% (837)
Marital status - Two or more races population 15 years and over
Males 48.9% Never married44.3% Now married0.0% Separated0.5% Widowed6.3% DivorcedFemales 38.3% Never married34.2% Now married2.5% Separated16.4% Widowed8.6% DivorcedWomen who gave birth in the past 12 months Now married:
94.8% (128)Unmarried:
5.2% (7)
Women who did not give birth in the past 12 months Now married:
28.5% (348)Unmarried:
71.5% (874)
Marital status - White alone, not Hispanic / Latino population 15 years and over
Males 32.9% Never married53.5% Now married0.5% Separated4.8% Widowed8.3% DivorcedFemales 26.8% Never married49.3% Now married1.6% Separated12.5% Widowed9.8% DivorcedWomen who gave birth in the past 12 months Now married:
67.9% (264)Unmarried:
32.1% (125)
Women who did not give birth in the past 12 months Now married:
47.1% (3,042)Unmarried:
52.9% (3,422)
Marital status - Hispanic or Latino population 15 years and over
Males 43.8% Never married48.3% Now married1.0% Separated1.6% Widowed5.4% DivorcedFemales 44.1% Never married44.1% Now married1.8% Separated3.1% Widowed7.0% DivorcedWomen who gave birth in the past 12 months Now married:
97.9% (230)Unmarried:
2.1% (5)
Women who did not give birth in the past 12 months Now married:
37.0% (1,187)Unmarried:
63.0% (2,019)
Ancestries in Oak Lawn
3,947 13.1% Irish3,777 12.6% Polish1,382 4.6% German1,295 4.3% Italian1,152 3.8% American1,061 3.5% Palestinian890 3.0% Arab612 2.0% Lithuanian367 1.2% Greek353 1.2% Syrian303 1.0% English294 1.0% Jordanian192 0.6% Croatian187 0.6% Dutch167 0.6% Nigerian163 0.5% Swedish117 0.4% Norwegian105 0.3% European100 0.3% Ukrainian95 0.3% Albanian88 0.3% Jamaican87 0.3% Egyptian87 0.3% Eastern European75 0.2% Romanian68 0.2% Haitian63 0.2% Austrian63 0.2% Czech50 0.2% African49 0.2% Russian45 0.1% Slovak42 0.1% Scotch-Irish32 0.1% Czechoslovakian26 0.09% Yugoslavian24 0.08% Hungarian22 0.07% Moroccan21 0.07% Bulgarian20 0.07% French16 0.05% Portuguese14 0.05% Macedonian12 0.04% Scottish10 0.03% French Canadian10 0.03% Serbian9 0.03% Swiss7 0.02% Slavic6 0.02% British6 0.02% Canadian3 0.01% Danish2 0.01% Armenian
Geographical mobility in Oak Lawn Same house 1 year ago 34,408 94.5% White (Caucasian)3,847 86.3% Black or African American258 88.2% American Indian / Alaska Native1,202 84.8% Asian15 100.0% Native Hawaiian / Pacific Islander4,188 87.2% Other race5,029 87.2% Two or more races33,973 95.0% White alone, not Hispanic / Latino10,565 89.9% Hispanic or LatinoMoved within same county 1,341 3.7% White / Caucasian481 10.8% Black or African American36 12.4% American Indian / Alaska Native211 14.9% Asian542 11.3% Other race594 10.3% Two or more races1,272 3.6% White alone, not Hispanic / Latino1,020 8.7% Hispanic or LatinoMoved within same state 74 0.2% White / Caucasian74 1.7% Black or African American10 0.2% Other race54 0.9% Two or more races49 0.1% White alone, not Hispanic / Latino48 0.4% Hispanic or LatinoMoved from different state 134 0.4% White / Caucasian31 0.7% Black or African American1 0.1% Asian23 0.4% Two or more races105 0.3% White alone, not Hispanic / Latino40 0.3% Hispanic or LatinoMoved from abroad 120 0.3% White131 0.4% White alone, not Hispanic / Latino
Children Nativity (place of birth) in Oak Lawn
Children under 6 years - Living with two parents Both parents native 1,546 100.0% NativeBoth parents foreign-born 527 97.9% Native11 2.1% Foreign-bornOne native, one foreign-born parent 609 100.0% NativeChildren under 6 years - Living with one parent Native parent 733 100.0% NativeForeign-born parent 79 67.9% Native38 32.1% Foreign-bornChildren 6 to 17 years - Living with two parents Both parents native 3,804 100.0% NativeBoth parents foreign-born 776 69.5% Native341 30.5% Foreign-bornOne native, one foreign-born parent 953 98.3% Native17 1.7% Foreign-bornChildren 6 to 17 years - Living with one parent Native parent 1,536 100.0% NativeForeign-born parent 455 50.4% Native447 49.6% Foreign-born
Grandparents responsible for own grandchildren in Oak Lawn
Grandparents (30 to 59 years) White / Caucasian 161 55.7% Responsible for grandchildren128 44.3% Not responsible for grandchildrenBlack or African American 34 47.0% Responsible for grandchildren38 53.0% Not responsible for grandchildrenAsian 52 100.0% Not responsible for grandchildrenTwo or more races 17 100.0% Not responsible for grandchildrenWhite alone, not Hispanic / Latino 107 49.5% Responsible for grandchildren110 50.5% Not responsible for grandchildrenHispanic or Latino 133 95.9% Responsible for grandchildren6 4.1% Not responsible for grandchildrenGrandparents (60 years and over) White / Caucasian 201 28.6% Responsible for grandchildren501 71.4% Not responsible for grandchildrenBlack or African American 23 31.2% Responsible for grandchildren51 68.8% Not responsible for grandchildrenAsian 14 100.0% Not responsible for grandchildrenTwo or more races 17 35.4% Responsible for grandchildren31 64.6% Not responsible for grandchildrenWhite alone, not Hispanic / Latino 197 26.3% Responsible for grandchildren554 73.7% Not responsible for grandchildrenHispanic or Latino 66 38.4% Responsible for grandchildren105 61.6% Not responsible for grandchildren