Races in Norwood, Massachusetts (MA) Detailed Stats
Data:
Races - White alone (%)
Races - White alone (% change since 2000)
Races - Black alone (%)
Races - Black alone (% change since 2000)
Races - American Indian alone (%)
Races - American Indian alone (% change since 2000)
Races - Asian alone (%)
Races - Asian alone (% change since 2000)
Races - Hispanic (%)
Races - Hispanic (% change since 2000)
Races - Native Hawaiian and Other Pacific Islander alone (%)
Races - Native Hawaiian and Other Pacific Islander alone (% change since 2000)
Races - Two or more races(%)
Races - Two or more races(% change since 2000)
Races - Other race alone (%)
Races - Other race alone (% change since 2000)
Racial diversity
Place of birth - Born in state of residence (%)
Place of birth - Born in state of residence (%) - White
Place of birth - Born in state of residence (%) - Black or African American
Place of birth - Born in state of residence (%) - Asian
Place of birth - Born in state of residence (%) - Hispanic or Latino
Place of birth - Born in state of residence (%) - American Indian and Alaska Native
Place of birth - Born in state of residence (%) - Multirace
Place of birth - Born in state of residence (%) - Other Race
Place of birth - Born in other state (%)
Place of birth - Born in other state (%) - White
Place of birth - Born in other state (%) - Black or African American
Place of birth - Born in other state (%) - Asian
Place of birth - Born in other state (%) - Hispanic or Latino
Place of birth - Born in other state (%) - American Indian and Alaska Native
Place of birth - Born in other state (%) - Multirace
Place of birth - Born in other state (%) - Other Race
Place of birth - Native, outside of US (%)
Place of birth - Native, outside of US (%) - White
Place of birth - Native, outside of US (%) - Black or African American
Place of birth - Native, outside of US (%) - Asian
Place of birth - Native, outside of US (%) - Hispanic or Latino
Place of birth - Native, outside of US (%) - American Indian and Alaska Native
Place of birth - Native, outside of US (%) - Multirace
Place of birth - Native, outside of US (%) - Other Race
Place of birth - Foreign born (%)
Place of birth - Foreign born (%) - White
Place of birth - Foreign born (%) - Black or African American
Place of birth - Foreign born (%) - Asian
Place of birth - Foreign born (%) - Hispanic or Latino
Place of birth - Foreign born (%) - American Indian and Alaska Native
Place of birth - Foreign born (%) - Multirace
Place of birth - Foreign born (%) - Other Race
Residents speaking English at home (%)
Residents speaking English at home - Born in the United States (%)
Residents speaking English at home - Native, born elsewhere (%)
Residents speaking English at home - Foreign born (%)
Residents speaking Spanish at home (%)
Residents speaking Spanish at home - Born in the United States (%)
Residents speaking Spanish at home - Native, born elsewhere (%)
Residents speaking Spanish at home - Foreign born (%)
Residents speaking other language at home (%)
Residents speaking other language at home - Born in the United States (%)
Residents speaking other language at home - Native, born elsewhere (%)
Residents speaking other language at home - Foreign born (%)
Marital status - Never married (%)
Marital status - Now married (%)
Marital status - Separated (%)
Marital status - Widowed (%)
Marital status - Divorced (%)
Ancestries Reported - Arab (%)
Ancestries Reported - Czech (%)
Ancestries Reported - Danish (%)
Ancestries Reported - Dutch (%)
Ancestries Reported - English (%)
Ancestries Reported - French (%)
Ancestries Reported - French Canadian (%)
Ancestries Reported - German (%)
Ancestries Reported - Greek (%)
Ancestries Reported - Hungarian (%)
Ancestries Reported - Irish (%)
Ancestries Reported - Italian (%)
Ancestries Reported - Lithuanian (%)
Ancestries Reported - Norwegian (%)
Ancestries Reported - Polish (%)
Ancestries Reported - Portuguese (%)
Ancestries Reported - Russian (%)
Ancestries Reported - Scotch-Irish (%)
Ancestries Reported - Scottish (%)
Ancestries Reported - Slovak (%)
Ancestries Reported - Subsaharan African (%)
Ancestries Reported - Swedish (%)
Ancestries Reported - Swiss (%)
Ancestries Reported - Ukrainian (%)
Ancestries Reported - United States (%)
Ancestries Reported - Welsh (%)
Ancestries Reported - West Indian (%)
Ancestries Reported - Other (%)
Geographical mobility - Same house 1 year ago (%)
Geographical mobility - Same house 1 year ago (%) - White
Geographical mobility - Same house 1 year ago (%) - Black or African American
Geographical mobility - Same house 1 year ago (%) - Asian
Geographical mobility - Same house 1 year ago (%) - Hispanic or Latino
Geographical mobility - Same house 1 year ago (%) - American Indian and Alaska Native
Geographical mobility - Same house 1 year ago (%) - Multirace
Geographical mobility - Same house 1 year ago (%) - Other Race
Geographical mobility - Moved within same county (%)
Geographical mobility - Moved within same county (%) - White
Geographical mobility - Moved within same county (%) - Black or African American
Geographical mobility - Moved within same county (%) - Asian
Geographical mobility - Moved within same county (%) - Hispanic or Latino
Geographical mobility - Moved within same county (%) - American Indian and Alaska Native
Geographical mobility - Moved within same county (%) - Multirace
Geographical mobility - Moved within same county (%) - Other Race
Geographical mobility - Moved from different county within same state (%)
Geographical mobility - Moved from different county within same state (%) - White
Geographical mobility - Moved from different county within same state (%) - Black or African American
Geographical mobility - Moved from different county within same state (%) - Asian
Geographical mobility - Moved from different county within same state (%) - Hispanic or Latino
Geographical mobility - Moved from different county within same state (%) - American Indian and Alaska Native
Geographical mobility - Moved from different county within same state (%) - Multirace
Geographical mobility - Moved from different county within same state (%) - Other Race
Geographical mobility - Moved from different state (%)
Geographical mobility - Moved from different state (%) - White
Geographical mobility - Moved from different state (%) - Black or African American
Geographical mobility - Moved from different state (%) - Asian
Geographical mobility - Moved from different state (%) - Hispanic or Latino
Geographical mobility - Moved from different state (%) - American Indian and Alaska Native
Geographical mobility - Moved from different state (%) - Multirace
Geographical mobility - Moved from different state (%) - Other Race
Geographical mobility - Moved from abroad (%)
Geographical mobility - Moved from abroad (%) - White
Geographical mobility - Moved from abroad (%) - Black or African American
Geographical mobility - Moved from abroad (%) - Asian
Geographical mobility - Moved from abroad (%) - Hispanic or Latino
Geographical mobility - Moved from abroad (%) - American Indian and Alaska Native
Geographical mobility - Moved from abroad (%) - Multirace
Geographical mobility - Moved from abroad (%) - Other Race
Place of birth for the foreign-born population - Ireland (%)
Place of birth for the foreign-born population - Denmark (%)
Place of birth for the foreign-born population - Norway (%)
Place of birth for the foreign-born population - Sweden (%)
Place of birth for the foreign-born population - United Kingdom (%)
Place of birth for the foreign-born population - England (%)
Place of birth for the foreign-born population - Scotland (%)
Place of birth for the foreign-born population - Other Northern Europe (%)
Place of birth for the foreign-born population - Austria (%)
Place of birth for the foreign-born population - Belgium (%)
Place of birth for the foreign-born population - France (%)
Place of birth for the foreign-born population - Germany (%)
Place of birth for the foreign-born population - Netherlands (%)
Place of birth for the foreign-born population - Switzerland (%)
Place of birth for the foreign-born population - Other Western Europe (%)
Place of birth for the foreign-born population - Greece (%)
Place of birth for the foreign-born population - Italy (%)
Place of birth for the foreign-born population - Portugal (%)
Place of birth for the foreign-born population - Spain (%)
Place of birth for the foreign-born population - Other Southern Europe (%)
Place of birth for the foreign-born population - Albania (%)
Place of birth for the foreign-born population - Belarus (%)
Place of birth for the foreign-born population - Bosnia and Herzegovina (%)
Place of birth for the foreign-born population - Bulgaria (%)
Place of birth for the foreign-born population - Croatia (%)
Place of birth for the foreign-born population - Czechoslovakia (%)
Place of birth for the foreign-born population - Hungary (%)
Place of birth for the foreign-born population - Latvia (%)
Place of birth for the foreign-born population - Lithuania (%)
Place of birth for the foreign-born population - North Macedonia (Macedonia) (%)
Place of birth for the foreign-born population - Moldova (%)
Place of birth for the foreign-born population - Poland (%)
Place of birth for the foreign-born population - Romania (%)
Place of birth for the foreign-born population - Russia (%)
Place of birth for the foreign-born population - Serbia (%)
Place of birth for the foreign-born population - Ukraine (%)
Place of birth for the foreign-born population - Other Eastern Europe (%)
Place of birth for the foreign-born population - China (%)
Place of birth for the foreign-born population - Hong Kong (%)
Place of birth for the foreign-born population - Taiwan (%)
Place of birth for the foreign-born population - Japan (%)
Place of birth for the foreign-born population - Korea (%)
Place of birth for the foreign-born population - Other Eastern Asia (%)
Place of birth for the foreign-born population - Afghanistan (%)
Place of birth for the foreign-born population - Bangladesh (%)
Place of birth for the foreign-born population - India (%)
Place of birth for the foreign-born population - Iran (%)
Place of birth for the foreign-born population - Kazakhstan (%)
Place of birth for the foreign-born population - Nepal (%)
Place of birth for the foreign-born population - Pakistan (%)
Place of birth for the foreign-born population - Sri Lanka (%)
Place of birth for the foreign-born population - Uzbekistan (%)
Place of birth for the foreign-born population - Other South Central Asia (%)
Place of birth for the foreign-born population - Burma (%)
Place of birth for the foreign-born population - Cambodia (%)
Place of birth for the foreign-born population - Indonesia (%)
Place of birth for the foreign-born population - Laos (%)
Place of birth for the foreign-born population - Malaysia (%)
Place of birth for the foreign-born population - Philippines (%)
Place of birth for the foreign-born population - Singapore (%)
Place of birth for the foreign-born population - Thailand (%)
Place of birth for the foreign-born population - Vietnam (%)
Place of birth for the foreign-born population - Other South Eastern Asia (%)
Place of birth for the foreign-born population - Armenia (%)
Place of birth for the foreign-born population - Iraq (%)
Place of birth for the foreign-born population - Israel (%)
Place of birth for the foreign-born population - Jordan (%)
Place of birth for the foreign-born population - Kuwait (%)
Place of birth for the foreign-born population - Lebanon (%)
Place of birth for the foreign-born population - Saudi Arabia (%)
Place of birth for the foreign-born population - Syria (%)
Place of birth for the foreign-born population - Turkey (%)
Place of birth for the foreign-born population - Yemen (%)
Place of birth for the foreign-born population - Other Western Asia (%)
Place of birth for the foreign-born population - Eritrea (%)
Place of birth for the foreign-born population - Ethiopia (%)
Place of birth for the foreign-born population - Kenya (%)
Place of birth for the foreign-born population - Somalia (%)
Place of birth for the foreign-born population - Uganda (%)
Place of birth for the foreign-born population - Zimbabwe (%)
Place of birth for the foreign-born population - Other Eastern Africa (%)
Place of birth for the foreign-born population - Cameroon (%)
Place of birth for the foreign-born population - Congo (%)
Place of birth for the foreign-born population - Democratic Republic of Congo (Zaire) (%)
Place of birth for the foreign-born population - Other Middle Africa (%)
Place of birth for the foreign-born population - Egypt (%)
Place of birth for the foreign-born population - Morocco (%)
Place of birth for the foreign-born population - Sudan (%)
Place of birth for the foreign-born population - Other Northern Africa (%)
Place of birth for the foreign-born population - South Africa (%)
Place of birth for the foreign-born population - Other Southern Africa (%)
Place of birth for the foreign-born population - Cabo Verde (%)
Place of birth for the foreign-born population - Ghana (%)
Place of birth for the foreign-born population - Liberia (%)
Place of birth for the foreign-born population - Nigeria (%)
Place of birth for the foreign-born population - Senegal (%)
Place of birth for the foreign-born population - Sierra Leone (%)
Place of birth for the foreign-born population - Other Western Africa (%)
Place of birth for the foreign-born population - Australia (%)
Place of birth for the foreign-born population - New Zealand (%)
Place of birth for the foreign-born population - Fiji (%)
Place of birth for the foreign-born population - Micronesia (%)
Place of birth for the foreign-born population - Bahamas (%)
Place of birth for the foreign-born population - Barbados (%)
Place of birth for the foreign-born population - Cuba (%)
Place of birth for the foreign-born population - Dominica (%)
Place of birth for the foreign-born population - Dominican Republic (%)
Place of birth for the foreign-born population - Grenada (%)
Place of birth for the foreign-born population - Haiti (%)
Place of birth for the foreign-born population - Jamaica (%)
Place of birth for the foreign-born population - St. Vincent and the Grenadines (%)
Place of birth for the foreign-born population - Trinidad and Tobago (%)
Place of birth for the foreign-born population - West Indies (%)
Place of birth for the foreign-born population - Other Caribbean (%)
Place of birth for the foreign-born population - Belize (%)
Place of birth for the foreign-born population - Costa Rica (%)
Place of birth for the foreign-born population - El Salvador (%)
Place of birth for the foreign-born population - Guatemala (%)
Place of birth for the foreign-born population - Honduras (%)
Place of birth for the foreign-born population - Mexico (%)
Place of birth for the foreign-born population - Nicaragua (%)
Place of birth for the foreign-born population - Panama (%)
Place of birth for the foreign-born population - Other Central America (%)
Place of birth for the foreign-born population - Argentina (%)
Place of birth for the foreign-born population - Bolivia (%)
Place of birth for the foreign-born population - Brazil (%)
Place of birth for the foreign-born population - Chile (%)
Place of birth for the foreign-born population - Colombia (%)
Place of birth for the foreign-born population - Ecuador (%)
Place of birth for the foreign-born population - Guyana (%)
Place of birth for the foreign-born population - Peru (%)
Place of birth for the foreign-born population - Uruguay (%)
Place of birth for the foreign-born population - Venezuela (%)
Place of birth for the foreign-born population - Other South America (%)
Place of birth for the foreign-born population - Canada (%)
Place of birth for the foreign-born population - Other Northern America (%)
Place of birth for the foreign-born population - Other (%)
Latest news about races in Norwood, MA collected exclusively by city-data.com from local newspapers, TV, and radio stations
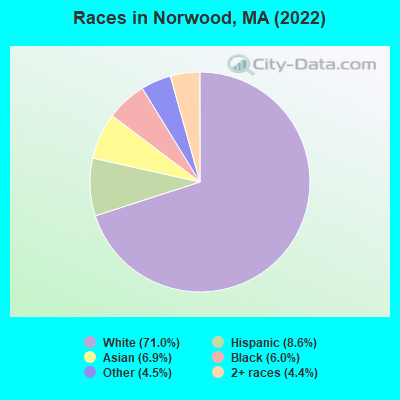
According to 2022 data, the most numerous races in Norwood, MA are White alone (22,360 residents), Hispanic (2,708 residents), and Asian alone (2,161 residents). 73.4% of Norwood residents speak English at home. 21.0% of Norwood, MA residents are foreign-born (7.6% born in Latin America, 6.8% born in Asia, 4.6% born in Europe), which is 14.2% greater than the foreign-born rate of 18.0% across the entire state of Massachusetts.
Race distribution in Norwood
2000 2022
5,198,359 81.9% White alone 428,729 6.8% Hispanic 318,329 5.0% Black alone 236,786 3.7% Asian alone 110,338 1.7% Two or more races 43,586 0.7% Other race alone 11,264 0.2% American Indian alone 1,706 0.03% Native Hawaiian and Other
4,676,627 67.0% White alone 911,038 13.0% Hispanic 501,463 7.2% Asian alone 459,740 6.6% Black alone 341,889 4.9% Two or more races 84,403 1.2% Other race alone 5,838 0.08% American Indian alone 976 0.01% Native Hawaiian and Other
Income and house value in Norwood Median household income in 2022 $100,182 White non-Hispanic householders$98,593 Black householders$124,528 Asian householders$46,172 Some other race householders$67,437 Two or more races householders$54,143 Hispanic or Latino race householdersMedian 2022 house value $629,772 White Non-Hispanic householders $648,109 Asian householders$787,932 Some other race householders$493,388 Two or more races householders$547,827 Hispanic or Latino householders
Median age by race in Norwood
45.2 Median age for White residents42.4 47.2 29.1 Median age for Black or African American residents27.4 39.7 -655,238,094.6 Median age for American Indian / Alaska Native residents-649,474,688.9 -657,223,795.4 34.6 Median age for Asian residents35.6 33.9 -514,227,641.8 Median age for Native Hawaiian / Pacific Islander residents-513,131,312.6 -508,717,948.2 29.5 Median age for Other race residents36.0 15.9 33.4 Median age for Two or more races residents44.3 29.7 45.7 Median age for White alone residents43.1 48.1 29.5 Median age for Hispanic or Latino residents30.2 29.0
Owner/renter occupied households by race in Norwood
House owners and renters - White residents 6,005 58.1% Owner occupied4,326 41.9% Renter occupiedHouse owners and renters - Black or African American residents 160 27.2% Owner occupied429 72.8% Renter occupiedHouse owners and renters - Asian residents 292 36.5% Owner occupied510 63.5% Renter occupiedHouse owners and renters - Other race residents 60 7.2% Owner occupied770 92.8% Renter occupiedHouse owners and renters - Two or more races residents 253 33.7% Owner occupied499 66.3% Renter occupiedHouse owners and renters - White alone residents 5,958 59.1% Owner occupied4,115 40.9% Renter occupiedHouse owners and renters - Hispanic or Latino residents 239 31.2% Owner occupied526 68.8% Renter occupied
Language usage in Norwood
English speakers - Total 73.4% of residents of Norwood speak English at home.
7.6% of residents speak Spanish at home 1,330 59.0% Speak English very well923 41.0% Speak English less than very well19.7% of residents speak other language at home 3,103 53.0% Speak English very well2,756 47.0% Speak English less than very well
English speakers - Born in the United States 90.4% of residents of Norwood speak English at home.
5.7% of residents speak Spanish at home 219 90.9% Speak English very well22 9.1% Speak English less than very well4.1% of residents speak other language at home 174 100.0% Speak English very well
English speakers - Native, born elsewhere 51.3% of residents of Norwood speak English at home.
33.0% of residents speak Spanish at home 86 73.5% Speak English very well31 26.5% Speak English less than very well15.8% of residents speak other language at home 49 87.5% Speak English very well7 12.5% Speak English less than very well
English speakers - Foreign-born 13.7% of residents of Norwood speak English at home.
16.8% of residents speak Spanish at home 458 41.6% Speak English very well644 58.4% Speak English less than very well70.9% of residents speak other language at home 2,255 48.4% Speak English very well2,405 51.6% Speak English less than very well
White (Caucasian) - Speak only English Native:
94.5% (18,761)Foreign-born:
17.4% (383)
White (Caucasian) - Speak another language Native:
5.5% (1,091)Foreign-born:
82.9% (1,825)
Black or African American - Speak only English Native:
81.7% (824)Foreign-born:
29.8% (271)
Black or African American - Speak another language Native:
18.3% (185)Foreign-born:
66.7% (608)
Asian - Speak only English Native:
33.1% (95)Foreign-born:
6.7% (106)
Asian - Speak another language Native:
66.3% (189)Foreign-born:
92.5% (1,461)
Other race - Speak only English Native:
57.6% (499)Foreign-born:
4.9% (56)
Other race - Speak another language Native:
43.1% (373)Foreign-born:
94.2% (1,086)
Two or more races - Speak only English Native:
64.1% (705)Foreign-born:
0.9% (9)
Two or more races - Speak another language Native:
37.4% (411)Foreign-born:
100.0% (1,023)
White alone - Speak only English Native:
95.3% (18,487)Foreign-born:
17.7% (359)
White alone - Speak another language Native:
4.8% (933)Foreign-born:
83.5% (1,688)
Hispanic or Latino - Speak only English Native:
38.1% (531)Foreign-born:
3.1% (35)
Hispanic or Latino - Speak another language Native:
64.0% (892)Foreign-born:
98.3% (1,091)
Foreign-born residents in Norwood 6,605 residents are foreign born (7.6% Latin America , 6.8% Asia , 4.6% Europe ).
This city:
21.0%Massachusetts:
17.6%
Marital status for residents in Norwood Marital status - White (Caucasian) population 15 years and over
Males 34.1% Never married52.2% Now married3.1% Separated2.9% Widowed7.7% DivorcedFemales 31.0% Never married47.1% Now married1.6% Separated10.8% Widowed9.5% DivorcedWomen who gave birth in the past 12 months Now married:
100.0% (204)Unmarried:
0.0% (0)
Women who did not give birth in the past 12 months Now married:
44.5% (2,136)Unmarried:
55.5% (2,659)
Marital status - Black or African American population 15 years and over
Males 51.5% Never married24.5% Now married0.0% Separated0.1% Widowed23.8% DivorcedFemales 55.8% Never married16.1% Now married2.1% Separated2.7% Widowed23.3% DivorcedWomen who did not give birth in the past 12 months Now married:
15.2% (82)Unmarried:
84.8% (458)
Marital status - Asian population 15 years and over
Males 21.2% Never married74.5% Now married0.0% Separated1.3% Widowed3.0% DivorcedFemales 12.3% Never married85.4% Now married1.3% Separated0.0% Widowed1.0% DivorcedWomen who gave birth in the past 12 months Now married:
100.0% (47)Unmarried:
0.0% (0)
Women who did not give birth in the past 12 months Now married:
87.2% (539)Unmarried:
12.8% (79)
Marital status - Other race population 15 years and over
Males 34.1% Never married51.8% Now married0.0% Separated4.2% Widowed9.9% DivorcedFemales 30.2% Never married49.0% Now married12.5% Separated0.0% Widowed8.3% DivorcedWomen who gave birth in the past 12 months Now married:
100.0% (13)Unmarried:
0.0% (0)
Women who did not give birth in the past 12 months Now married:
59.0% (394)Unmarried:
41.0% (274)
Marital status - Two or more races population 15 years and over
Males 32.1% Never married52.5% Now married4.7% Separated0.0% Widowed10.8% DivorcedFemales 48.1% Never married25.7% Now married9.7% Separated3.8% Widowed12.7% DivorcedWomen who did not give birth in the past 12 months Now married:
36.6% (197)Unmarried:
63.4% (341)
Marital status - White alone, not Hispanic / Latino population 15 years and over
Males 33.4% Never married54.0% Now married3.3% Separated3.0% Widowed6.4% DivorcedFemales 30.4% Never married47.5% Now married1.5% Separated11.2% Widowed9.4% DivorcedWomen who gave birth in the past 12 months Now married:
100.0% (195)Unmarried:
0.0% (0)
Women who did not give birth in the past 12 months Now married:
45.3% (2,088)Unmarried:
54.7% (2,519)
Marital status - Hispanic or Latino population 15 years and over
Males 51.4% Never married27.0% Now married0.0% Separated2.2% Widowed19.4% DivorcedFemales 48.5% Never married29.4% Now married13.8% Separated0.0% Widowed8.3% DivorcedWomen who gave birth in the past 12 months Now married:
100.0% (13)Unmarried:
0.0% (0)
Women who did not give birth in the past 12 months Now married:
36.8% (291)Unmarried:
63.2% (501)
Ancestries in Norwood
3,507 21.5% Irish1,325 8.1% Italian1,258 7.7% Brazilian671 4.1% American520 3.2% Greek510 3.1% Haitian367 2.3% Lebanese323 2.0% English308 1.9% Jamaican303 1.9% European302 1.9% German287 1.8% Albanian214 1.3% Russian202 1.2% French Canadian165 1.0% Polish162 1.0% Portuguese160 1.0% French159 1.0% Scottish138 0.8% Lithuanian137 0.8% Syrian134 0.8% Nigerian128 0.8% Cape Verdean95 0.6% Scotch-Irish86 0.5% Armenian75 0.5% Canadian66 0.4% Finnish62 0.4% Eastern European50 0.3% Liberian46 0.3% Serbian39 0.2% Ukrainian31 0.2% Austrian27 0.2% Swedish23 0.1% Norwegian20 0.1% Egyptian19 0.1% Israeli19 0.1% Dutch16 0.10% British15 0.09% Northern European15 0.09% West Indian12 0.07% Danish8 0.05% Welsh7 0.04% Latvian3 0.02% Barbadian2 0.01% British West Indian
Geographical mobility in Norwood Same house 1 year ago 19,637 85.8% White (Caucasian)1,965 92.5% Black or African American8 100.0% American Indian / Alaska Native1,793 85.5% Asian1,430 86.5% Other race1,965 84.4% Two or more races19,245 86.6% White alone, not Hispanic / Latino1,952 73.3% Hispanic or LatinoMoved within same county 1,188 5.2% White / Caucasian128 6.0% Black or African American76 3.6% Asian1 0.1% Other race305 13.1% Two or more races1,093 4.9% White alone, not Hispanic / Latino380 14.3% Hispanic or LatinoMoved within same state 1,431 6.3% White / Caucasian36 1.7% Black or African American17 0.8% Asian185 11.2% Other race38 1.6% Two or more races1,277 5.7% White alone, not Hispanic / Latino247 9.3% Hispanic or LatinoMoved from different state 367 1.6% White / Caucasian17 0.8% Black or African American123 5.9% Asian48 2.9% Other race28 1.2% Two or more races338 1.5% White alone, not Hispanic / Latino50 1.9% Hispanic or LatinoMoved from abroad 197 0.9% White107 5.1% Asian16 0.7% Two or more races213 1.0% White alone, not Hispanic / Latino
Children Nativity (place of birth) in Norwood
Children under 6 years - Living with two parents Both parents native 1,058 99.5% Native5 0.5% Foreign-bornBoth parents foreign-born 301 78.0% Native85 22.0% Foreign-bornOne native, one foreign-born parent 220 100.0% NativeChildren under 6 years - Living with one parent Native parent 318 100.0% NativeForeign-born parent 134 79.9% Native34 20.1% Foreign-bornChildren 6 to 17 years - Living with two parents Both parents native 1,938 99.5% Native9 0.5% Foreign-bornBoth parents foreign-born 492 81.3% Native113 18.7% Foreign-bornOne native, one foreign-born parent 107 100.0% NativeChildren 6 to 17 years - Living with one parent Native parent 567 100.0% NativeForeign-born parent 525 56.8% Native399 43.2% Foreign-born
Grandparents responsible for own grandchildren in Norwood
Grandparents (30 to 59 years) White / Caucasian 21 100.0% Not responsible for grandchildrenBlack or African American 17 100.0% Not responsible for grandchildrenAsian 7 42.4% Responsible for grandchildren10 57.6% Not responsible for grandchildrenTwo or more races 23 100.0% Not responsible for grandchildrenWhite alone, not Hispanic / Latino 13 100.0% Not responsible for grandchildrenHispanic or Latino 38 100.0% Not responsible for grandchildrenGrandparents (60 years and over) White / Caucasian 8 4.2% Responsible for grandchildren190 95.8% Not responsible for grandchildrenBlack or African American 29 100.0% Responsible for grandchildrenAsian 31 100.0% Not responsible for grandchildrenTwo or more races 29 100.0% Not responsible for grandchildrenWhite alone, not Hispanic / Latino 8 4.2% Responsible for grandchildren191 95.8% Not responsible for grandchildrenHispanic or Latino 24 100.0% Not responsible for grandchildren