Races in Norton, Ohio (OH) Detailed Stats
Ancestries, Foreign-born residents, place of birth
Settings
X


Recent posts about races in Norton, Ohio on our local forum with over 2,400,000 registered users:
 | What are your thoughts on the Norton/Barberton area? (1 reply) |
| Moving to Medina, Norton,Fairlawn area (14 replies) |
| Why do you still live in the Norton, Barberton area? (5 replies) |
| looking to buy a house in or near Akron (7 replies) |
| Young family - Akron area - Copley, Fairlawn, other? (14 replies) |
| Is Downtown Akron safe? (9 replies) |
Latest news about races in Norton, OH collected exclusively by city-data.com from local newspapers, TV, and radio stations
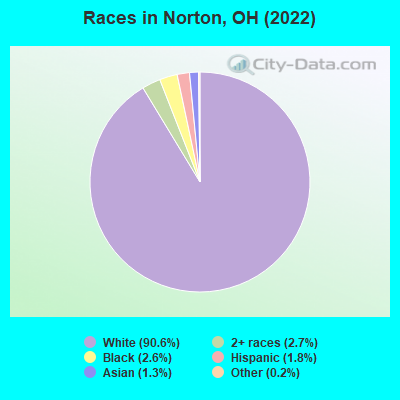
According to 2022 data, the most numerous races in Norton, OH are White alone (10,481 residents), Black alone (303 residents), and Two or more races (318 residents). 96.6% of Norton residents speak English at home. 2.9% of Norton, OH residents are foreign-born (1.3% born in Europe, 1.0% born in Latin America, 0.4% born in Asia), which is 37.3% less than the foreign-born rate of 4.0% across the entire state of Ohio.
Race distribution in Norton
2000
2022

- 11,18597.1%White alone
- 1531.3%Black alone
- 750.7%Two or more races
- 470.4%Hispanic
- 320.3%Asian alone
- 200.2%American Indian alone
- 70.06%Other race alone
- 40.03%Native Hawaiian and Other
Pacific Islander alone

-
- 10,48190.6%White alone
- 3182.7%Two or more races
- 3032.6%Black alone
- 2041.8%Hispanic
- 1551.3%Asian alone
- 250.2%Other race alone
- 10.01%American Indian alone
2000
2022
-
- 9,538,11184.0%White alone
- 1,290,66211.4%Black alone
- 217,1231.9%Hispanic
- 137,7701.2%Two or more races
- 131,6701.2%Asian alone
- 21,9850.2%American Indian alone
- 13,4830.1%Other race alone
- 2,3360.02%Native Hawaiian and Other
Pacific Islander alone

-
- 8,948,79376.1%White alone
- 1,401,40311.9%Black alone
- 529,2914.5%Two or more races
- 517,2324.4%Hispanic
- 293,3872.5%Asian alone
- 52,8050.4%Other race alone
- 9,7850.08%American Indian alone
- 3,3620.03%Native Hawaiian and Other
Pacific Islander alone

Income and house value in Norton
- Median household income in 2022
- $74,696White non-Hispanic householders
- $142,311Black householders
- $88,200Two or more races householders
- Median 2022 house value
- $183,381White Non-Hispanic householders
- $191,192Black or African American householders
- $144,655American Indian or Alaska Native householders
- $111,460Asian householders
- $223,735Two or more races householders
Household income for White non-Hispanic householders

Household income for Black householders

Household income for Asian householders

Household income for Two or more races householders

Household income for Hispanic or Latino race householders

Median age by race in Norton
- 47.1Median age for White residents
- 44.0Males
- 50.7Females
- 45.1Median age for Black or African American residents
- 28.4Males
- 45.2Females
- -502,953,586.0Median age for American Indian / Alaska Native residents
- -668,371,695.8Males
- -390,759,075.5Females
- 37.6Median age for Asian residents
- -749,226,005.4Males
- 36.3Females
- -800,387,596.1Median age for Native Hawaiian / Pacific Islander residents
- -666,666,666.0Males
- -805,394,989.6Females
- 44.8Median age for Other race residents
- 41.6Males
- -668,582,374.8Females
- 29.2Median age for Two or more races residents
- 18.3Males
- 55.4Females
- 47.0Median age for White alone residents
- 43.9Males
- 50.7Females
- 46.3Median age for Hispanic or Latino residents
- 18.4Males
- 52.8Females
Owner/renter occupied households by race in Norton
- House owners and renters - White residents
- 3,83184.6%Owner occupied
- 69615.4%Renter occupied
- House owners and renters - Black or African American residents
- 97100.0%Owner occupied
- House owners and renters - Asian residents
- 93100.0%Owner occupied
- House owners and renters - Other race residents
- 6100.0%Owner occupied
- House owners and renters - Two or more races residents
- 9393.7%Owner occupied
- 66.3%Renter occupied
- House owners and renters - White alone residents
- 3,83484.6%Owner occupied
- 69815.4%Renter occupied
- House owners and renters - Hispanic or Latino residents
- 18100.0%Owner occupied
Language usage in Norton
- English speakers - Total
- 96.6% of residents of Norton speak English at home.
- 1.4% of residents speak Spanish at home
- 13184.0%Speak English very well
- 2516.0%Speak English less than very well
- 1.8% of residents speak other language at home
- 15275.6%Speak English very well
- 4924.4%Speak English less than very well
- English speakers - Born in the United States
- 95.8% of residents of Norton speak English at home.
- 0.4% of residents speak Spanish at home
- 6100.0%Speak English very well
- 2.6% of residents speak other language at home
- 35100.0%Speak English very well
All residents speak only English at home
- English speakers - Foreign-born
- 31.2% of residents of Norton speak English at home.
- 34.1% of residents speak Spanish at home
- 9481.0%Speak English very well
- 2219.0%Speak English less than very well
- 32.1% of residents speak other language at home
- 5954.1%Speak English very well
- 5045.9%Speak English less than very well
White (Caucasian) - Speak only English
| Native: | 99.0% (9,827) |
| Foreign-born: | 43.0% (73) |
White (Caucasian) - Speak another language
| Native: | 1.0% (96) |
| Foreign-born: | 54.6% (93) |
Asian - Speak only English
| Native: | 100.0% (99) |
| Foreign-born: | 43.8% (19) |
Asian - Speak another language
| Native: | 20.2% (20) |
| Foreign-born: | 43.7% (19) |
Other race - Speak only English
| Native: | 97.0% (30) |
| Foreign-born: | 41.7% (17) |
Two or more races - Speak another language
| Native: | 7.5% (27) |
| Foreign-born: | 100.0% (70) |
White alone - Speak only English
| Native: | 98.8% (9,832) |
| Foreign-born: | 43.7% (73) |
White alone - Speak another language
| Native: | 1.1% (113) |
| Foreign-born: | 54.5% (91) |
Hispanic or Latino - Speak only English
| Native: | 69.1% (56) |
| Foreign-born: | 7.4% (9) |
Hispanic or Latino - Speak another language
| Native: | 26.3% (21) |
| Foreign-born: | 92.9% (110) |
Foreign-born residents in Norton
337 residents are foreign born (1.3% Europe, 1.0% Latin America, 0.4% Asia).
| This city: | 2.9% |
| Ohio: | 4.9% |


Marital status for residents in Norton
Marital status - White (Caucasian) population 15 years and over
- Males
- 28.9%Never married
- 55.7%Now married
- 0.0%Separated
- 2.8%Widowed
- 12.7%Divorced
- Females
- 19.0%Never married
- 55.2%Now married
- 0.7%Separated
- 13.2%Widowed
- 11.9%Divorced
Women who gave birth in the past 12 months
| Now married: | 100.0% (33) |
| Unmarried: | 0.0% (0) |
Women who did not give birth in the past 12 months
| Now married: | 54.8% (980) |
| Unmarried: | 45.2% (807) |
Marital status - Black or African American population 15 years and over
- Males
- 44.6%Never married
- 49.0%Now married
- 0.0%Separated
- 0.0%Widowed
- 6.4%Divorced
- Females
- 29.2%Never married
- 61.9%Now married
- 0.0%Separated
- 8.8%Widowed
- 0.0%Divorced
Women who did not give birth in the past 12 months
| Now married: | 38.9% (21) |
| Unmarried: | 61.1% (33) |
Marital status - Asian population 15 years and over
- Males
- 100.0%Never married
- 0.0%Now married
- 0.0%Separated
- 0.0%Widowed
- 0.0%Divorced
- Females
- 90.1%Never married
- 9.9%Now married
- 0.0%Separated
- 0.0%Widowed
- 0.0%Divorced
Women who did not give birth in the past 12 months
| Now married: | 9.9% (11) |
| Unmarried: | 90.1% (99) |
Marital status - Other race population 15 years and over
- Males
- 26.5%Never married
- 52.9%Now married
- 20.6%Separated
- 0.0%Widowed
- 0.0%Divorced
- Females
- 0.0%Never married
- 100.0%Now married
- 0.0%Separated
- 0.0%Widowed
- 0.0%Divorced
Women who did not give birth in the past 12 months
| Now married: | 100.0% (16) |
| Unmarried: | 0.0% (0) |
Marital status - Two or more races population 15 years and over
- Males
- 46.2%Never married
- 40.9%Now married
- 0.0%Separated
- 0.0%Widowed
- 12.9%Divorced
- Females
- 31.3%Never married
- 39.7%Now married
- 0.0%Separated
- 5.6%Widowed
- 23.5%Divorced
Women who did not give birth in the past 12 months
| Now married: | 0.0% (0) |
| Unmarried: | 100.0% (81) |
Marital status - White alone, not Hispanic / Latino population 15 years and over
- Males
- 28.9%Never married
- 55.7%Now married
- 0.0%Separated
- 2.8%Widowed
- 12.7%Divorced
- Females
- 18.8%Never married
- 55.3%Now married
- 0.7%Separated
- 13.3%Widowed
- 11.9%Divorced
Women who gave birth in the past 12 months
| Now married: | 100.0% (33) |
| Unmarried: | 0.0% (0) |
Women who did not give birth in the past 12 months
| Now married: | 55.1% (989) |
| Unmarried: | 44.9% (805) |
Marital status - Hispanic or Latino population 15 years and over
- Males
- 42.9%Never married
- 40.5%Now married
- 16.7%Separated
- 0.0%Widowed
- 0.0%Divorced
- Females
- 8.9%Never married
- 49.5%Now married
- 0.0%Separated
- 1.0%Widowed
- 40.6%Divorced
Women who did not give birth in the past 12 months
| Now married: | 0.0% (0) |
| Unmarried: | 100.0% (17) |
Ancestries in Norton

- 79820.1%German
- 43110.9%Irish
- 3559.0%European
- 2696.8%American
- 2305.8%English
- 1604.0%Serbian
- 1383.5%Italian
- 1253.2%Hungarian
- 1173.0%Polish
- 952.4%Slovak
- 681.7%Scottish
- 601.5%African
- 511.3%Russian
- 411.0%Finnish
- 350.9%Eastern European
- 310.8%Lebanese
- 300.8%Scotch-Irish
- 270.7%Welsh
- 260.7%Carpatho Rusyn
- 180.5%Austrian
- 160.4%French
- 140.4%Slovene
- 130.3%Ukrainian
- 90.2%Scandinavian
- 80.2%Croatian
- 80.2%Czech
- 80.2%Romanian
- 70.2%Dutch
- 70.2%Pennsylvania German
- 70.2%Slavic
- 70.2%Yugoslavian
- 40.1%British
- 40.1%Lithuanian
- 20.05%Greek

Geographical mobility in Norton

- Same house 1 year ago
- 9,51691.1%White (Caucasian)
- 24781.9%Black or African American
- 3100.0%American Indian / Alaska Native
- 15195.8%Asian
- 9100.0%Native Hawaiian / Pacific Islander
- 7298.6%Other race
- 41280.1%Two or more races
- 9,52791.0%White alone, not Hispanic / Latino
- 19397.3%Hispanic or Latino

-
- Moved within same county
- 4434.2%White / Caucasian
- 4013.2%Black or African American
- 10821.0%Two or more races
- 4554.3%White alone, not Hispanic / Latino

-
- Moved within same state
- 3863.7%White / Caucasian
- 82.6%Black or African American
- 3803.6%White alone, not Hispanic / Latino

-
- Moved from different state
- 930.9%White / Caucasian
- 930.9%White alone, not Hispanic / Latino

-
- Moved from abroad
- 100.1%White
- 110.1%White alone, not Hispanic / Latino

Children Nativity (place of birth) in Norton
Place of birth for residents in Norton
![Place of birth for the foreign-born population - Regions]()
- 155Europe
- 127Americas
- 124Eastern Europe
- 118Latin America
- 94South America
- 54Asia
- 24Central America
- 21Northern Europe
- 16South Central Asia
- 15Western Asia
- 12South Eastern Asia
- 10Eastern Asia
- 10China
- 9Western Europe
- 9Northern America

![Place of birth for the foreign-born population - Countries]()
- 84Chile
- 52Russia
- 52Serbia
- 24Mexico
- 21England
- 16Uzbekistan
- 15Lebanon
- 12Cambodia
- 10China
- 9Germany
- 9Czechoslovakia
- 9Brazil
- 9Canada

Zip codes: 44281.