Races in Northampton, Pennsylvania (PA) Detailed Stats
Data:
Races - White alone (%)
Races - White alone (% change since 2000)
Races - Black alone (%)
Races - Black alone (% change since 2000)
Races - American Indian alone (%)
Races - American Indian alone (% change since 2000)
Races - Asian alone (%)
Races - Asian alone (% change since 2000)
Races - Hispanic (%)
Races - Hispanic (% change since 2000)
Races - Native Hawaiian and Other Pacific Islander alone (%)
Races - Native Hawaiian and Other Pacific Islander alone (% change since 2000)
Races - Two or more races(%)
Races - Two or more races(% change since 2000)
Races - Other race alone (%)
Races - Other race alone (% change since 2000)
Racial diversity
Place of birth - Born in state of residence (%)
Place of birth - Born in state of residence (%) - White
Place of birth - Born in state of residence (%) - Black or African American
Place of birth - Born in state of residence (%) - Asian
Place of birth - Born in state of residence (%) - Hispanic or Latino
Place of birth - Born in state of residence (%) - American Indian and Alaska Native
Place of birth - Born in state of residence (%) - Multirace
Place of birth - Born in state of residence (%) - Other Race
Place of birth - Born in other state (%)
Place of birth - Born in other state (%) - White
Place of birth - Born in other state (%) - Black or African American
Place of birth - Born in other state (%) - Asian
Place of birth - Born in other state (%) - Hispanic or Latino
Place of birth - Born in other state (%) - American Indian and Alaska Native
Place of birth - Born in other state (%) - Multirace
Place of birth - Born in other state (%) - Other Race
Place of birth - Native, outside of US (%)
Place of birth - Native, outside of US (%) - White
Place of birth - Native, outside of US (%) - Black or African American
Place of birth - Native, outside of US (%) - Asian
Place of birth - Native, outside of US (%) - Hispanic or Latino
Place of birth - Native, outside of US (%) - American Indian and Alaska Native
Place of birth - Native, outside of US (%) - Multirace
Place of birth - Native, outside of US (%) - Other Race
Place of birth - Foreign born (%)
Place of birth - Foreign born (%) - White
Place of birth - Foreign born (%) - Black or African American
Place of birth - Foreign born (%) - Asian
Place of birth - Foreign born (%) - Hispanic or Latino
Place of birth - Foreign born (%) - American Indian and Alaska Native
Place of birth - Foreign born (%) - Multirace
Place of birth - Foreign born (%) - Other Race
Residents speaking English at home (%)
Residents speaking English at home - Born in the United States (%)
Residents speaking English at home - Native, born elsewhere (%)
Residents speaking English at home - Foreign born (%)
Residents speaking Spanish at home (%)
Residents speaking Spanish at home - Born in the United States (%)
Residents speaking Spanish at home - Native, born elsewhere (%)
Residents speaking Spanish at home - Foreign born (%)
Residents speaking other language at home (%)
Residents speaking other language at home - Born in the United States (%)
Residents speaking other language at home - Native, born elsewhere (%)
Residents speaking other language at home - Foreign born (%)
Marital status - Never married (%)
Marital status - Now married (%)
Marital status - Separated (%)
Marital status - Widowed (%)
Marital status - Divorced (%)
Ancestries Reported - Arab (%)
Ancestries Reported - Czech (%)
Ancestries Reported - Danish (%)
Ancestries Reported - Dutch (%)
Ancestries Reported - English (%)
Ancestries Reported - French (%)
Ancestries Reported - French Canadian (%)
Ancestries Reported - German (%)
Ancestries Reported - Greek (%)
Ancestries Reported - Hungarian (%)
Ancestries Reported - Irish (%)
Ancestries Reported - Italian (%)
Ancestries Reported - Lithuanian (%)
Ancestries Reported - Norwegian (%)
Ancestries Reported - Polish (%)
Ancestries Reported - Portuguese (%)
Ancestries Reported - Russian (%)
Ancestries Reported - Scotch-Irish (%)
Ancestries Reported - Scottish (%)
Ancestries Reported - Slovak (%)
Ancestries Reported - Subsaharan African (%)
Ancestries Reported - Swedish (%)
Ancestries Reported - Swiss (%)
Ancestries Reported - Ukrainian (%)
Ancestries Reported - United States (%)
Ancestries Reported - Welsh (%)
Ancestries Reported - West Indian (%)
Ancestries Reported - Other (%)
Geographical mobility - Same house 1 year ago (%)
Geographical mobility - Same house 1 year ago (%) - White
Geographical mobility - Same house 1 year ago (%) - Black or African American
Geographical mobility - Same house 1 year ago (%) - Asian
Geographical mobility - Same house 1 year ago (%) - Hispanic or Latino
Geographical mobility - Same house 1 year ago (%) - American Indian and Alaska Native
Geographical mobility - Same house 1 year ago (%) - Multirace
Geographical mobility - Same house 1 year ago (%) - Other Race
Geographical mobility - Moved within same county (%)
Geographical mobility - Moved within same county (%) - White
Geographical mobility - Moved within same county (%) - Black or African American
Geographical mobility - Moved within same county (%) - Asian
Geographical mobility - Moved within same county (%) - Hispanic or Latino
Geographical mobility - Moved within same county (%) - American Indian and Alaska Native
Geographical mobility - Moved within same county (%) - Multirace
Geographical mobility - Moved within same county (%) - Other Race
Geographical mobility - Moved from different county within same state (%)
Geographical mobility - Moved from different county within same state (%) - White
Geographical mobility - Moved from different county within same state (%) - Black or African American
Geographical mobility - Moved from different county within same state (%) - Asian
Geographical mobility - Moved from different county within same state (%) - Hispanic or Latino
Geographical mobility - Moved from different county within same state (%) - American Indian and Alaska Native
Geographical mobility - Moved from different county within same state (%) - Multirace
Geographical mobility - Moved from different county within same state (%) - Other Race
Geographical mobility - Moved from different state (%)
Geographical mobility - Moved from different state (%) - White
Geographical mobility - Moved from different state (%) - Black or African American
Geographical mobility - Moved from different state (%) - Asian
Geographical mobility - Moved from different state (%) - Hispanic or Latino
Geographical mobility - Moved from different state (%) - American Indian and Alaska Native
Geographical mobility - Moved from different state (%) - Multirace
Geographical mobility - Moved from different state (%) - Other Race
Geographical mobility - Moved from abroad (%)
Geographical mobility - Moved from abroad (%) - White
Geographical mobility - Moved from abroad (%) - Black or African American
Geographical mobility - Moved from abroad (%) - Asian
Geographical mobility - Moved from abroad (%) - Hispanic or Latino
Geographical mobility - Moved from abroad (%) - American Indian and Alaska Native
Geographical mobility - Moved from abroad (%) - Multirace
Geographical mobility - Moved from abroad (%) - Other Race
Place of birth for the foreign-born population - Ireland (%)
Place of birth for the foreign-born population - Denmark (%)
Place of birth for the foreign-born population - Norway (%)
Place of birth for the foreign-born population - Sweden (%)
Place of birth for the foreign-born population - United Kingdom (%)
Place of birth for the foreign-born population - England (%)
Place of birth for the foreign-born population - Scotland (%)
Place of birth for the foreign-born population - Other Northern Europe (%)
Place of birth for the foreign-born population - Austria (%)
Place of birth for the foreign-born population - Belgium (%)
Place of birth for the foreign-born population - France (%)
Place of birth for the foreign-born population - Germany (%)
Place of birth for the foreign-born population - Netherlands (%)
Place of birth for the foreign-born population - Switzerland (%)
Place of birth for the foreign-born population - Other Western Europe (%)
Place of birth for the foreign-born population - Greece (%)
Place of birth for the foreign-born population - Italy (%)
Place of birth for the foreign-born population - Portugal (%)
Place of birth for the foreign-born population - Spain (%)
Place of birth for the foreign-born population - Other Southern Europe (%)
Place of birth for the foreign-born population - Albania (%)
Place of birth for the foreign-born population - Belarus (%)
Place of birth for the foreign-born population - Bosnia and Herzegovina (%)
Place of birth for the foreign-born population - Bulgaria (%)
Place of birth for the foreign-born population - Croatia (%)
Place of birth for the foreign-born population - Czechoslovakia (%)
Place of birth for the foreign-born population - Hungary (%)
Place of birth for the foreign-born population - Latvia (%)
Place of birth for the foreign-born population - Lithuania (%)
Place of birth for the foreign-born population - North Macedonia (Macedonia) (%)
Place of birth for the foreign-born population - Moldova (%)
Place of birth for the foreign-born population - Poland (%)
Place of birth for the foreign-born population - Romania (%)
Place of birth for the foreign-born population - Russia (%)
Place of birth for the foreign-born population - Serbia (%)
Place of birth for the foreign-born population - Ukraine (%)
Place of birth for the foreign-born population - Other Eastern Europe (%)
Place of birth for the foreign-born population - China (%)
Place of birth for the foreign-born population - Hong Kong (%)
Place of birth for the foreign-born population - Taiwan (%)
Place of birth for the foreign-born population - Japan (%)
Place of birth for the foreign-born population - Korea (%)
Place of birth for the foreign-born population - Other Eastern Asia (%)
Place of birth for the foreign-born population - Afghanistan (%)
Place of birth for the foreign-born population - Bangladesh (%)
Place of birth for the foreign-born population - India (%)
Place of birth for the foreign-born population - Iran (%)
Place of birth for the foreign-born population - Kazakhstan (%)
Place of birth for the foreign-born population - Nepal (%)
Place of birth for the foreign-born population - Pakistan (%)
Place of birth for the foreign-born population - Sri Lanka (%)
Place of birth for the foreign-born population - Uzbekistan (%)
Place of birth for the foreign-born population - Other South Central Asia (%)
Place of birth for the foreign-born population - Burma (%)
Place of birth for the foreign-born population - Cambodia (%)
Place of birth for the foreign-born population - Indonesia (%)
Place of birth for the foreign-born population - Laos (%)
Place of birth for the foreign-born population - Malaysia (%)
Place of birth for the foreign-born population - Philippines (%)
Place of birth for the foreign-born population - Singapore (%)
Place of birth for the foreign-born population - Thailand (%)
Place of birth for the foreign-born population - Vietnam (%)
Place of birth for the foreign-born population - Other South Eastern Asia (%)
Place of birth for the foreign-born population - Armenia (%)
Place of birth for the foreign-born population - Iraq (%)
Place of birth for the foreign-born population - Israel (%)
Place of birth for the foreign-born population - Jordan (%)
Place of birth for the foreign-born population - Kuwait (%)
Place of birth for the foreign-born population - Lebanon (%)
Place of birth for the foreign-born population - Saudi Arabia (%)
Place of birth for the foreign-born population - Syria (%)
Place of birth for the foreign-born population - Turkey (%)
Place of birth for the foreign-born population - Yemen (%)
Place of birth for the foreign-born population - Other Western Asia (%)
Place of birth for the foreign-born population - Eritrea (%)
Place of birth for the foreign-born population - Ethiopia (%)
Place of birth for the foreign-born population - Kenya (%)
Place of birth for the foreign-born population - Somalia (%)
Place of birth for the foreign-born population - Uganda (%)
Place of birth for the foreign-born population - Zimbabwe (%)
Place of birth for the foreign-born population - Other Eastern Africa (%)
Place of birth for the foreign-born population - Cameroon (%)
Place of birth for the foreign-born population - Congo (%)
Place of birth for the foreign-born population - Democratic Republic of Congo (Zaire) (%)
Place of birth for the foreign-born population - Other Middle Africa (%)
Place of birth for the foreign-born population - Egypt (%)
Place of birth for the foreign-born population - Morocco (%)
Place of birth for the foreign-born population - Sudan (%)
Place of birth for the foreign-born population - Other Northern Africa (%)
Place of birth for the foreign-born population - South Africa (%)
Place of birth for the foreign-born population - Other Southern Africa (%)
Place of birth for the foreign-born population - Cabo Verde (%)
Place of birth for the foreign-born population - Ghana (%)
Place of birth for the foreign-born population - Liberia (%)
Place of birth for the foreign-born population - Nigeria (%)
Place of birth for the foreign-born population - Senegal (%)
Place of birth for the foreign-born population - Sierra Leone (%)
Place of birth for the foreign-born population - Other Western Africa (%)
Place of birth for the foreign-born population - Australia (%)
Place of birth for the foreign-born population - New Zealand (%)
Place of birth for the foreign-born population - Fiji (%)
Place of birth for the foreign-born population - Micronesia (%)
Place of birth for the foreign-born population - Bahamas (%)
Place of birth for the foreign-born population - Barbados (%)
Place of birth for the foreign-born population - Cuba (%)
Place of birth for the foreign-born population - Dominica (%)
Place of birth for the foreign-born population - Dominican Republic (%)
Place of birth for the foreign-born population - Grenada (%)
Place of birth for the foreign-born population - Haiti (%)
Place of birth for the foreign-born population - Jamaica (%)
Place of birth for the foreign-born population - St. Vincent and the Grenadines (%)
Place of birth for the foreign-born population - Trinidad and Tobago (%)
Place of birth for the foreign-born population - West Indies (%)
Place of birth for the foreign-born population - Other Caribbean (%)
Place of birth for the foreign-born population - Belize (%)
Place of birth for the foreign-born population - Costa Rica (%)
Place of birth for the foreign-born population - El Salvador (%)
Place of birth for the foreign-born population - Guatemala (%)
Place of birth for the foreign-born population - Honduras (%)
Place of birth for the foreign-born population - Mexico (%)
Place of birth for the foreign-born population - Nicaragua (%)
Place of birth for the foreign-born population - Panama (%)
Place of birth for the foreign-born population - Other Central America (%)
Place of birth for the foreign-born population - Argentina (%)
Place of birth for the foreign-born population - Bolivia (%)
Place of birth for the foreign-born population - Brazil (%)
Place of birth for the foreign-born population - Chile (%)
Place of birth for the foreign-born population - Colombia (%)
Place of birth for the foreign-born population - Ecuador (%)
Place of birth for the foreign-born population - Guyana (%)
Place of birth for the foreign-born population - Peru (%)
Place of birth for the foreign-born population - Uruguay (%)
Place of birth for the foreign-born population - Venezuela (%)
Place of birth for the foreign-born population - Other South America (%)
Place of birth for the foreign-born population - Canada (%)
Place of birth for the foreign-born population - Other Northern America (%)
Place of birth for the foreign-born population - Other (%)
Latest news about races in Northampton, PA collected exclusively by city-data.com from local newspapers, TV, and radio stations
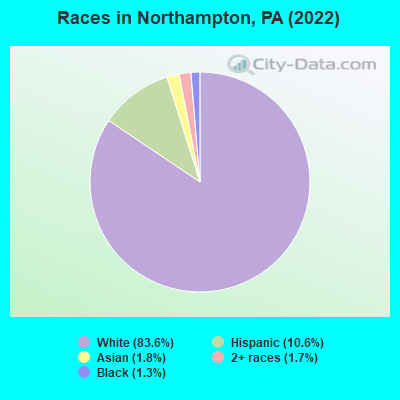
According to 2022 data, the most numerous races in Northampton, PA are White alone (8,759 residents), Black alone (132 residents), and Hispanic (1,108 residents). 89.2% of Northampton residents speak English at home. 4.2% of Northampton, PA residents are foreign-born (1.9% born in Asia, 1.6% born in Latin America, 0.6% born in Europe), which is 65.6% less than the foreign-born rate of 7.0% across the entire state of Pennsylvania.
Race distribution in Northampton
2000 2022
10,322,455 84.1% White alone 1,202,437 9.8% Black alone 394,088 3.2% Hispanic 218,296 1.8% Asian alone 113,097 0.9% Two or more races 13,086 0.1% Other race alone 14,904 0.1% American Indian alone 2,691 0.02% Native Hawaiian and Other
9,487,228 73.1% White alone 1,311,581 10.1% Black alone 1,115,997 8.6% Hispanic 493,942 3.8% Two or more races 487,124 3.8% Asian alone 63,582 0.5% Other race alone 10,130 0.08% American Indian alone 2,424 0.02% Native Hawaiian and Other
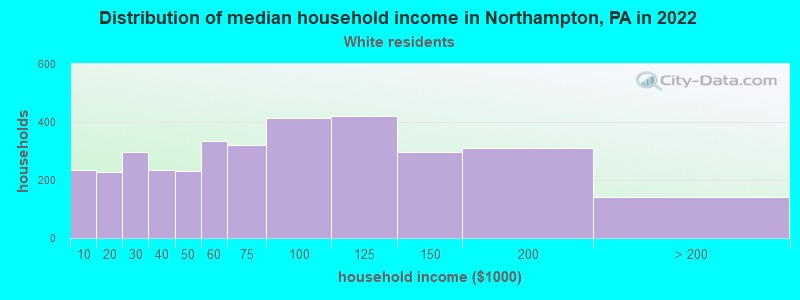
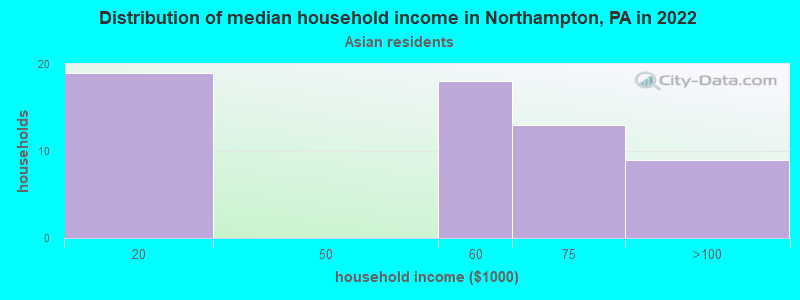
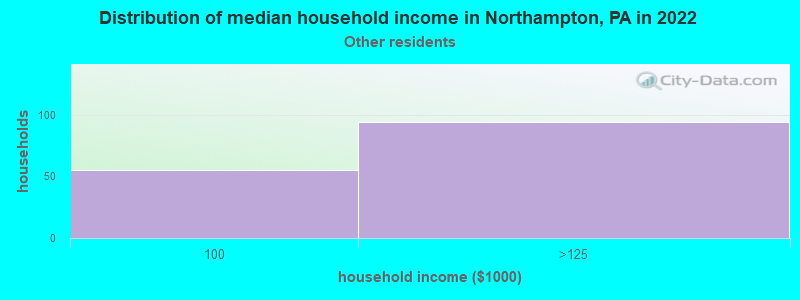
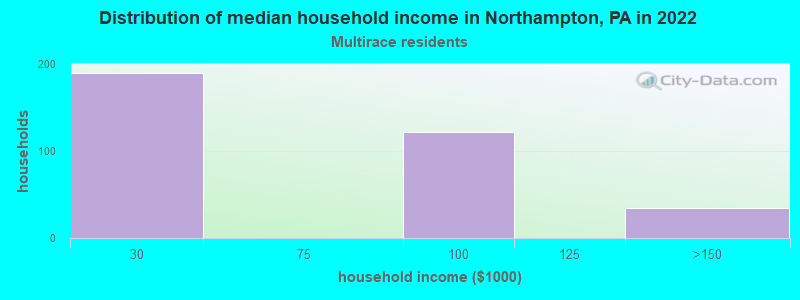
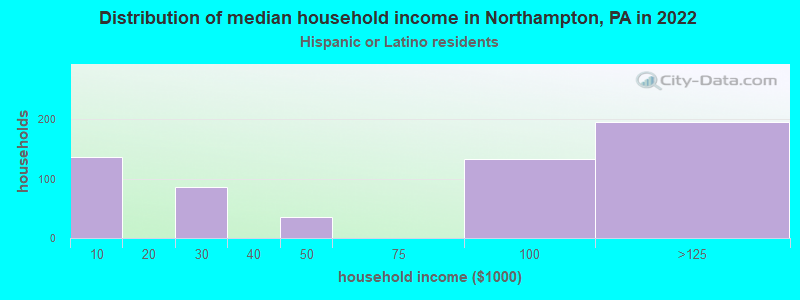
Income and house value in Northampton Median household income in 2022 $69,294 White non-Hispanic householders$108,950 Some other race householders$80,370 Two or more races householders$76,971 Hispanic or Latino race householdersMedian 2022 house value $222,399 White Non-Hispanic householders $532,906 Asian householders$185,451 Two or more races householders$226,426 Hispanic or Latino householders
Median age by race in Northampton
43.7 Median age for White residents44.5 43.6 27.7 Median age for Black or African American residents-660,152,008.0 -676,384,839.0 -678,642,713.9 Median age for American Indian / Alaska Native residents-835,945,662.7 -553,571,428.0 64.7 Median age for Asian residents68.2 34.0 -680,432,644.4 Median age for Native Hawaiian / Pacific Islander residents-649,523,808.9 -666,666,666.0 27.2 Median age for Other race residents25.5 -679,824,560.7 30.9 Median age for Two or more races residents40.0 42.2 42.6 Median age for White alone residents43.5 42.8 28.6 Median age for Hispanic or Latino residents27.7 46.6
Owner/renter occupied households by race in Northampton
House owners and renters - White residents 2,378 68.7% Owner occupied1,084 31.3% Renter occupiedHouse owners and renters - Black or African American residents 46 100.0% Renter occupiedHouse owners and renters - Asian residents 37 61.2% Owner occupied24 38.8% Renter occupiedHouse owners and renters - Other race residents 272 86.0% Owner occupied44 14.0% Renter occupiedHouse owners and renters - Two or more races residents 219 56.5% Owner occupied169 43.5% Renter occupiedHouse owners and renters - White alone residents 2,339 67.8% Owner occupied1,111 32.2% Renter occupiedHouse owners and renters - Hispanic or Latino residents 373 64.5% Owner occupied205 35.5% Renter occupied
Language usage in Northampton
English speakers - Total 89.2% of residents of Northampton speak English at home.
3.4% of residents speak Spanish at home 235 68.7% Speak English very well107 31.3% Speak English less than very well5.7% of residents speak other language at home 314 55.0% Speak English very well257 45.0% Speak English less than very well
English speakers - Born in the United States 84.6% of residents of Northampton speak English at home.
12.1% of residents speak Spanish at home 112 71.8% Speak English very well44 28.2% Speak English less than very well3.3% of residents speak other language at home 43 100.0% Speak English very well
English speakers - Native, born elsewhere 83.8% of residents of Northampton speak English at home.
9.5% of residents speak Spanish at home 45 100.0% Speak English very well
English speakers - Foreign-born 28.1% of residents of Northampton speak English at home.
21.6% of residents speak Spanish at home 34 32.4% Speak English very well71 67.6% Speak English less than very well48.7% of residents speak other language at home 52 21.9% Speak English very well185 78.1% Speak English less than very well
White (Caucasian) - Speak only English Native:
96.6% (7,919)Foreign-born:
15.7% (15)
White (Caucasian) - Speak another language Native:
3.3% (272)Foreign-born:
78.5% (74)
Asian - Speak only English Native:
20.2% (9)Foreign-born:
42.4% (56)
Asian - Speak another language Native:
84.4% (38)Foreign-born:
71.3% (94)
Other race - Speak another language Native:
15.0% (48)Foreign-born:
100.0% (65)
Two or more races - Speak only English Native:
91.1% (586)Foreign-born:
54.4% (151)
Two or more races - Speak another language Native:
3.5% (23)Foreign-born:
33.3% (92)
White alone - Speak only English Native:
96.1% (7,888)Foreign-born:
15.9% (16)
White alone - Speak another language Native:
4.2% (341)Foreign-born:
83.3% (83)
Hispanic or Latino - Speak only English Native:
68.1% (578)Foreign-born:
46.6% (114)
Hispanic or Latino - Speak another language Native:
17.3% (147)Foreign-born:
43.7% (107)
Foreign-born residents in Northampton 443 residents are foreign born (1.9% Asia , 1.6% Latin America , 0.6% Europe ).
This city:
4.2%Pennsylvania:
7.3%
Marital status for residents in Northampton Marital status - White (Caucasian) population 15 years and over
Males 31.3% Never married49.1% Now married0.6% Separated4.5% Widowed14.6% DivorcedFemales 25.6% Never married40.1% Now married4.3% Separated13.7% Widowed16.3% DivorcedWomen who gave birth in the past 12 months Now married:
100.0% (91)Unmarried:
0.0% (0)
Women who did not give birth in the past 12 months Now married:
39.6% (710)Unmarried:
60.4% (1,081)
Marital status - Black or African American population 15 years and over
Males 87.7% Never married12.3% Now married0.0% Separated0.0% Widowed0.0% DivorcedFemales 100.0% Never married0.0% Now married0.0% Separated0.0% Widowed0.0% DivorcedWomen who did not give birth in the past 12 months Now married:
0.0% (0)Unmarried:
100.0% (66)
Marital status - Asian population 15 years and over
Males 7.2% Never married28.8% Now married0.0% Separated14.4% Widowed49.5% DivorcedFemales 24.4% Never married26.8% Now married26.8% Separated0.0% Widowed22.0% DivorcedWomen who did not give birth in the past 12 months Now married:
53.7% (24)Unmarried:
46.3% (20)
Marital status - Other race population 15 years and over
Males 67.5% Never married32.5% Now married0.0% Separated0.0% Widowed0.0% DivorcedFemales 0.0% Never married100.0% Now married0.0% Separated0.0% Widowed0.0% DivorcedMarital status - Two or more races population 15 years and over
Males 69.4% Never married8.5% Now married0.0% Separated0.0% Widowed22.1% DivorcedFemales 81.4% Never married11.4% Now married0.0% Separated7.2% Widowed0.0% DivorcedWomen who did not give birth in the past 12 months Now married:
8.1% (16)Unmarried:
91.9% (178)
Marital status - White alone, not Hispanic / Latino population 15 years and over
Males 31.1% Never married49.7% Now married0.6% Separated4.6% Widowed14.0% DivorcedFemales 25.6% Never married41.0% Now married3.7% Separated13.1% Widowed16.6% DivorcedWomen who gave birth in the past 12 months Now married:
100.0% (95)Unmarried:
0.0% (0)
Women who did not give birth in the past 12 months Now married:
40.2% (740)Unmarried:
59.8% (1,100)
Marital status - Hispanic or Latino population 15 years and over
Males 63.6% Never married17.4% Now married0.0% Separated0.0% Widowed19.0% DivorcedFemales 57.6% Never married13.8% Now married11.2% Separated17.5% Widowed0.0% DivorcedWomen who did not give birth in the past 12 months Now married:
0.0% (0)Unmarried:
100.0% (167)
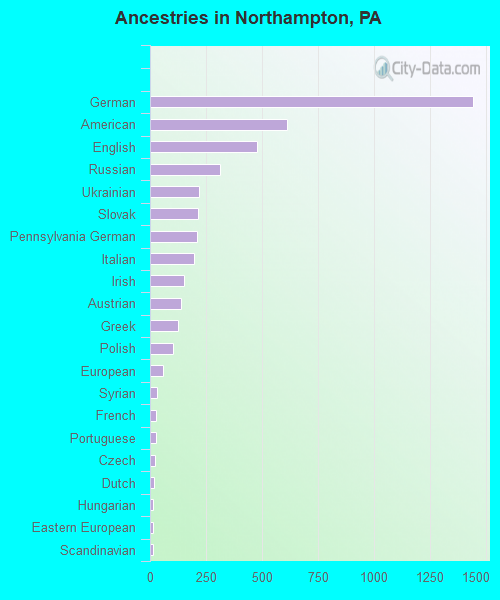
Ancestries in Northampton
1,442 25.0% German613 10.6% American479 8.3% English312 5.4% Russian218 3.8% Ukrainian214 3.7% Slovak210 3.6% Pennsylvania German196 3.4% Italian154 2.7% Irish137 2.4% Austrian125 2.2% Greek104 1.8% Polish59 1.0% European31 0.5% Syrian29 0.5% French25 0.4% Portuguese24 0.4% Czech19 0.3% Dutch15 0.3% Hungarian14 0.2% Eastern European14 0.2% Scandinavian12 0.2% Norwegian10 0.2% Swiss9 0.2% Yugoslavian7 0.1% Croatian7 0.1% Welsh6 0.1% Scotch-Irish1 0.02% French Canadian
Children Nativity (place of birth) in Northampton
Children under 6 years - Living with two parents Both parents native 244 100.0% NativeChildren under 6 years - Living with one parent Native parent 277 100.0% NativeForeign-born parent 21 100.0% NativeChildren 6 to 17 years - Living with two parents Both parents native 564 100.0% NativeBoth parents foreign-born 11 100.0% NativeChildren 6 to 17 years - Living with one parent Native parent 484 100.0% NativeForeign-born parent 32 47.1% Native36 52.9% Foreign-born
Grandparents responsible for own grandchildren in Northampton
Grandparents (30 to 59 years) White / Caucasian 69 100.0% Not responsible for grandchildrenBlack or African American 6 100.0% Responsible for grandchildrenTwo or more races 17 100.0% Responsible for grandchildrenWhite alone, not Hispanic / Latino 68 100.0% Not responsible for grandchildren
Grandparents (60 years and over) White / Caucasian 86 100.0% Not responsible for grandchildrenWhite alone, not Hispanic / Latino 91 100.0% Not responsible for grandchildren