Races in North Palm Beach, Florida (FL) Detailed Stats
Ancestries, Foreign-born residents, place of birth
Settings
X


Recent posts about races in North Palm Beach, Florida on our local forum with over 2,400,000 registered users:
 | Where is the nearest Waffle House to West Palm Beach (9 replies) |
| Terminated lease without consent or notifications (6 replies) |
| any furnished 3-6 month rental apartments in Palm Beach County? (11 replies) |
| Jupiter (25 replies) |
| Nice areas in or near North Palm Beach? (4 replies) |
| Palm Beach Gardens. (41 replies) |
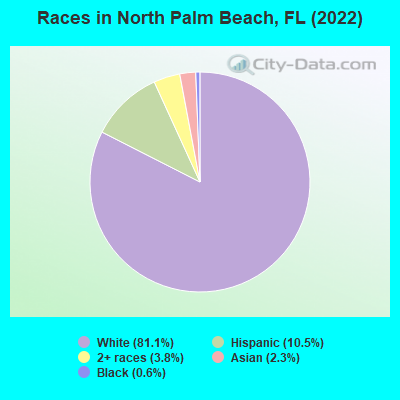
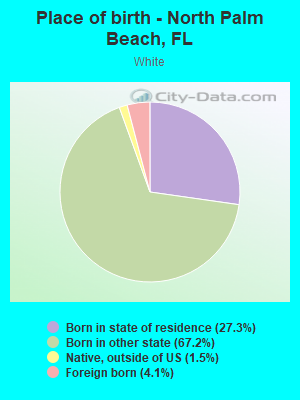
According to 2022 data, the most numerous races in North Palm Beach, FL are White alone (10,786 residents), Hispanic (1,400 residents), and Black alone (81 residents). 86.4% of North Palm Beach residents speak English at home. 11.6% of North Palm Beach, FL residents are foreign-born (5.4% born in Latin America, 2.4% born in Asia, 1.8% born in Europe), which is 81.5% less than the foreign-born rate of 21.0% across the entire state of Florida.
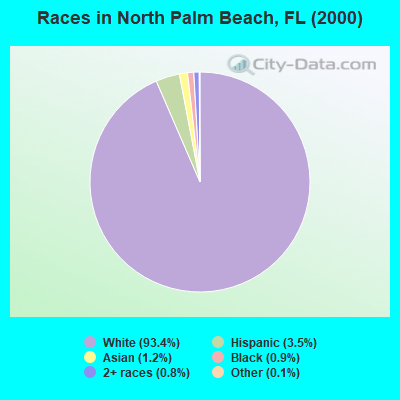
Race distribution in North Palm Beach
2000
2022

- 11,26593.4%White alone
- 4263.5%Hispanic
- 1391.2%Asian alone
- 1080.9%Black alone
- 950.8%Two or more races
- 180.1%Other race alone
- 100.08%American Indian alone
- 30.02%Native Hawaiian and Other
Pacific Islander alone
-
- 10,78681.1%White alone
- 1,40010.5%Hispanic
- 5043.8%Two or more races
- 3122.3%Asian alone
- 810.6%Black alone
- 130.10%Other race alone
2000
2022
-
- 10,458,50965.4%White alone
- 2,682,71516.8%Hispanic
- 2,264,26814.2%Black alone
- 261,6931.6%Asian alone
- 236,9541.5%Two or more races
- 42,3580.3%American Indian alone
- 28,9940.2%Other race alone
- 6,8870.04%Native Hawaiian and Other
Pacific Islander alone

-
- 11,309,40350.8%White alone
- 6,025,03927.1%Hispanic
- 3,241,01514.6%Black alone
- 861,6303.9%Two or more races
- 623,6922.8%Asian alone
- 152,0540.7%Other race alone
- 22,5040.1%American Indian alone
- 9,4860.04%Native Hawaiian and Other
Pacific Islander alone

Income and house value in North Palm Beach
- Median household income in 2022
- $93,496White non-Hispanic householders
- $54,482Black householders
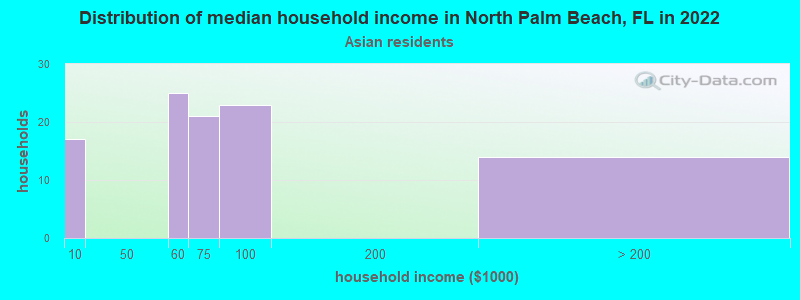
- $78,797Asian householders
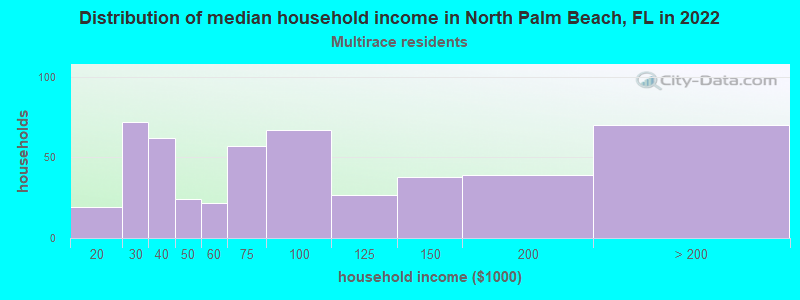
- $62,062Two or more races householders
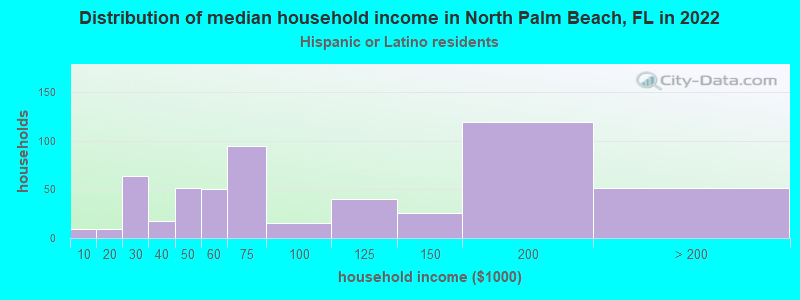
- $66,691Hispanic or Latino race householders
- Median 2022 house value
- $573,137White Non-Hispanic householders
- $526,781Black or African American householders
- $349,016Asian householders
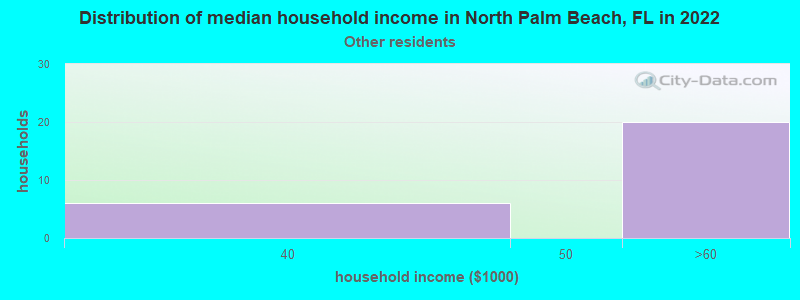
- $233,699Some other race householders
- $534,826Two or more races householders
- $439,048Hispanic or Latino householders
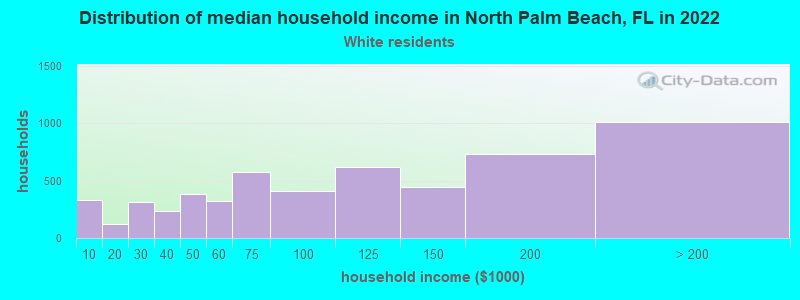
Household income for White non-Hispanic householders
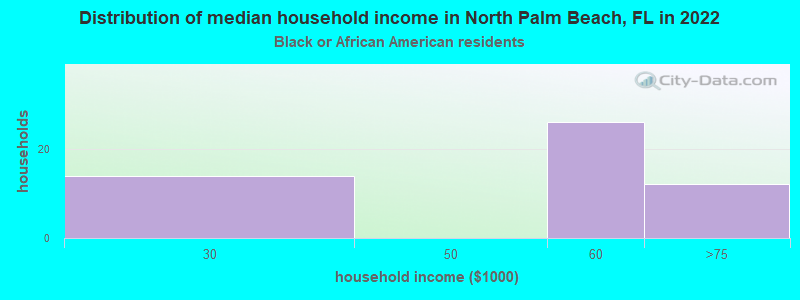
Household income for Black householders
Household income for Asian householders
Household income for Some other race householders
Household income for Two or more races householders
Household income for Hispanic or Latino race householders
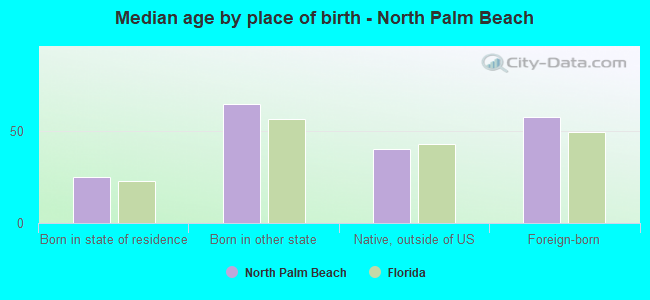
Median age by race in North Palm Beach
- 60.7Median age for White residents
- 61.8Males
- 60.0Females
- 45.4Median age for Black or African American residents
- 44.9Males
- 44.4Females
- -724,168,912.1Median age for American Indian / Alaska Native residents
- -806,112,702.2Males
- -660,098,521.5Females
- 49.4Median age for Asian residents
- 41.2Males
- 52.4Females
- -674,285,713.6Median age for Native Hawaiian / Pacific Islander residents
- -674,264,006.9Males
- -672,397,325.0Females
- 35.8Median age for Other race residents
- 19.1Males
- 47.6Females
- 39.5Median age for Two or more races residents
- 36.3Males
- 49.2Females
- 58.6Median age for White alone residents
- 60.0Males
- 58.0Females
- 39.8Median age for Hispanic or Latino residents
- 36.1Males
- 42.7Females
Owner/renter occupied households by race in North Palm Beach
- House owners and renters - White residents
- 4,43781.1%Owner occupied
- 1,03618.9%Renter occupied
- House owners and renters - Black or African American residents
- 1225.3%Owner occupied
- 3474.7%Renter occupied
- House owners and renters - Asian residents
- 11686.0%Owner occupied
- 1914.0%Renter occupied
- House owners and renters - Other race residents
- 2179.8%Owner occupied
- 520.2%Renter occupied
- House owners and renters - Two or more races residents
- 27554.2%Owner occupied
- 23245.8%Renter occupied
- House owners and renters - White alone residents
- 4,50981.1%Owner occupied
- 1,05418.9%Renter occupied
- House owners and renters - Hispanic or Latino residents
- 26950.5%Owner occupied
- 26349.5%Renter occupied
Language usage in North Palm Beach
- English speakers - Total
- 86.4% of residents of North Palm Beach speak English at home.
- 7.9% of residents speak Spanish at home
- 78076.7%Speak English very well
- 23723.3%Speak English less than very well
- 5.1% of residents speak other language at home
- 51978.6%Speak English very well
- 14121.4%Speak English less than very well
- English speakers - Born in the United States
- 96.7% of residents of North Palm Beach speak English at home.
- 1.7% of residents speak Spanish at home
- 133100.0%Speak English very well
- 1.6% of residents speak other language at home
- 11190.2%Speak English very well
- 129.8%Speak English less than very well
- English speakers - Native, born elsewhere
- 73.4% of residents of North Palm Beach speak English at home.
- 32.9% of residents speak Spanish at home
- 11088.0%Speak English very well
- 1512.0%Speak English less than very well
- English speakers - Foreign-born
- 28.9% of residents of North Palm Beach speak English at home.
- 35.6% of residents speak Spanish at home
- 34663.4%Speak English very well
- 20036.6%Speak English less than very well
- 34.3% of residents speak other language at home
- 41578.9%Speak English very well
- 11121.1%Speak English less than very well
White (Caucasian) - Speak only English
| Native: | 99.2% (9,907) |
| Foreign-born: | 75.5% (329) |
White (Caucasian) - Speak another language
| Native: | 2.9% (292) |
| Foreign-born: | 43.4% (189) |
Black or African American - Speak another language
| Native: | 13.8% (14) |
| Foreign-born: | 100.0% (51) |
Asian - Speak only English
| Native: | 100.0% (27) |
| Foreign-born: | 5.5% (16) |
Two or more races - Speak only English
| Native: | 73.7% (541) |
| Foreign-born: | 16.6% (82) |
Two or more races - Speak another language
| Native: | 24.4% (179) |
| Foreign-born: | 81.2% (400) |
White alone - Speak only English
| Native: | 98.4% (9,905) |
| Foreign-born: | 69.4% (341) |
White alone - Speak another language
| Native: | 1.9% (196) |
| Foreign-born: | 34.0% (167) |
Hispanic or Latino - Speak only English
| Native: | 50.9% (420) |
| Foreign-born: | 2.2% (12) |
Hispanic or Latino - Speak another language
| Native: | 49.6% (409) |
| Foreign-born: | 97.9% (542) |
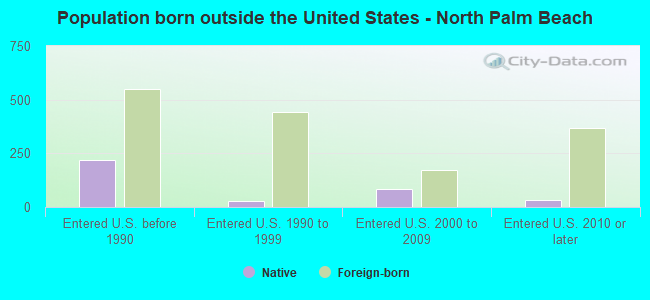
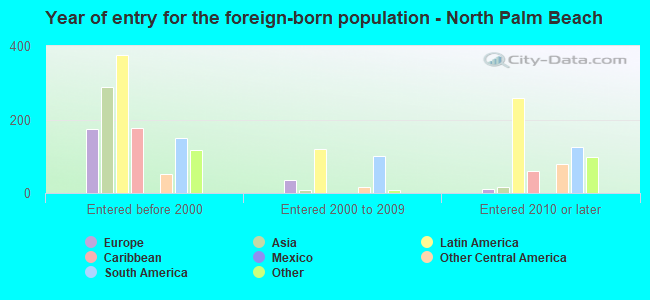
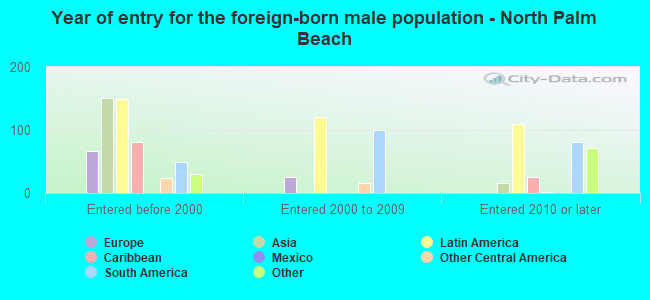
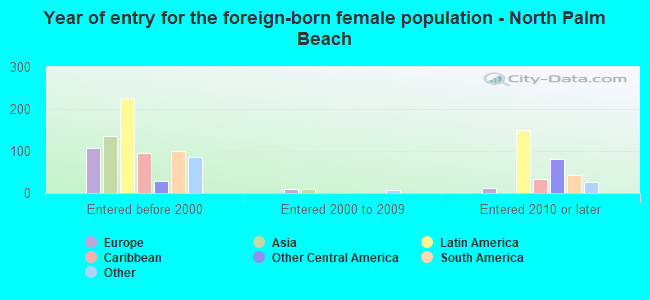
Foreign-born residents in North Palm Beach
1,539 residents are foreign born (5.4% Latin America, 2.4% Asia, 1.8% Europe).
| This city: | 11.6% |
| Florida: | 21.1% |
Marital status for residents in North Palm Beach
Marital status - White (Caucasian) population 15 years and over
- Males
- 21.9%Never married
- 52.3%Now married
- 1.2%Separated
- 7.6%Widowed
- 17.0%Divorced
- Females
- 24.1%Never married
- 47.4%Now married
- 0.8%Separated
- 11.5%Widowed
- 16.2%Divorced
Women who gave birth in the past 12 months
| Now married: | 68.8% (44) |
| Unmarried: | 31.2% (20) |
Women who did not give birth in the past 12 months
| Now married: | 38.6% (555) |
| Unmarried: | 61.4% (883) |
Marital status - Black or African American population 15 years and over
- Males
- 8.3%Never married
- 45.8%Now married
- 0.0%Separated
- 0.0%Widowed
- 45.8%Divorced
- Females
- 16.4%Never married
- 67.2%Now married
- 6.6%Separated
- 0.0%Widowed
- 9.8%Divorced
Women who did not give birth in the past 12 months
| Now married: | 49.2% (31) |
| Unmarried: | 50.8% (32) |
Marital status - Asian population 15 years and over
- Males
- 35.5%Never married
- 64.5%Now married
- 0.0%Separated
- 0.0%Widowed
- 0.0%Divorced
- Females
- 0.0%Never married
- 68.5%Now married
- 31.5%Separated
- 0.0%Widowed
- 0.0%Divorced
Women who did not give birth in the past 12 months
| Now married: | 100.0% (41) |
| Unmarried: | 0.0% (0) |
Marital status - Other race population 15 years and over
- Males
- 62.9%Never married
- 37.1%Now married
- 0.0%Separated
- 0.0%Widowed
- 0.0%Divorced
- Females
- 33.8%Never married
- 66.2%Now married
- 0.0%Separated
- 0.0%Widowed
- 0.0%Divorced
Women who did not give birth in the past 12 months
| Now married: | 50.0% (37) |
| Unmarried: | 50.0% (37) |
Marital status - Two or more races population 15 years and over
- Males
- 64.4%Never married
- 33.3%Now married
- 0.0%Separated
- 2.3%Widowed
- 0.0%Divorced
- Females
- 16.4%Never married
- 57.0%Now married
- 0.0%Separated
- 0.7%Widowed
- 25.8%Divorced
Women who did not give birth in the past 12 months
| Now married: | 53.7% (100) |
| Unmarried: | 46.3% (86) |
Marital status - White alone, not Hispanic / Latino population 15 years and over
- Males
- 20.9%Never married
- 53.0%Now married
- 1.3%Separated
- 7.5%Widowed
- 17.3%Divorced
- Females
- 23.8%Never married
- 47.3%Now married
- 0.9%Separated
- 11.7%Widowed
- 16.3%Divorced
Women who gave birth in the past 12 months
| Now married: | 68.8% (51) |
| Unmarried: | 31.2% (23) |
Women who did not give birth in the past 12 months
| Now married: | 38.2% (599) |
| Unmarried: | 61.8% (969) |
Marital status - Hispanic or Latino population 15 years and over
- Males
- 52.4%Never married
- 35.4%Now married
- 0.0%Separated
- 4.9%Widowed
- 7.3%Divorced
- Females
- 21.9%Never married
- 63.0%Now married
- 0.0%Separated
- 2.3%Widowed
- 12.8%Divorced
Women who did not give birth in the past 12 months
| Now married: | 53.2% (153) |
| Unmarried: | 46.8% (135) |
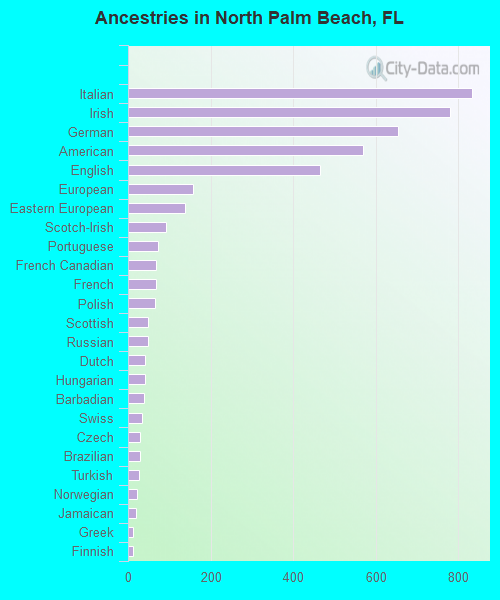
Ancestries in North Palm Beach

- 83315.0%Italian
- 78014.0%Irish
- 65411.7%German
- 57010.2%American
- 4648.3%English
- 1582.8%European
- 1382.5%Eastern European
- 931.7%Scotch-Irish
- 731.3%Portuguese
- 671.2%French Canadian
- 671.2%French
- 651.2%Polish
- 480.9%Scottish
- 480.9%Russian
- 410.7%Dutch
- 400.7%Hungarian
- 380.7%Barbadian
- 330.6%Swiss
- 300.5%Czech
- 280.5%Brazilian
- 260.5%Turkish
- 230.4%Norwegian
- 200.4%Jamaican
- 130.2%Greek
- 120.2%Finnish
- 120.2%British
- 110.2%Canadian
- 90.2%Australian
- 90.2%Austrian
- 90.2%Croatian
- 90.2%Slavic
- 80.1%Swedish
- 70.1%Lebanese
- 70.1%Romanian
- 70.1%Slovene
- 60.1%Slovak
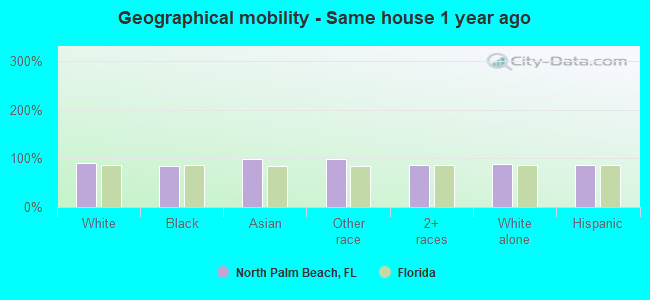
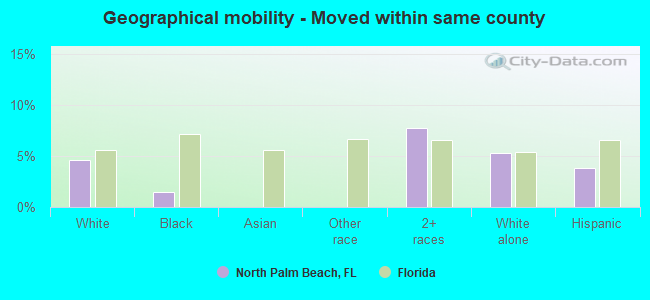
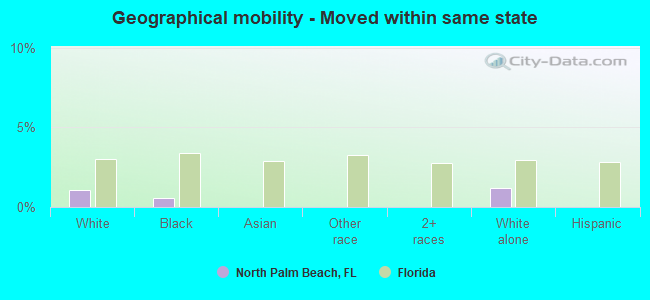
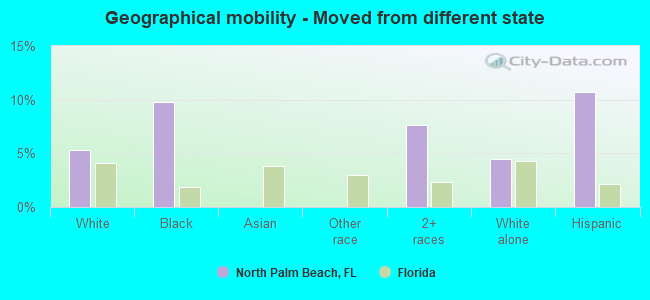
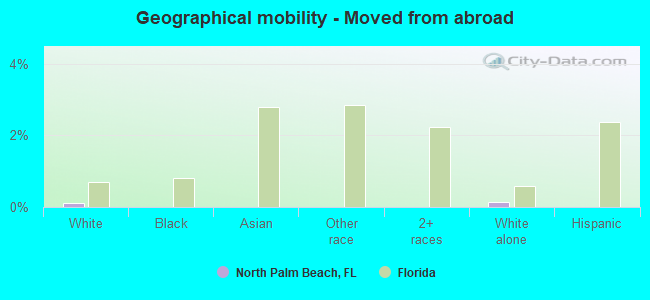
Geographical mobility in North Palm Beach

- Same house 1 year ago
- 9,14089.4%White (Caucasian)
- 14383.5%Black or African American
- 30898.2%Asian
- 18498.8%Other race
- 1,07085.9%Two or more races
- 9,57189.0%White alone, not Hispanic / Latino
- 1,22687.3%Hispanic or Latino
-
- Moved within same county
- 4734.6%White / Caucasian
- 31.5%Black or African American
- 977.8%Two or more races
- 5665.3%White alone, not Hispanic / Latino
- 533.8%Hispanic or Latino
-
- Moved within same state
- 1061.0%White / Caucasian
- 10.5%Black or African American
- 1261.2%White alone, not Hispanic / Latino
-
- Moved from different state
- 5475.3%White / Caucasian
- 179.8%Black or African American
- 967.7%Two or more races
- 4834.5%White alone, not Hispanic / Latino
- 15010.7%Hispanic or Latino
-
- Moved from abroad
- 110.1%White
- 140.1%White alone, not Hispanic / Latino
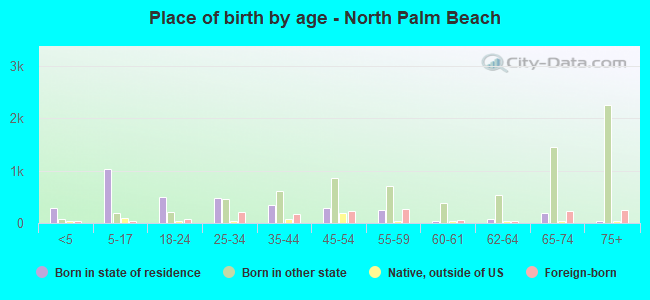
Children Nativity (place of birth) in North Palm Beach
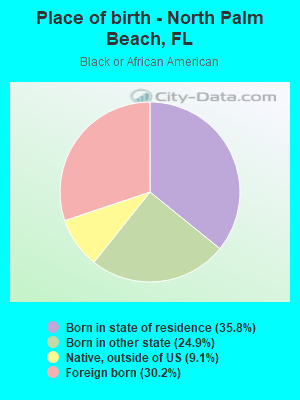
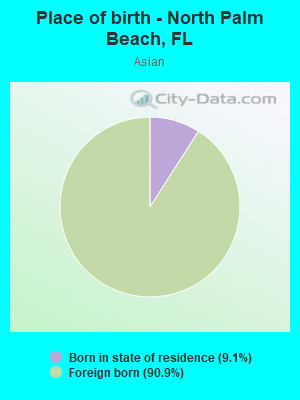
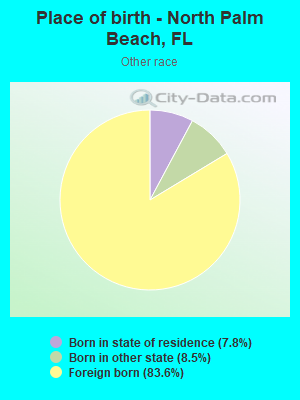
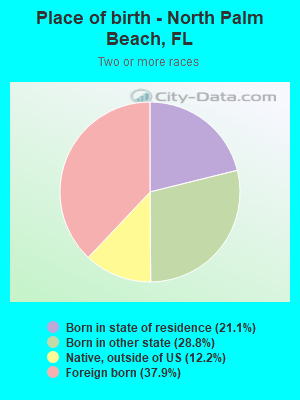
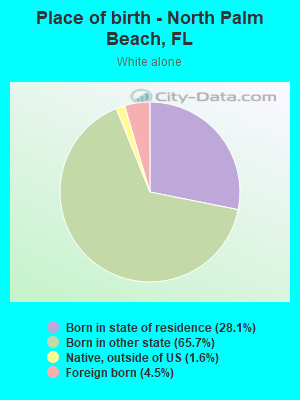
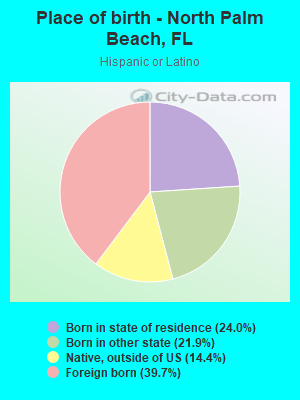
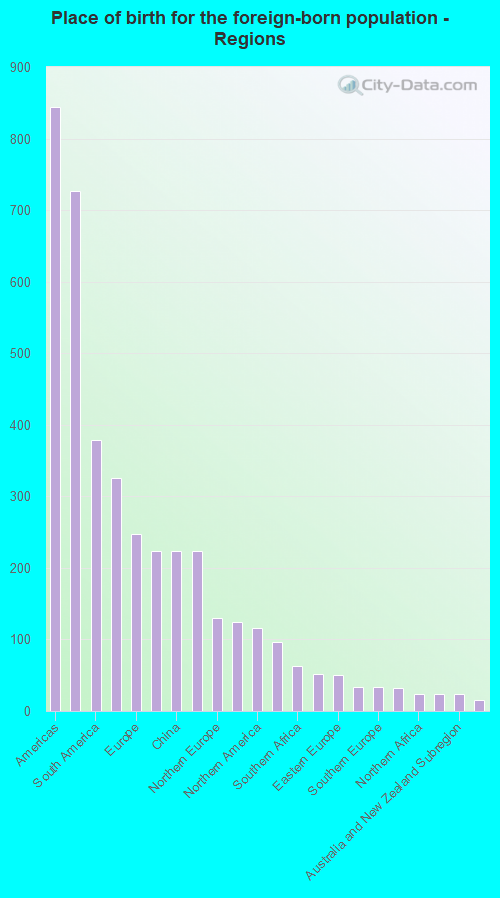
Place of birth for residents in North Palm Beach
![Place of birth for the foreign-born population - Regions]()
- 844Americas
- 727Latin America
- 379South America
- 326Asia
- 247Europe
- 223Eastern Asia
- 223China
- 223Caribbean
- 130Northern Europe
- 124Central America
- 116Northern America
- 96Africa
- 63Southern Africa
- 52South Eastern Asia
- 51Eastern Europe
- 34Western Asia
- 33Southern Europe
- 32Western Europe
- 24Northern Africa
- 24Oceania
- 24Australia and New Zealand Subregion
- 16South Central Asia
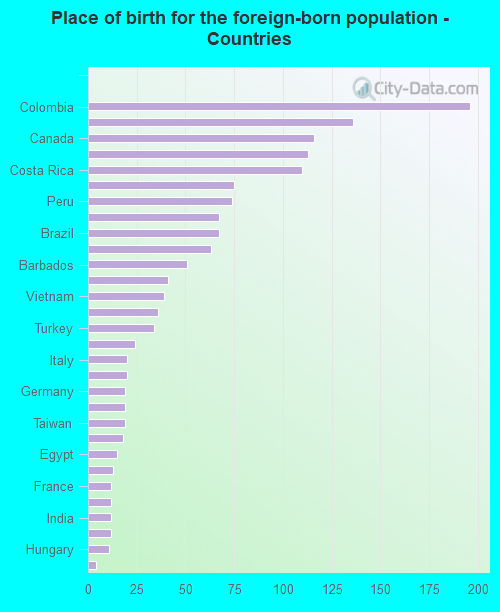
![Place of birth for the foreign-born population - Countries]()
- 196Colombia
- 136Hong Kong
- 116Canada
- 113Cuba
- 110Costa Rica
- 75England
- 74Peru
- 67China
- 67Brazil
- 63South Africa
- 51Barbados
- 41Venezuela
- 39Vietnam
- 36Ireland
- 34Turkey
- 24Australia
- 20Italy
- 20Russia
- 19Germany
- 19North Macedonia (Macedonia)
- 19Taiwan
- 18United Kingdom
- 15Egypt
- 13Philippines
- 12France
- 12Portugal
- 12India
- 12Panama
- 11Hungary
- 4Afghanistan
- 1Mexico
Grandparents responsible for own grandchildren in North Palm Beach
Zip codes: 33408.