Races in Newton, Massachusetts (MA) Detailed Stats
Data:
Races - White alone (%)
Races - White alone (% change since 2000)
Races - Black alone (%)
Races - Black alone (% change since 2000)
Races - American Indian alone (%)
Races - American Indian alone (% change since 2000)
Races - Asian alone (%)
Races - Asian alone (% change since 2000)
Races - Hispanic (%)
Races - Hispanic (% change since 2000)
Races - Native Hawaiian and Other Pacific Islander alone (%)
Races - Native Hawaiian and Other Pacific Islander alone (% change since 2000)
Races - Two or more races(%)
Races - Two or more races(% change since 2000)
Races - Other race alone (%)
Races - Other race alone (% change since 2000)
Racial diversity
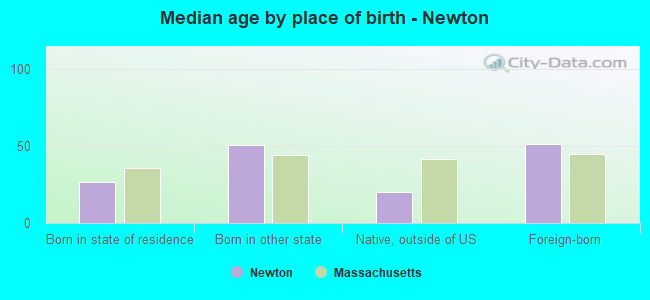
Place of birth - Born in state of residence (%)
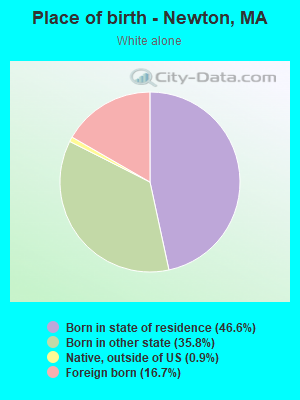
Place of birth - Born in state of residence (%) - White
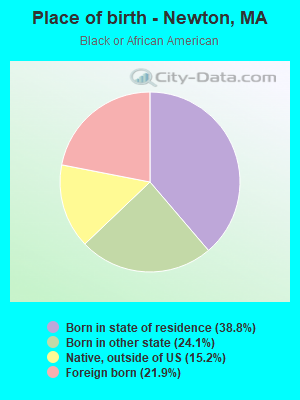
Place of birth - Born in state of residence (%) - Black or African American
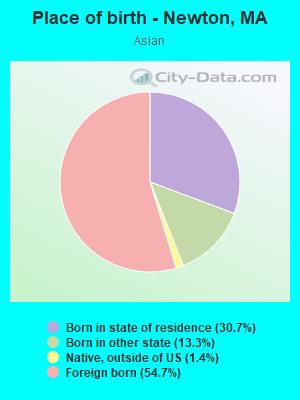
Place of birth - Born in state of residence (%) - Asian
Place of birth - Born in state of residence (%) - Hispanic or Latino
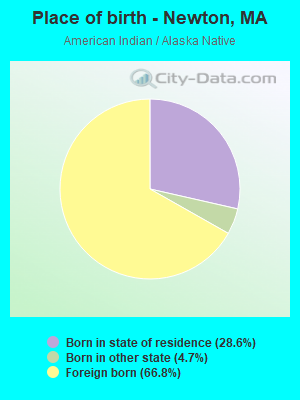
Place of birth - Born in state of residence (%) - American Indian and Alaska Native
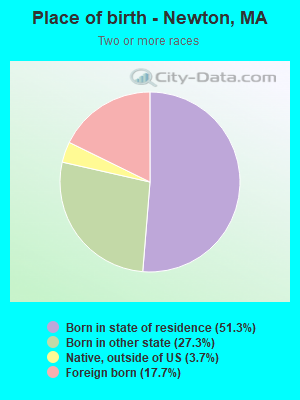
Place of birth - Born in state of residence (%) - Multirace
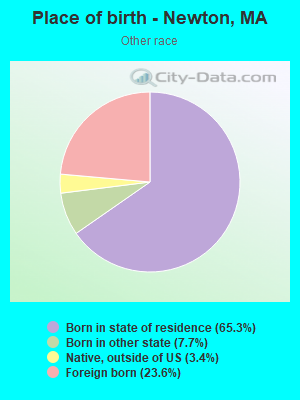
Place of birth - Born in state of residence (%) - Other Race
Place of birth - Born in other state (%)
Place of birth - Born in other state (%) - White
Place of birth - Born in other state (%) - Black or African American
Place of birth - Born in other state (%) - Asian
Place of birth - Born in other state (%) - Hispanic or Latino
Place of birth - Born in other state (%) - American Indian and Alaska Native
Place of birth - Born in other state (%) - Multirace
Place of birth - Born in other state (%) - Other Race
Place of birth - Native, outside of US (%)
Place of birth - Native, outside of US (%) - White
Place of birth - Native, outside of US (%) - Black or African American
Place of birth - Native, outside of US (%) - Asian
Place of birth - Native, outside of US (%) - Hispanic or Latino
Place of birth - Native, outside of US (%) - American Indian and Alaska Native
Place of birth - Native, outside of US (%) - Multirace
Place of birth - Native, outside of US (%) - Other Race
Place of birth - Foreign born (%)
Place of birth - Foreign born (%) - White
Place of birth - Foreign born (%) - Black or African American
Place of birth - Foreign born (%) - Asian
Place of birth - Foreign born (%) - Hispanic or Latino
Place of birth - Foreign born (%) - American Indian and Alaska Native
Place of birth - Foreign born (%) - Multirace
Place of birth - Foreign born (%) - Other Race
Residents speaking English at home (%)
Residents speaking English at home - Born in the United States (%)
Residents speaking English at home - Native, born elsewhere (%)
Residents speaking English at home - Foreign born (%)
Residents speaking Spanish at home (%)
Residents speaking Spanish at home - Born in the United States (%)
Residents speaking Spanish at home - Native, born elsewhere (%)
Residents speaking Spanish at home - Foreign born (%)
Residents speaking other language at home (%)
Residents speaking other language at home - Born in the United States (%)
Residents speaking other language at home - Native, born elsewhere (%)
Residents speaking other language at home - Foreign born (%)
Marital status - Never married (%)
Marital status - Now married (%)
Marital status - Separated (%)
Marital status - Widowed (%)
Marital status - Divorced (%)
Ancestries Reported - Arab (%)
Ancestries Reported - Czech (%)
Ancestries Reported - Danish (%)
Ancestries Reported - Dutch (%)
Ancestries Reported - English (%)
Ancestries Reported - French (%)
Ancestries Reported - French Canadian (%)
Ancestries Reported - German (%)
Ancestries Reported - Greek (%)
Ancestries Reported - Hungarian (%)
Ancestries Reported - Irish (%)
Ancestries Reported - Italian (%)
Ancestries Reported - Lithuanian (%)
Ancestries Reported - Norwegian (%)
Ancestries Reported - Polish (%)
Ancestries Reported - Portuguese (%)
Ancestries Reported - Russian (%)
Ancestries Reported - Scotch-Irish (%)
Ancestries Reported - Scottish (%)
Ancestries Reported - Slovak (%)
Ancestries Reported - Subsaharan African (%)
Ancestries Reported - Swedish (%)
Ancestries Reported - Swiss (%)
Ancestries Reported - Ukrainian (%)
Ancestries Reported - United States (%)
Ancestries Reported - Welsh (%)
Ancestries Reported - West Indian (%)
Ancestries Reported - Other (%)
Geographical mobility - Same house 1 year ago (%)
Geographical mobility - Same house 1 year ago (%) - White
Geographical mobility - Same house 1 year ago (%) - Black or African American
Geographical mobility - Same house 1 year ago (%) - Asian
Geographical mobility - Same house 1 year ago (%) - Hispanic or Latino
Geographical mobility - Same house 1 year ago (%) - American Indian and Alaska Native
Geographical mobility - Same house 1 year ago (%) - Multirace
Geographical mobility - Same house 1 year ago (%) - Other Race
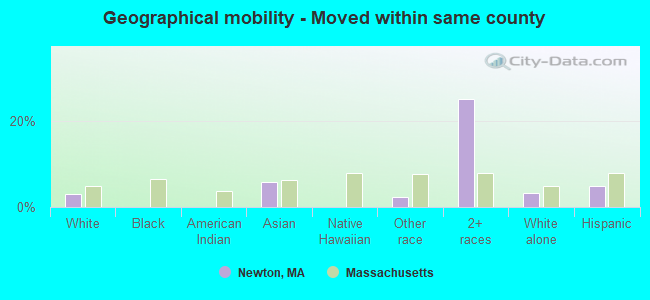
Geographical mobility - Moved within same county (%)
Geographical mobility - Moved within same county (%) - White
Geographical mobility - Moved within same county (%) - Black or African American
Geographical mobility - Moved within same county (%) - Asian
Geographical mobility - Moved within same county (%) - Hispanic or Latino
Geographical mobility - Moved within same county (%) - American Indian and Alaska Native
Geographical mobility - Moved within same county (%) - Multirace
Geographical mobility - Moved within same county (%) - Other Race
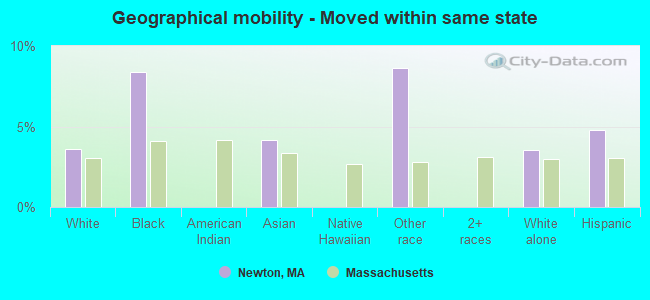
Geographical mobility - Moved from different county within same state (%)
Geographical mobility - Moved from different county within same state (%) - White
Geographical mobility - Moved from different county within same state (%) - Black or African American
Geographical mobility - Moved from different county within same state (%) - Asian
Geographical mobility - Moved from different county within same state (%) - Hispanic or Latino
Geographical mobility - Moved from different county within same state (%) - American Indian and Alaska Native
Geographical mobility - Moved from different county within same state (%) - Multirace
Geographical mobility - Moved from different county within same state (%) - Other Race
Geographical mobility - Moved from different state (%)
Geographical mobility - Moved from different state (%) - White
Geographical mobility - Moved from different state (%) - Black or African American
Geographical mobility - Moved from different state (%) - Asian
Geographical mobility - Moved from different state (%) - Hispanic or Latino
Geographical mobility - Moved from different state (%) - American Indian and Alaska Native
Geographical mobility - Moved from different state (%) - Multirace
Geographical mobility - Moved from different state (%) - Other Race
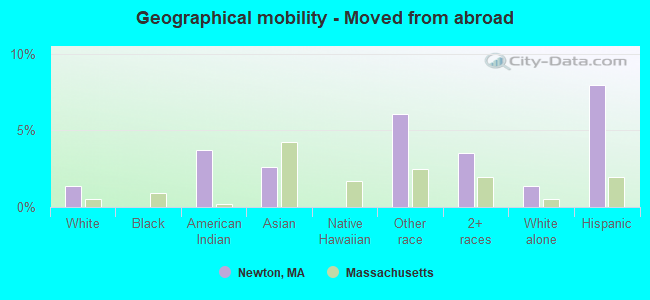
Geographical mobility - Moved from abroad (%)
Geographical mobility - Moved from abroad (%) - White
Geographical mobility - Moved from abroad (%) - Black or African American
Geographical mobility - Moved from abroad (%) - Asian
Geographical mobility - Moved from abroad (%) - Hispanic or Latino
Geographical mobility - Moved from abroad (%) - American Indian and Alaska Native
Geographical mobility - Moved from abroad (%) - Multirace
Geographical mobility - Moved from abroad (%) - Other Race
Place of birth for the foreign-born population - Ireland (%)
Place of birth for the foreign-born population - Denmark (%)
Place of birth for the foreign-born population - Norway (%)
Place of birth for the foreign-born population - Sweden (%)
Place of birth for the foreign-born population - United Kingdom (%)
Place of birth for the foreign-born population - England (%)
Place of birth for the foreign-born population - Scotland (%)
Place of birth for the foreign-born population - Other Northern Europe (%)
Place of birth for the foreign-born population - Austria (%)
Place of birth for the foreign-born population - Belgium (%)
Place of birth for the foreign-born population - France (%)
Place of birth for the foreign-born population - Germany (%)
Place of birth for the foreign-born population - Netherlands (%)
Place of birth for the foreign-born population - Switzerland (%)
Place of birth for the foreign-born population - Other Western Europe (%)
Place of birth for the foreign-born population - Greece (%)
Place of birth for the foreign-born population - Italy (%)
Place of birth for the foreign-born population - Portugal (%)
Place of birth for the foreign-born population - Spain (%)
Place of birth for the foreign-born population - Other Southern Europe (%)
Place of birth for the foreign-born population - Albania (%)
Place of birth for the foreign-born population - Belarus (%)
Place of birth for the foreign-born population - Bosnia and Herzegovina (%)
Place of birth for the foreign-born population - Bulgaria (%)
Place of birth for the foreign-born population - Croatia (%)
Place of birth for the foreign-born population - Czechoslovakia (%)
Place of birth for the foreign-born population - Hungary (%)
Place of birth for the foreign-born population - Latvia (%)
Place of birth for the foreign-born population - Lithuania (%)
Place of birth for the foreign-born population - North Macedonia (Macedonia) (%)
Place of birth for the foreign-born population - Moldova (%)
Place of birth for the foreign-born population - Poland (%)
Place of birth for the foreign-born population - Romania (%)
Place of birth for the foreign-born population - Russia (%)
Place of birth for the foreign-born population - Serbia (%)
Place of birth for the foreign-born population - Ukraine (%)
Place of birth for the foreign-born population - Other Eastern Europe (%)
Place of birth for the foreign-born population - China (%)
Place of birth for the foreign-born population - Hong Kong (%)
Place of birth for the foreign-born population - Taiwan (%)
Place of birth for the foreign-born population - Japan (%)
Place of birth for the foreign-born population - Korea (%)
Place of birth for the foreign-born population - Other Eastern Asia (%)
Place of birth for the foreign-born population - Afghanistan (%)
Place of birth for the foreign-born population - Bangladesh (%)
Place of birth for the foreign-born population - India (%)
Place of birth for the foreign-born population - Iran (%)
Place of birth for the foreign-born population - Kazakhstan (%)
Place of birth for the foreign-born population - Nepal (%)
Place of birth for the foreign-born population - Pakistan (%)
Place of birth for the foreign-born population - Sri Lanka (%)
Place of birth for the foreign-born population - Uzbekistan (%)
Place of birth for the foreign-born population - Other South Central Asia (%)
Place of birth for the foreign-born population - Burma (%)
Place of birth for the foreign-born population - Cambodia (%)
Place of birth for the foreign-born population - Indonesia (%)
Place of birth for the foreign-born population - Laos (%)
Place of birth for the foreign-born population - Malaysia (%)
Place of birth for the foreign-born population - Philippines (%)
Place of birth for the foreign-born population - Singapore (%)
Place of birth for the foreign-born population - Thailand (%)
Place of birth for the foreign-born population - Vietnam (%)
Place of birth for the foreign-born population - Other South Eastern Asia (%)
Place of birth for the foreign-born population - Armenia (%)
Place of birth for the foreign-born population - Iraq (%)
Place of birth for the foreign-born population - Israel (%)
Place of birth for the foreign-born population - Jordan (%)
Place of birth for the foreign-born population - Kuwait (%)
Place of birth for the foreign-born population - Lebanon (%)
Place of birth for the foreign-born population - Saudi Arabia (%)
Place of birth for the foreign-born population - Syria (%)
Place of birth for the foreign-born population - Turkey (%)
Place of birth for the foreign-born population - Yemen (%)
Place of birth for the foreign-born population - Other Western Asia (%)
Place of birth for the foreign-born population - Eritrea (%)
Place of birth for the foreign-born population - Ethiopia (%)
Place of birth for the foreign-born population - Kenya (%)
Place of birth for the foreign-born population - Somalia (%)
Place of birth for the foreign-born population - Uganda (%)
Place of birth for the foreign-born population - Zimbabwe (%)
Place of birth for the foreign-born population - Other Eastern Africa (%)
Place of birth for the foreign-born population - Cameroon (%)
Place of birth for the foreign-born population - Congo (%)
Place of birth for the foreign-born population - Democratic Republic of Congo (Zaire) (%)
Place of birth for the foreign-born population - Other Middle Africa (%)
Place of birth for the foreign-born population - Egypt (%)
Place of birth for the foreign-born population - Morocco (%)
Place of birth for the foreign-born population - Sudan (%)
Place of birth for the foreign-born population - Other Northern Africa (%)
Place of birth for the foreign-born population - South Africa (%)
Place of birth for the foreign-born population - Other Southern Africa (%)
Place of birth for the foreign-born population - Cabo Verde (%)
Place of birth for the foreign-born population - Ghana (%)
Place of birth for the foreign-born population - Liberia (%)
Place of birth for the foreign-born population - Nigeria (%)
Place of birth for the foreign-born population - Senegal (%)
Place of birth for the foreign-born population - Sierra Leone (%)
Place of birth for the foreign-born population - Other Western Africa (%)
Place of birth for the foreign-born population - Australia (%)
Place of birth for the foreign-born population - New Zealand (%)
Place of birth for the foreign-born population - Fiji (%)
Place of birth for the foreign-born population - Micronesia (%)
Place of birth for the foreign-born population - Bahamas (%)
Place of birth for the foreign-born population - Barbados (%)
Place of birth for the foreign-born population - Cuba (%)
Place of birth for the foreign-born population - Dominica (%)
Place of birth for the foreign-born population - Dominican Republic (%)
Place of birth for the foreign-born population - Grenada (%)
Place of birth for the foreign-born population - Haiti (%)
Place of birth for the foreign-born population - Jamaica (%)
Place of birth for the foreign-born population - St. Vincent and the Grenadines (%)
Place of birth for the foreign-born population - Trinidad and Tobago (%)
Place of birth for the foreign-born population - West Indies (%)
Place of birth for the foreign-born population - Other Caribbean (%)
Place of birth for the foreign-born population - Belize (%)
Place of birth for the foreign-born population - Costa Rica (%)
Place of birth for the foreign-born population - El Salvador (%)
Place of birth for the foreign-born population - Guatemala (%)
Place of birth for the foreign-born population - Honduras (%)
Place of birth for the foreign-born population - Mexico (%)
Place of birth for the foreign-born population - Nicaragua (%)
Place of birth for the foreign-born population - Panama (%)
Place of birth for the foreign-born population - Other Central America (%)
Place of birth for the foreign-born population - Argentina (%)
Place of birth for the foreign-born population - Bolivia (%)
Place of birth for the foreign-born population - Brazil (%)
Place of birth for the foreign-born population - Chile (%)
Place of birth for the foreign-born population - Colombia (%)
Place of birth for the foreign-born population - Ecuador (%)
Place of birth for the foreign-born population - Guyana (%)
Place of birth for the foreign-born population - Peru (%)
Place of birth for the foreign-born population - Uruguay (%)
Place of birth for the foreign-born population - Venezuela (%)
Place of birth for the foreign-born population - Other South America (%)
Place of birth for the foreign-born population - Canada (%)
Place of birth for the foreign-born population - Other Northern America (%)
Place of birth for the foreign-born population - Other (%)
Latest news about races in Newton, MA collected exclusively by city-data.com from local newspapers, TV, and radio stations
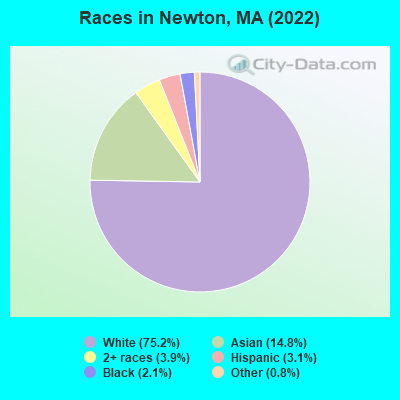
According to 2022 data, the most numerous races in Newton, MA are White alone (65,705 residents), Hispanic (2,716 residents), and Asian alone (12,919 residents). 73.6% of Newton residents speak English at home. 22.8% of Newton, MA residents are foreign-born (10.3% born in Asia, 7.3% born in Europe, 2.3% born in Latin America), which is 21.2% greater than the foreign-born rate of 18.0% across the entire state of Massachusetts.
Race distribution in Newton
2000 2022
72,388 86.4% White alone 6,415 7.7% Asian alone 2,111 2.5% Hispanic 1,584 1.9% Black alone 1,057 1.3% Two or more races 213 0.3% Other race alone 43 0.05% American Indian alone 18 0.02% Native Hawaiian and Other
65,705 75.2% White alone 12,919 14.8% Asian alone 3,389 3.9% Two or more races 2,716 3.1% Hispanic 1,847 2.1% Black alone 739 0.8% Other race alone 48 0.05% Native Hawaiian and Other 19 0.02% American Indian alone
2000 2022
5,198,359 81.9% White alone 428,729 6.8% Hispanic 318,329 5.0% Black alone 236,786 3.7% Asian alone 110,338 1.7% Two or more races 43,586 0.7% Other race alone 11,264 0.2% American Indian alone 1,706 0.03% Native Hawaiian and Other
4,676,627 67.0% White alone 911,038 13.0% Hispanic 501,463 7.2% Asian alone 459,740 6.6% Black alone 341,889 4.9% Two or more races 84,403 1.2% Other race alone 5,838 0.08% American Indian alone 976 0.01% Native Hawaiian and Other
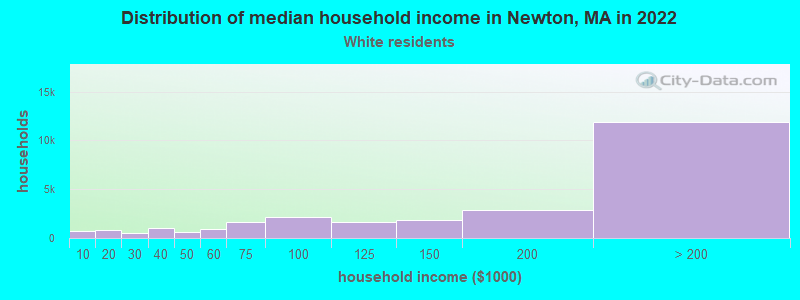
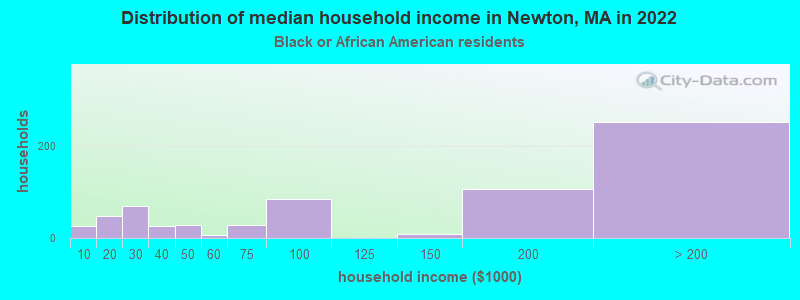
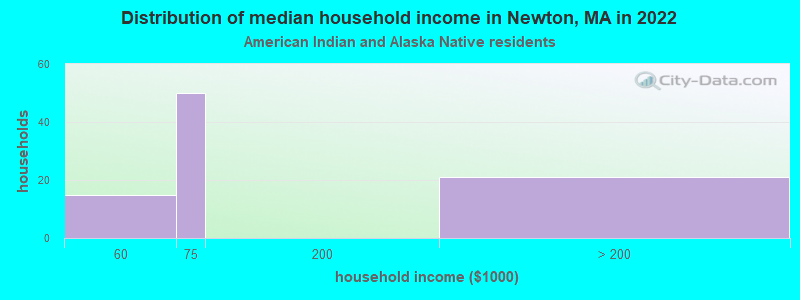
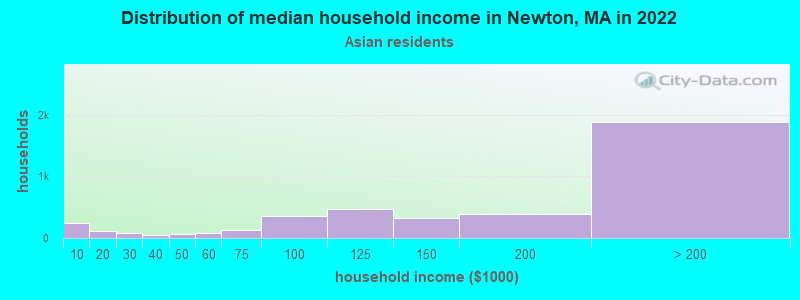
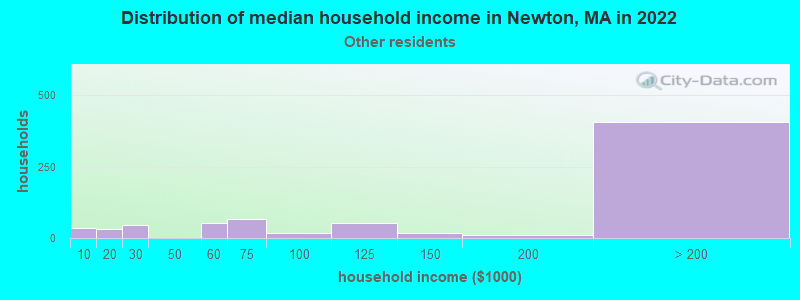
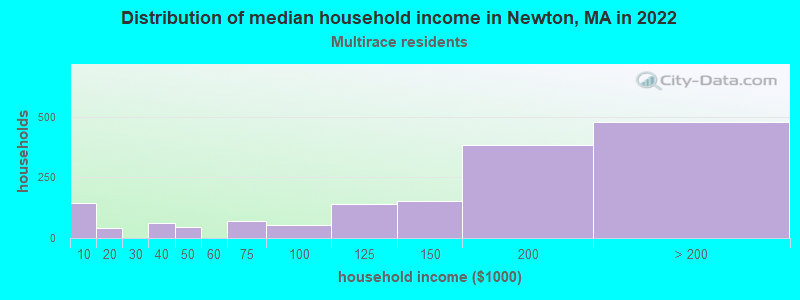
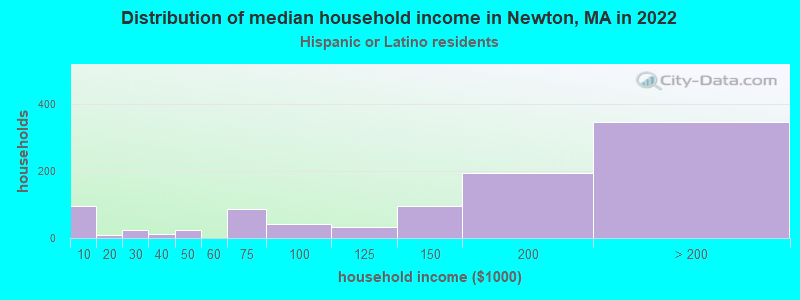
Income and house value in Newton Median household income in 2022 $174,661 White non-Hispanic householders$151,893 Black householders$134,462 Asian householders$154,225 Two or more races householders$154,815 Hispanic or Latino race householdersMedian 2022 house value over $1,000,000 White Non-Hispanic householdersover $1,000,000 Black or African American householders$442,564 American Indian or Alaska Native householders $969,285 Asian householders$612,782 Some other race householdersover $1,000,000 Two or more races householdersover $1,000,000 Hispanic or Latino householders
Median age by race in Newton
46.4 Median age for White residents45.2 47.8 47.3 Median age for Black or African American residents47.4 46.9 54.2 Median age for American Indian / Alaska Native residents55.1 -666,666,666.0 41.7 Median age for Asian residents41.2 42.6 -666,666,666.0 Median age for Native Hawaiian / Pacific Islander residents-666,666,666.0 -666,666,666.0 31.8 Median age for Other race residents36.4 26.4 17.5 Median age for Two or more races residents18.1 17.0 47.0 Median age for White alone residents45.5 48.0 32.2 Median age for Hispanic or Latino residents34.7 22.5
Owner/renter occupied households by race in Newton
House owners and renters - White residents 18,616 69.5% Owner occupied8,161 30.5% Renter occupiedHouse owners and renters - Black or African American residents 198 25.5% Owner occupied577 74.5% Renter occupiedHouse owners and renters - American Indian / Alaska Native residents 19 29.2% Owner occupied47 70.8% Renter occupiedHouse owners and renters - Asian residents 3,497 82.6% Owner occupied739 17.4% Renter occupiedHouse owners and renters - Other race residents 353 52.7% Owner occupied317 47.3% Renter occupiedHouse owners and renters - Two or more races residents 670 76.4% Owner occupied207 23.6% Renter occupiedHouse owners and renters - White alone residents 18,616 69.9% Owner occupied8,009 30.1% Renter occupiedHouse owners and renters - Hispanic or Latino residents 265 34.6% Owner occupied501 65.4% Renter occupied
Language usage in Newton
English speakers - Total 73.6% of residents of Newton speak English at home.
2.2% of residents speak Spanish at home 1,211 66.6% Speak English very well606 33.4% Speak English less than very well24.2% of residents speak other language at home 15,043 73.9% Speak English very well5,311 26.1% Speak English less than very well
English speakers - Born in the United States 91.0% of residents of Newton speak English at home.
1.2% of residents speak Spanish at home 295 94.6% Speak English very well17 5.4% Speak English less than very well7.8% of residents speak other language at home 1,843 87.1% Speak English very well273 12.9% Speak English less than very well
English speakers - Native, born elsewhere 75.3% of residents of Newton speak English at home.
6.6% of residents speak Spanish at home 57 68.7% Speak English very well26 31.3% Speak English less than very well18.1% of residents speak other language at home 179 78.9% Speak English very well48 21.1% Speak English less than very well
English speakers - Foreign-born 24.8% of residents of Newton speak English at home.
3.7% of residents speak Spanish at home 277 37.7% Speak English very well457 62.3% Speak English less than very well71.5% of residents speak other language at home 9,475 66.8% Speak English very well4,708 33.2% Speak English less than very well
White (Caucasian) - Speak only English Native:
92.4% (49,051)Foreign-born:
28.8% (3,145)
White (Caucasian) - Speak another language Native:
7.6% (4,022)Foreign-born:
71.2% (7,794)
Black or African American - Speak only English Native:
85.3% (1,182)Foreign-born:
38.4% (311)
Black or African American - Speak another language Native:
13.1% (181)Foreign-born:
62.0% (502)
American Indian / Alaska Native - Speak only English Native:
10.9% (9)Foreign-born:
10.7% (14)
American Indian / Alaska Native - Speak another language Native:
100.0% (79)Foreign-born:
98.2% (128)
Asian - Speak only English Native:
57.6% (3,062)Foreign-born:
13.3% (938)
Asian - Speak another language Native:
42.4% (2,256)Foreign-born:
86.7% (6,125)
Other race - Speak only English Native:
59.9% (441)Foreign-born:
58.0% (178)
Other race - Speak another language Native:
40.1% (295)Foreign-born:
42.0% (129)
Two or more races - Speak only English Native:
89.1% (2,802)Foreign-born:
69.9% (542)
Two or more races - Speak another language Native:
10.9% (343)Foreign-born:
30.1% (233)
White alone - Speak only English Native:
92.8% (48,834)Foreign-born:
28.9% (3,145)
White alone - Speak another language Native:
7.2% (3,794)Foreign-born:
71.1% (7,734)
Hispanic or Latino - Speak only English Native:
51.4% (900)Foreign-born:
30.3% (273)
Hispanic or Latino - Speak another language Native:
48.6% (851)Foreign-born:
69.7% (627)
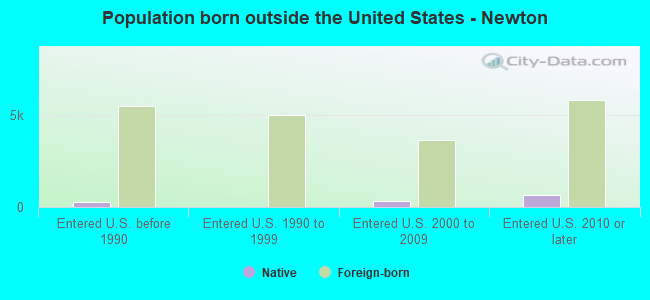
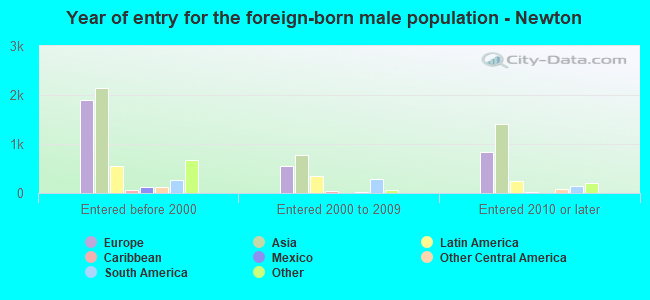
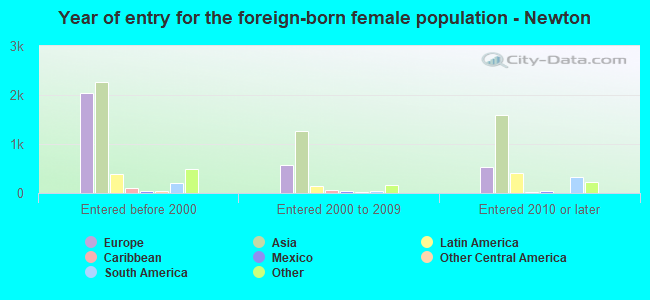
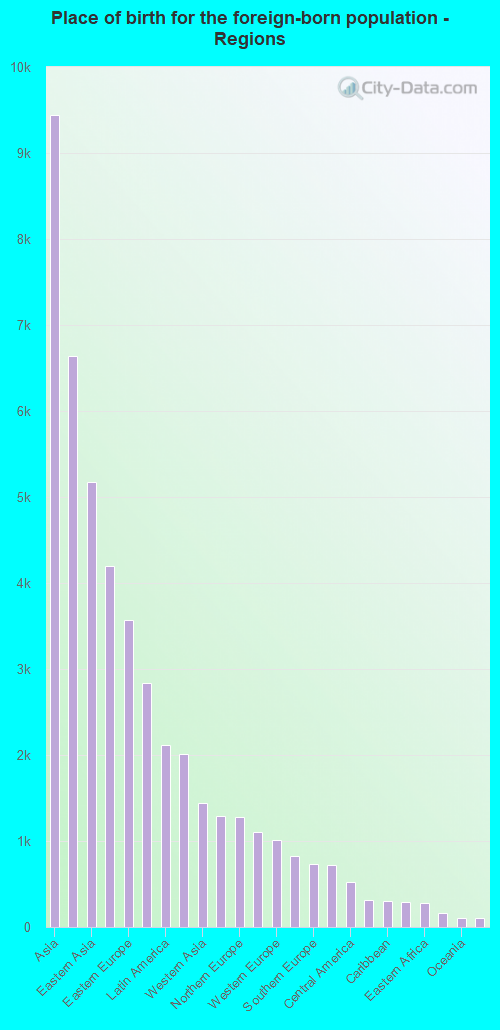
Foreign-born residents in Newton 20,132 residents are foreign born (10.3% Asia , 7.3% Europe , 2.3% Latin America ).
This city:
22.8%Massachusetts:
17.6%
Marital status for residents in Newton Marital status - White (Caucasian) population 15 years and over
Males 30.6% Never married60.7% Now married1.7% Separated4.8% Widowed2.2% DivorcedFemales 31.7% Never married53.1% Now married0.7% Separated4.8% Widowed9.8% DivorcedWomen who gave birth in the past 12 months Now married:
100.0% (254)Unmarried:
0.0% (0)
Women who did not give birth in the past 12 months Now married:
39.4% (5,355)Unmarried:
60.6% (8,237)
Marital status - Black or African American population 15 years and over
Males 60.8% Never married35.6% Now married0.0% Separated0.4% Widowed3.2% DivorcedFemales 52.3% Never married38.0% Now married1.1% Separated2.5% Widowed6.1% DivorcedWomen who did not give birth in the past 12 months Now married:
29.1% (156)Unmarried:
70.9% (379)
Marital status - American Indian / Alaska Native population 15 years and over
Males 53.1% Never married39.8% Now married0.0% Separated0.0% Widowed7.1% DivorcedFemales 38.6% Never married61.4% Now married0.0% Separated0.0% Widowed0.0% DivorcedWomen who did not give birth in the past 12 months Now married:
32.0% (19)Unmarried:
68.0% (40)
Marital status - Asian population 15 years and over
Males 27.0% Never married69.4% Now married1.0% Separated0.0% Widowed2.5% DivorcedFemales 29.1% Never married62.4% Now married0.0% Separated1.6% Widowed6.9% DivorcedWomen who gave birth in the past 12 months Now married:
100.0% (219)Unmarried:
0.0% (0)
Women who did not give birth in the past 12 months Now married:
51.4% (1,644)Unmarried:
48.6% (1,554)
Marital status - Other race population 15 years and over
Males 36.0% Never married23.9% Now married22.3% Separated0.0% Widowed17.8% DivorcedFemales 56.5% Never married36.5% Now married0.0% Separated2.5% Widowed4.5% DivorcedWomen who did not give birth in the past 12 months Now married:
32.2% (169)Unmarried:
67.8% (356)
Marital status - Two or more races population 15 years and over
Males 51.8% Never married47.2% Now married0.0% Separated0.0% Widowed1.1% DivorcedFemales 50.4% Never married41.5% Now married0.0% Separated0.0% Widowed8.1% DivorcedWomen who gave birth in the past 12 months Now married:
98.1% (70)Unmarried:
1.9% (1)
Women who did not give birth in the past 12 months Now married:
32.7% (563)Unmarried:
67.3% (1,157)
Marital status - White alone, not Hispanic / Latino population 15 years and over
Males 30.5% Never married60.7% Now married1.7% Separated4.8% Widowed2.3% DivorcedFemales 31.7% Never married53.0% Now married0.7% Separated4.7% Widowed9.8% DivorcedWomen who gave birth in the past 12 months Now married:
100.0% (254)Unmarried:
0.0% (0)
Women who did not give birth in the past 12 months Now married:
39.1% (5,252)Unmarried:
60.9% (8,189)
Marital status - Hispanic or Latino population 15 years and over
Males 44.0% Never married55.1% Now married0.0% Separated0.0% Widowed0.9% DivorcedFemales 52.5% Never married45.7% Now married0.0% Separated1.8% Widowed0.0% DivorcedWomen who gave birth in the past 12 months Now married:
95.0% (19)Unmarried:
5.0% (1)
Women who did not give birth in the past 12 months Now married:
24.5% (235)Unmarried:
75.5% (725)
Ancestries in Newton
3,521 8.1% Irish2,915 6.7% Italian2,398 5.5% Eastern European1,860 4.3% American1,652 3.8% Russian1,541 3.6% English1,193 2.8% European1,163 2.7% German1,057 2.4% Polish1,005 2.3% Israeli672 1.6% Brazilian634 1.5% Albanian585 1.4% Ukrainian554 1.3% Romanian471 1.1% Scottish344 0.8% French Canadian341 0.8% French276 0.6% Canadian238 0.6% Iranian231 0.5% Lithuanian218 0.5% Scotch-Irish191 0.4% Greek172 0.4% Norwegian159 0.4% Haitian151 0.3% British148 0.3% Northern European133 0.3% Armenian123 0.3% Ugandan122 0.3% Dutch118 0.3% Afghan101 0.2% Swiss92 0.2% African91 0.2% Danish89 0.2% Bulgarian85 0.2% Icelander81 0.2% Swedish78 0.2% Serbian70 0.2% Austrian68 0.2% Latvian65 0.2% Syrian63 0.1% Ethiopian56 0.1% Moroccan56 0.1% Kenyan51 0.1% Portuguese49 0.1% Nigerian46 0.1% Jamaican44 0.1% Belgian40 0.09% Lebanese40 0.09% U.S. Virgin Islander39 0.09% Liberian38 0.09% Hungarian38 0.09% Ghanaian37 0.09% Finnish37 0.09% Cypriot35 0.08% Slovak33 0.08% Turkish31 0.07% Egyptian29 0.07% Barbadian25 0.06% Iraqi22 0.05% Croatian20 0.05% South African18 0.04% Welsh12 0.03% Scandinavian9 0.02% New Zealander8 0.02% Estonian7 0.02% Trinidadian and Tobagonian5 0.01% Czech5 0.01% British West Indian
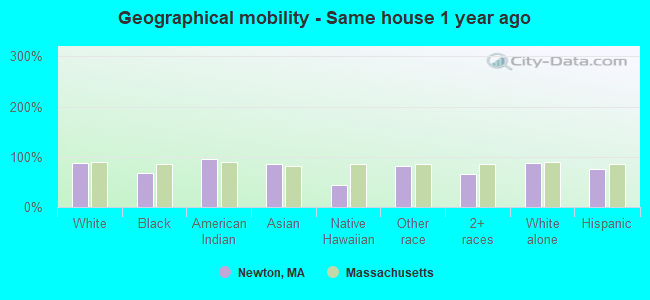
Geographical mobility in Newton Same house 1 year ago 58,478 88.6% White (Caucasian)1,358 68.0% Black or African American266 95.5% American Indian / Alaska Native10,972 85.9% Asian6 43.3% Native Hawaiian / Pacific Islander1,747 80.7% Other race2,902 66.4% Two or more races58,024 88.6% White alone, not Hispanic / Latino2,475 74.8% Hispanic or LatinoMoved within same county 2,066 3.1% White / Caucasian743 5.8% Asian51 2.4% Other race1,095 25.1% Two or more races2,066 3.2% White alone, not Hispanic / Latino165 5.0% Hispanic or LatinoMoved within same state 2,372 3.6% White / Caucasian168 8.4% Black or African American535 4.2% Asian187 8.7% Other race2,321 3.5% White alone, not Hispanic / Latino158 4.8% Hispanic or LatinoMoved from different state 2,211 3.3% White / Caucasian471 23.6% Black or African American7 2.5% American Indian / Alaska Native195 1.5% Asian8 56.7% Native Hawaiian / Pacific Islander63 2.9% Other race219 5.0% Two or more races2,211 3.4% White alone, not Hispanic / Latino379 11.5% Hispanic or LatinoMoved from abroad 885 1.3% White10 3.7% American Indian / Alaska Native334 2.6% Asian131 6.0% Other race155 3.5% Two or more races885 1.4% White alone, not Hispanic / Latino264 8.0% Hispanic or Latino
Children Nativity (place of birth) in Newton
Children under 6 years - Living with two parents Both parents native 2,284 100.0% NativeBoth parents foreign-born 1,004 93.1% Native74 6.9% Foreign-bornOne native, one foreign-born parent 279 100.0% NativeChildren under 6 years - Living with one parent Native parent 137 100.0% NativeChildren 6 to 17 years - Living with two parents Both parents native 5,644 100.0% NativeBoth parents foreign-born 2,525 76.3% Native786 23.7% Foreign-bornOne native, one foreign-born parent 2,803 97.8% Native64 2.2% Foreign-bornChildren 6 to 17 years - Living with one parent Native parent 1,594 100.0% NativeForeign-born parent 602 62.1% Native367 37.9% Foreign-born
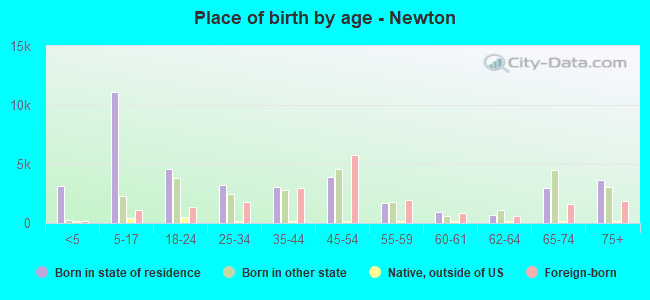
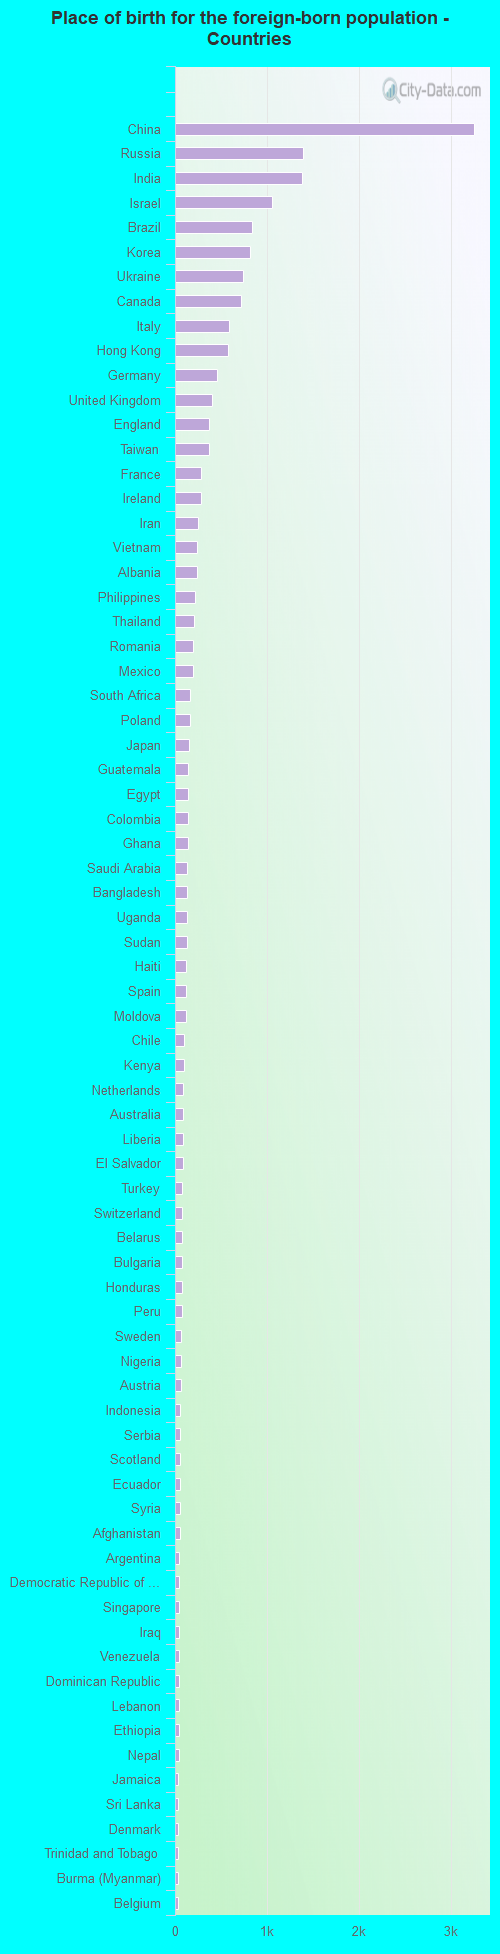
Place of birth for residents in Newton 9,447 Asia6,637 Europe5,171 Eastern Asia4,202 China3,567 Eastern Europe2,836 Americas2,119 Latin America2,012 South Central Asia1,439 Western Asia1,292 South America1,281 Northern Europe1,106 Africa1,012 Western Europe823 South Eastern Asia730 Southern Europe717 Northern America527 Central America317 Western Africa298 Caribbean296 Northern Africa276 Eastern Africa168 Southern Africa104 Oceania104 Australia and New Zealand Subregion47 Middle Africa3,252 China1,392 Russia1,377 India1,054 Israel839 Brazil814 Korea737 Ukraine717 Canada587 Italy575 Hong Kong459 Germany404 United Kingdom375 England375 Taiwan288 France287 Ireland251 Iran244 Vietnam234 Albania215 Philippines206 Thailand193 Romania193 Mexico168 South Africa164 Poland154 Japan146 Guatemala146 Egypt143 Colombia141 Ghana133 Saudi Arabia128 Bangladesh127 Uganda126 Sudan122 Haiti120 Spain120 Moldova94 Chile93 Kenya92 Netherlands89 Australia87 Liberia85 El Salvador80 Turkey78 Switzerland75 Belarus74 Bulgaria71 Honduras71 Peru65 Sweden64 Nigeria62 Austria58 Indonesia56 Serbia53 Scotland50 Ecuador49 Syria49 Afghanistan47 Argentina47 Democratic Republic of Congo (Zaire)47 Singapore45 Iraq45 Venezuela43 Dominican Republic42 Lebanon40 Ethiopia39 Nepal37 Jamaica36 Sri Lanka36 Denmark35 Trinidad and Tobago34 Burma (Myanmar)32 Belgium29 Panama28 Uzbekistan27 Kazakhstan27 Czechoslovakia26 Hungary23 Morocco22 Lithuania21 Greece17 Ivory Coast16 Malaysia16 Bahamas15 Zimbabwe14 New Zealand12 Cuba10 Azerbaijan10 Armenia9 Grenada7 United Arab Emirates5 Kuwait
Grandparents responsible for own grandchildren in Newton
Grandparents (30 to 59 years) White / Caucasian 10 35.4% Responsible for grandchildren18 64.6% Not responsible for grandchildrenTwo or more races 5 100.0% Not responsible for grandchildrenWhite alone, not Hispanic / Latino 11 35.9% Responsible for grandchildren20 64.1% Not responsible for grandchildrenHispanic or Latino 2 100.0% Not responsible for grandchildrenGrandparents (60 years and over) White / Caucasian 93 21.0% Responsible for grandchildren350 79.0% Not responsible for grandchildrenTwo or more races 10 100.0% Not responsible for grandchildrenWhite alone, not Hispanic / Latino 93 21.2% Responsible for grandchildren347 78.8% Not responsible for grandchildren