Races in Newburyport, Massachusetts (MA) Detailed Stats
Data:
Races - White alone (%)
Races - White alone (% change since 2000)
Races - Black alone (%)
Races - Black alone (% change since 2000)
Races - American Indian alone (%)
Races - American Indian alone (% change since 2000)
Races - Asian alone (%)
Races - Asian alone (% change since 2000)
Races - Hispanic (%)
Races - Hispanic (% change since 2000)
Races - Native Hawaiian and Other Pacific Islander alone (%)
Races - Native Hawaiian and Other Pacific Islander alone (% change since 2000)
Races - Two or more races(%)
Races - Two or more races(% change since 2000)
Races - Other race alone (%)
Races - Other race alone (% change since 2000)
Racial diversity
Place of birth - Born in state of residence (%)
Place of birth - Born in state of residence (%) - White
Place of birth - Born in state of residence (%) - Black or African American
Place of birth - Born in state of residence (%) - Asian
Place of birth - Born in state of residence (%) - Hispanic or Latino
Place of birth - Born in state of residence (%) - American Indian and Alaska Native
Place of birth - Born in state of residence (%) - Multirace
Place of birth - Born in state of residence (%) - Other Race
Place of birth - Born in other state (%)
Place of birth - Born in other state (%) - White
Place of birth - Born in other state (%) - Black or African American
Place of birth - Born in other state (%) - Asian
Place of birth - Born in other state (%) - Hispanic or Latino
Place of birth - Born in other state (%) - American Indian and Alaska Native
Place of birth - Born in other state (%) - Multirace
Place of birth - Born in other state (%) - Other Race
Place of birth - Native, outside of US (%)
Place of birth - Native, outside of US (%) - White
Place of birth - Native, outside of US (%) - Black or African American
Place of birth - Native, outside of US (%) - Asian
Place of birth - Native, outside of US (%) - Hispanic or Latino
Place of birth - Native, outside of US (%) - American Indian and Alaska Native
Place of birth - Native, outside of US (%) - Multirace
Place of birth - Native, outside of US (%) - Other Race
Place of birth - Foreign born (%)
Place of birth - Foreign born (%) - White
Place of birth - Foreign born (%) - Black or African American
Place of birth - Foreign born (%) - Asian
Place of birth - Foreign born (%) - Hispanic or Latino
Place of birth - Foreign born (%) - American Indian and Alaska Native
Place of birth - Foreign born (%) - Multirace
Place of birth - Foreign born (%) - Other Race
Residents speaking English at home (%)
Residents speaking English at home - Born in the United States (%)
Residents speaking English at home - Native, born elsewhere (%)
Residents speaking English at home - Foreign born (%)
Residents speaking Spanish at home (%)
Residents speaking Spanish at home - Born in the United States (%)
Residents speaking Spanish at home - Native, born elsewhere (%)
Residents speaking Spanish at home - Foreign born (%)
Residents speaking other language at home (%)
Residents speaking other language at home - Born in the United States (%)
Residents speaking other language at home - Native, born elsewhere (%)
Residents speaking other language at home - Foreign born (%)
Marital status - Never married (%)
Marital status - Now married (%)
Marital status - Separated (%)
Marital status - Widowed (%)
Marital status - Divorced (%)
Ancestries Reported - Arab (%)
Ancestries Reported - Czech (%)
Ancestries Reported - Danish (%)
Ancestries Reported - Dutch (%)
Ancestries Reported - English (%)
Ancestries Reported - French (%)
Ancestries Reported - French Canadian (%)
Ancestries Reported - German (%)
Ancestries Reported - Greek (%)
Ancestries Reported - Hungarian (%)
Ancestries Reported - Irish (%)
Ancestries Reported - Italian (%)
Ancestries Reported - Lithuanian (%)
Ancestries Reported - Norwegian (%)
Ancestries Reported - Polish (%)
Ancestries Reported - Portuguese (%)
Ancestries Reported - Russian (%)
Ancestries Reported - Scotch-Irish (%)
Ancestries Reported - Scottish (%)
Ancestries Reported - Slovak (%)
Ancestries Reported - Subsaharan African (%)
Ancestries Reported - Swedish (%)
Ancestries Reported - Swiss (%)
Ancestries Reported - Ukrainian (%)
Ancestries Reported - United States (%)
Ancestries Reported - Welsh (%)
Ancestries Reported - West Indian (%)
Ancestries Reported - Other (%)
Geographical mobility - Same house 1 year ago (%)
Geographical mobility - Same house 1 year ago (%) - White
Geographical mobility - Same house 1 year ago (%) - Black or African American
Geographical mobility - Same house 1 year ago (%) - Asian
Geographical mobility - Same house 1 year ago (%) - Hispanic or Latino
Geographical mobility - Same house 1 year ago (%) - American Indian and Alaska Native
Geographical mobility - Same house 1 year ago (%) - Multirace
Geographical mobility - Same house 1 year ago (%) - Other Race
Geographical mobility - Moved within same county (%)
Geographical mobility - Moved within same county (%) - White
Geographical mobility - Moved within same county (%) - Black or African American
Geographical mobility - Moved within same county (%) - Asian
Geographical mobility - Moved within same county (%) - Hispanic or Latino
Geographical mobility - Moved within same county (%) - American Indian and Alaska Native
Geographical mobility - Moved within same county (%) - Multirace
Geographical mobility - Moved within same county (%) - Other Race
Geographical mobility - Moved from different county within same state (%)
Geographical mobility - Moved from different county within same state (%) - White
Geographical mobility - Moved from different county within same state (%) - Black or African American
Geographical mobility - Moved from different county within same state (%) - Asian
Geographical mobility - Moved from different county within same state (%) - Hispanic or Latino
Geographical mobility - Moved from different county within same state (%) - American Indian and Alaska Native
Geographical mobility - Moved from different county within same state (%) - Multirace
Geographical mobility - Moved from different county within same state (%) - Other Race
Geographical mobility - Moved from different state (%)
Geographical mobility - Moved from different state (%) - White
Geographical mobility - Moved from different state (%) - Black or African American
Geographical mobility - Moved from different state (%) - Asian
Geographical mobility - Moved from different state (%) - Hispanic or Latino
Geographical mobility - Moved from different state (%) - American Indian and Alaska Native
Geographical mobility - Moved from different state (%) - Multirace
Geographical mobility - Moved from different state (%) - Other Race
Geographical mobility - Moved from abroad (%)
Geographical mobility - Moved from abroad (%) - White
Geographical mobility - Moved from abroad (%) - Black or African American
Geographical mobility - Moved from abroad (%) - Asian
Geographical mobility - Moved from abroad (%) - Hispanic or Latino
Geographical mobility - Moved from abroad (%) - American Indian and Alaska Native
Geographical mobility - Moved from abroad (%) - Multirace
Geographical mobility - Moved from abroad (%) - Other Race
Place of birth for the foreign-born population - Ireland (%)
Place of birth for the foreign-born population - Denmark (%)
Place of birth for the foreign-born population - Norway (%)
Place of birth for the foreign-born population - Sweden (%)
Place of birth for the foreign-born population - United Kingdom (%)
Place of birth for the foreign-born population - England (%)
Place of birth for the foreign-born population - Scotland (%)
Place of birth for the foreign-born population - Other Northern Europe (%)
Place of birth for the foreign-born population - Austria (%)
Place of birth for the foreign-born population - Belgium (%)
Place of birth for the foreign-born population - France (%)
Place of birth for the foreign-born population - Germany (%)
Place of birth for the foreign-born population - Netherlands (%)
Place of birth for the foreign-born population - Switzerland (%)
Place of birth for the foreign-born population - Other Western Europe (%)
Place of birth for the foreign-born population - Greece (%)
Place of birth for the foreign-born population - Italy (%)
Place of birth for the foreign-born population - Portugal (%)
Place of birth for the foreign-born population - Spain (%)
Place of birth for the foreign-born population - Other Southern Europe (%)
Place of birth for the foreign-born population - Albania (%)
Place of birth for the foreign-born population - Belarus (%)
Place of birth for the foreign-born population - Bosnia and Herzegovina (%)
Place of birth for the foreign-born population - Bulgaria (%)
Place of birth for the foreign-born population - Croatia (%)
Place of birth for the foreign-born population - Czechoslovakia (%)
Place of birth for the foreign-born population - Hungary (%)
Place of birth for the foreign-born population - Latvia (%)
Place of birth for the foreign-born population - Lithuania (%)
Place of birth for the foreign-born population - North Macedonia (Macedonia) (%)
Place of birth for the foreign-born population - Moldova (%)
Place of birth for the foreign-born population - Poland (%)
Place of birth for the foreign-born population - Romania (%)
Place of birth for the foreign-born population - Russia (%)
Place of birth for the foreign-born population - Serbia (%)
Place of birth for the foreign-born population - Ukraine (%)
Place of birth for the foreign-born population - Other Eastern Europe (%)
Place of birth for the foreign-born population - China (%)
Place of birth for the foreign-born population - Hong Kong (%)
Place of birth for the foreign-born population - Taiwan (%)
Place of birth for the foreign-born population - Japan (%)
Place of birth for the foreign-born population - Korea (%)
Place of birth for the foreign-born population - Other Eastern Asia (%)
Place of birth for the foreign-born population - Afghanistan (%)
Place of birth for the foreign-born population - Bangladesh (%)
Place of birth for the foreign-born population - India (%)
Place of birth for the foreign-born population - Iran (%)
Place of birth for the foreign-born population - Kazakhstan (%)
Place of birth for the foreign-born population - Nepal (%)
Place of birth for the foreign-born population - Pakistan (%)
Place of birth for the foreign-born population - Sri Lanka (%)
Place of birth for the foreign-born population - Uzbekistan (%)
Place of birth for the foreign-born population - Other South Central Asia (%)
Place of birth for the foreign-born population - Burma (%)
Place of birth for the foreign-born population - Cambodia (%)
Place of birth for the foreign-born population - Indonesia (%)
Place of birth for the foreign-born population - Laos (%)
Place of birth for the foreign-born population - Malaysia (%)
Place of birth for the foreign-born population - Philippines (%)
Place of birth for the foreign-born population - Singapore (%)
Place of birth for the foreign-born population - Thailand (%)
Place of birth for the foreign-born population - Vietnam (%)
Place of birth for the foreign-born population - Other South Eastern Asia (%)
Place of birth for the foreign-born population - Armenia (%)
Place of birth for the foreign-born population - Iraq (%)
Place of birth for the foreign-born population - Israel (%)
Place of birth for the foreign-born population - Jordan (%)
Place of birth for the foreign-born population - Kuwait (%)
Place of birth for the foreign-born population - Lebanon (%)
Place of birth for the foreign-born population - Saudi Arabia (%)
Place of birth for the foreign-born population - Syria (%)
Place of birth for the foreign-born population - Turkey (%)
Place of birth for the foreign-born population - Yemen (%)
Place of birth for the foreign-born population - Other Western Asia (%)
Place of birth for the foreign-born population - Eritrea (%)
Place of birth for the foreign-born population - Ethiopia (%)
Place of birth for the foreign-born population - Kenya (%)
Place of birth for the foreign-born population - Somalia (%)
Place of birth for the foreign-born population - Uganda (%)
Place of birth for the foreign-born population - Zimbabwe (%)
Place of birth for the foreign-born population - Other Eastern Africa (%)
Place of birth for the foreign-born population - Cameroon (%)
Place of birth for the foreign-born population - Congo (%)
Place of birth for the foreign-born population - Democratic Republic of Congo (Zaire) (%)
Place of birth for the foreign-born population - Other Middle Africa (%)
Place of birth for the foreign-born population - Egypt (%)
Place of birth for the foreign-born population - Morocco (%)
Place of birth for the foreign-born population - Sudan (%)
Place of birth for the foreign-born population - Other Northern Africa (%)
Place of birth for the foreign-born population - South Africa (%)
Place of birth for the foreign-born population - Other Southern Africa (%)
Place of birth for the foreign-born population - Cabo Verde (%)
Place of birth for the foreign-born population - Ghana (%)
Place of birth for the foreign-born population - Liberia (%)
Place of birth for the foreign-born population - Nigeria (%)
Place of birth for the foreign-born population - Senegal (%)
Place of birth for the foreign-born population - Sierra Leone (%)
Place of birth for the foreign-born population - Other Western Africa (%)
Place of birth for the foreign-born population - Australia (%)
Place of birth for the foreign-born population - New Zealand (%)
Place of birth for the foreign-born population - Fiji (%)
Place of birth for the foreign-born population - Micronesia (%)
Place of birth for the foreign-born population - Bahamas (%)
Place of birth for the foreign-born population - Barbados (%)
Place of birth for the foreign-born population - Cuba (%)
Place of birth for the foreign-born population - Dominica (%)
Place of birth for the foreign-born population - Dominican Republic (%)
Place of birth for the foreign-born population - Grenada (%)
Place of birth for the foreign-born population - Haiti (%)
Place of birth for the foreign-born population - Jamaica (%)
Place of birth for the foreign-born population - St. Vincent and the Grenadines (%)
Place of birth for the foreign-born population - Trinidad and Tobago (%)
Place of birth for the foreign-born population - West Indies (%)
Place of birth for the foreign-born population - Other Caribbean (%)
Place of birth for the foreign-born population - Belize (%)
Place of birth for the foreign-born population - Costa Rica (%)
Place of birth for the foreign-born population - El Salvador (%)
Place of birth for the foreign-born population - Guatemala (%)
Place of birth for the foreign-born population - Honduras (%)
Place of birth for the foreign-born population - Mexico (%)
Place of birth for the foreign-born population - Nicaragua (%)
Place of birth for the foreign-born population - Panama (%)
Place of birth for the foreign-born population - Other Central America (%)
Place of birth for the foreign-born population - Argentina (%)
Place of birth for the foreign-born population - Bolivia (%)
Place of birth for the foreign-born population - Brazil (%)
Place of birth for the foreign-born population - Chile (%)
Place of birth for the foreign-born population - Colombia (%)
Place of birth for the foreign-born population - Ecuador (%)
Place of birth for the foreign-born population - Guyana (%)
Place of birth for the foreign-born population - Peru (%)
Place of birth for the foreign-born population - Uruguay (%)
Place of birth for the foreign-born population - Venezuela (%)
Place of birth for the foreign-born population - Other South America (%)
Place of birth for the foreign-born population - Canada (%)
Place of birth for the foreign-born population - Other Northern America (%)
Place of birth for the foreign-born population - Other (%)
Latest news about races in Newburyport, MA collected exclusively by city-data.com from local newspapers, TV, and radio stations
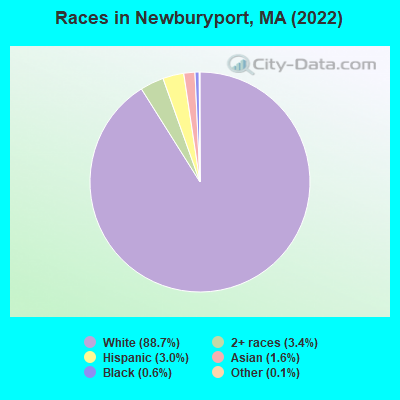
According to 2022 data, the most numerous races in Newburyport, MA are White alone (16,287 residents), Hispanic (547 residents), and Asian alone (300 residents). 91.6% of Newburyport residents speak English at home. 7.8% of Newburyport, MA residents are foreign-born (3.0% born in Europe, 2.4% born in Latin America, 1.4% born in Asia), which is 129.5% less than the foreign-born rate of 18.0% across the entire state of Massachusetts.
Race distribution in Newburyport
2000 2022
5,198,359 81.9% White alone 428,729 6.8% Hispanic 318,329 5.0% Black alone 236,786 3.7% Asian alone 110,338 1.7% Two or more races 43,586 0.7% Other race alone 11,264 0.2% American Indian alone 1,706 0.03% Native Hawaiian and Other
4,676,627 67.0% White alone 911,038 13.0% Hispanic 501,463 7.2% Asian alone 459,740 6.6% Black alone 341,889 4.9% Two or more races 84,403 1.2% Other race alone 5,838 0.08% American Indian alone 976 0.01% Native Hawaiian and Other
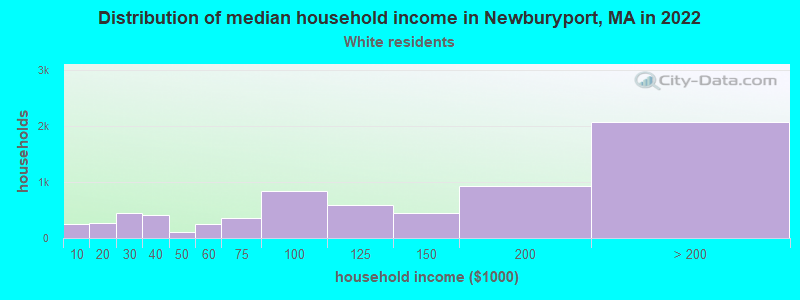
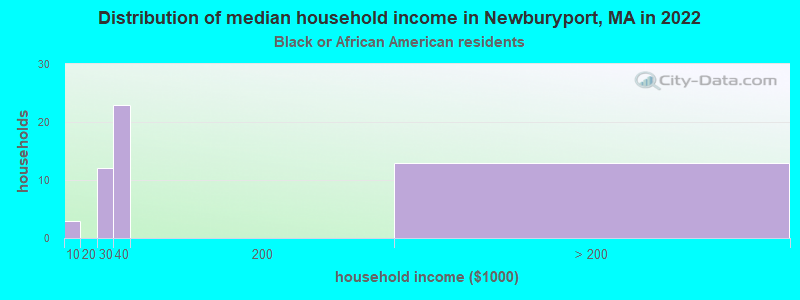
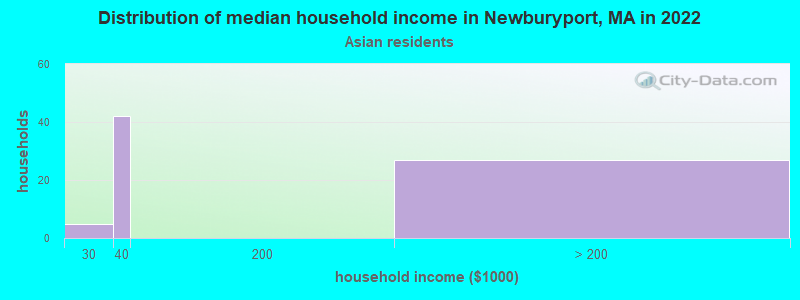
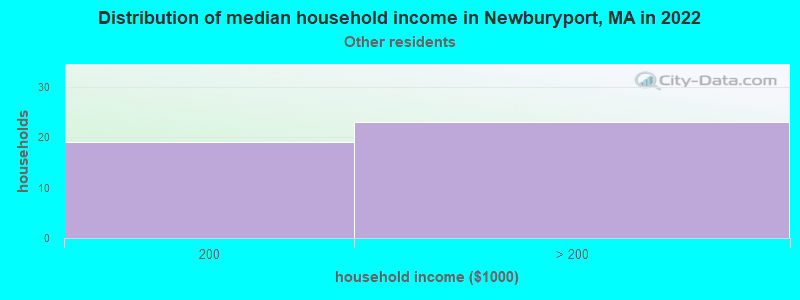
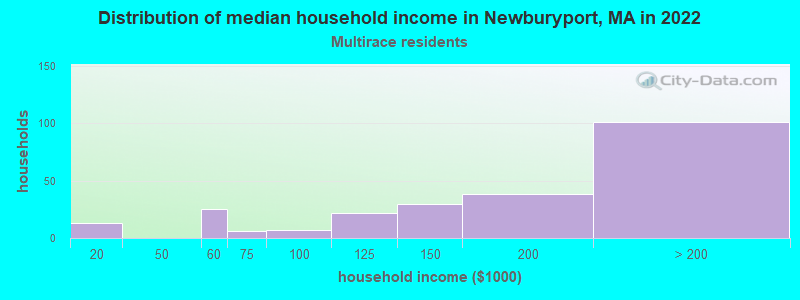
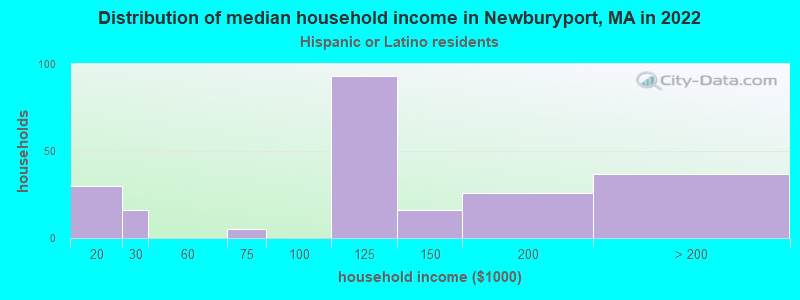
Income and house value in Newburyport Median household income in 2022 $127,232 White non-Hispanic householdersover $200,000 Two or more races householders$126,814 Hispanic or Latino race householdersMedian 2022 house value $836,069 White Non-Hispanic householders$617,176 American Indian or Alaska Native householders $740,612 Asian householders$740,612 Some other race householders$749,828 Two or more races householders$915,396 Hispanic or Latino householders
Median age by race in Newburyport
48.4 Median age for White residents48.4 48.7 39.6 Median age for Black or African American residents37.4 61.7 -713,541,666.0 Median age for American Indian / Alaska Native residents-679,156,908.0 -364,551,862.7 40.7 Median age for Asian residents41.6 38.5 -514,227,641.8 Median age for Native Hawaiian / Pacific Islander residents-666,666,666.0 -508,717,948.2 55.6 Median age for Other race residents55.8 -702,645,501.9 31.1 Median age for Two or more races residents21.5 45.7 47.9 Median age for White alone residents47.6 48.8 32.4 Median age for Hispanic or Latino residents27.2 34.3
Owner/renter occupied households by race in Newburyport
House owners and renters - White residents 5,570 79.6% Owner occupied1,423 20.4% Renter occupiedHouse owners and renters - Black or African American residents 27 65.4% Owner occupied14 34.6% Renter occupiedHouse owners and renters - Asian residents 34 39.9% Owner occupied52 60.1% Renter occupiedHouse owners and renters - Other race residents 35 100.0% Owner occupiedHouse owners and renters - Two or more races residents 186 70.6% Owner occupied77 29.4% Renter occupiedHouse owners and renters - White alone residents 5,570 78.9% Owner occupied1,492 21.1% Renter occupiedHouse owners and renters - Hispanic or Latino residents 158 68.0% Owner occupied74 32.0% Renter occupied
Language usage in Newburyport
English speakers - Total 91.6% of residents of Newburyport speak English at home.
1.2% of residents speak Spanish at home 170 82.9% Speak English very well35 17.1% Speak English less than very well5.8% of residents speak other language at home 543 53.1% Speak English very well479 46.9% Speak English less than very well
English speakers - Born in the United States 99.2% of residents of Newburyport speak English at home.
0.1% of residents speak Spanish at home 6 100.0% Speak English very well1.2% of residents speak other language at home 26 41.3% Speak English very well37 58.7% Speak English less than very well
English speakers - Native, born elsewhere 75.8% of residents of Newburyport speak English at home.
32.0% of residents speak Spanish at home 72 97.3% Speak English very well2 2.7% Speak English less than very well3.9% of residents speak other language at home 6 66.7% Speak English very well3 33.3% Speak English less than very well
English speakers - Foreign-born 40.4% of residents of Newburyport speak English at home.
5.8% of residents speak Spanish at home 54 62.8% Speak English very well32 37.2% Speak English less than very well50.4% of residents speak other language at home 337 44.8% Speak English very well416 55.2% Speak English less than very well
White (Caucasian) - Speak only English Native:
99.4% (14,733)Foreign-born:
56.5% (381)
White (Caucasian) - Speak another language Native:
1.5% (225)Foreign-born:
46.8% (316)
Black or African American - Speak only English Native:
93.8% (68)Foreign-born:
22.2% (6)
Black or African American - Speak another language Native:
9.3% (7)Foreign-born:
76.2% (19)
Asian - Speak only English Native:
38.6% (17)Foreign-born:
20.7% (51)
Asian - Speak another language Native:
57.7% (26)Foreign-born:
77.5% (190)
Other race - Speak another language Native:
70.0% (23)Foreign-born:
99.8% (30)
Two or more races - Speak only English Native:
92.8% (613)Foreign-born:
36.4% (80)
Two or more races - Speak another language Native:
1.2% (8)Foreign-born:
72.2% (160)
White alone - Speak only English Native:
98.4% (14,708)Foreign-born:
51.8% (419)
White alone - Speak another language Native:
1.5% (227)Foreign-born:
47.3% (382)
Hispanic or Latino - Speak only English Native:
73.6% (278)Foreign-born:
35.8% (52)
Hispanic or Latino - Speak another language Native:
28.9% (109)Foreign-born:
66.4% (97)
Foreign-born residents in Newburyport 1,441 residents are foreign born (3.0% Europe , 2.4% Latin America , 1.4% Asia ).
This city:
7.8%Massachusetts:
17.6%
Marital status for residents in Newburyport Marital status - White (Caucasian) population 15 years and over
Males 20.7% Never married68.3% Now married0.4% Separated1.7% Widowed9.0% DivorcedFemales 23.8% Never married53.4% Now married0.4% Separated7.8% Widowed14.6% DivorcedWomen who gave birth in the past 12 months Now married:
97.1% (89)Unmarried:
2.9% (3)
Women who did not give birth in the past 12 months Now married:
47.2% (1,441)Unmarried:
52.8% (1,613)
Marital status - Black or African American population 15 years and over
Males 2.0% Never married98.0% Now married0.0% Separated0.0% Widowed0.0% DivorcedFemales 26.9% Never married26.9% Now married0.0% Separated0.0% Widowed46.2% DivorcedWomen who did not give birth in the past 12 months Now married:
63.6% (13)Unmarried:
36.4% (7)
Marital status - Asian population 15 years and over
Males 32.6% Never married62.1% Now married0.0% Separated0.0% Widowed5.3% DivorcedFemales 0.0% Never married100.0% Now married0.0% Separated0.0% Widowed0.0% DivorcedWomen who gave birth in the past 12 months Now married:
100.0% (5)Unmarried:
0.0% (0)
Women who did not give birth in the past 12 months Now married:
100.0% (63)Unmarried:
0.0% (0)
Marital status - Other race population 15 years and over
Males 0.0% Never married100.0% Now married0.0% Separated0.0% Widowed0.0% DivorcedFemales 0.0% Never married100.0% Now married0.0% Separated0.0% Widowed0.0% DivorcedWomen who did not give birth in the past 12 months Now married:
100.0% (13)Unmarried:
0.0% (0)
Marital status - Two or more races population 15 years and over
Males 30.6% Never married42.1% Now married0.0% Separated0.0% Widowed27.3% DivorcedFemales 26.8% Never married51.6% Now married0.0% Separated6.6% Widowed15.0% DivorcedWomen who gave birth in the past 12 months Now married:
100.0% (8)Unmarried:
0.0% (0)
Women who did not give birth in the past 12 months Now married:
50.8% (84)Unmarried:
49.2% (81)
Marital status - White alone, not Hispanic / Latino population 15 years and over
Males 20.7% Never married68.2% Now married0.4% Separated1.7% Widowed9.0% DivorcedFemales 24.2% Never married54.3% Now married0.4% Separated7.4% Widowed13.7% DivorcedWomen who gave birth in the past 12 months Now married:
97.1% (94)Unmarried:
2.9% (3)
Women who did not give birth in the past 12 months Now married:
48.6% (1,508)Unmarried:
51.4% (1,594)
Marital status - Hispanic or Latino population 15 years and over
Males 39.7% Never married60.3% Now married0.0% Separated0.0% Widowed0.0% DivorcedFemales 20.4% Never married28.8% Now married0.0% Separated16.2% Widowed34.6% DivorcedWomen who did not give birth in the past 12 months Now married:
26.1% (62)Unmarried:
73.9% (175)
Ancestries in Newburyport
1,599 22.7% Irish913 13.0% Italian677 9.6% English399 5.7% European317 4.5% German300 4.3% French261 3.7% Portuguese230 3.3% American218 3.1% Greek175 2.5% Scottish168 2.4% Polish163 2.3% French Canadian114 1.6% Brazilian96 1.4% Russian67 1.0% British63 0.9% Scotch-Irish60 0.9% Lithuanian36 0.5% Eastern European32 0.5% Lebanese32 0.5% Canadian29 0.4% Austrian24 0.3% Swedish22 0.3% Swiss19 0.3% Kenyan16 0.2% Armenian16 0.2% Ukrainian12 0.2% Czech12 0.2% Welsh10 0.1% Dutch8 0.1% Slovene6 0.09% Danish5 0.07% Norwegian5 0.07% Slovak4 0.06% Latvian
Children Nativity (place of birth) in Newburyport
Children under 6 years - Living with two parents Both parents native 556 100.0% NativeOne native, one foreign-born parent 174 100.0% NativeChildren under 6 years - Living with one parent Native parent 112 100.0% NativeChildren 6 to 17 years - Living with two parents Both parents native 2,210 99.8% Native5 0.2% Foreign-bornBoth parents foreign-born 85 100.0% Foreign-bornOne native, one foreign-born parent 291 100.0% NativeChildren 6 to 17 years - Living with one parent Native parent 485 100.0% NativeForeign-born parent 11 48.5% Native12 51.5% Foreign-born