Races in Nelson-Tate-Marble Hill, Georgia (GA) Detailed Stats
Ancestries, Foreign-born residents, place of birth
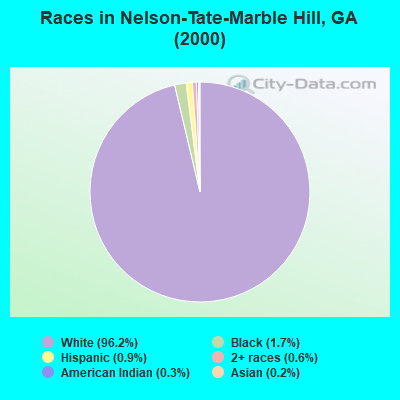
Race distribution in Nelson-Tate-Marble Hill

- 8,32696.2%White alone
- 1511.7%Black alone
- 740.9%Hispanic
- 500.6%Two or more races
- 300.3%American Indian alone
- 190.2%Asian alone
- 50.06%Other race alone
- 20.02%Native Hawaiian and Other
Pacific Islander alone
2000
2022
-
- 5,128,66162.6%White alone
- 2,331,46528.5%Black alone
- 435,2275.3%Hispanic
- 171,5132.1%Asian alone
- 87,3641.1%Two or more races
- 17,6700.2%American Indian alone
- 11,2750.1%Other race alone
- 3,2780.04%Native Hawaiian and Other
Pacific Islander alone

-
- 5,415,65749.6%White alone
- 3,349,24030.7%Black alone
- 1,132,60410.4%Hispanic
- 479,1564.4%Asian alone
- 462,9234.2%Two or more races
- 54,4160.5%Other race alone
- 11,9230.1%American Indian alone
- 6,9570.06%Native Hawaiian and Other
Pacific Islander alone

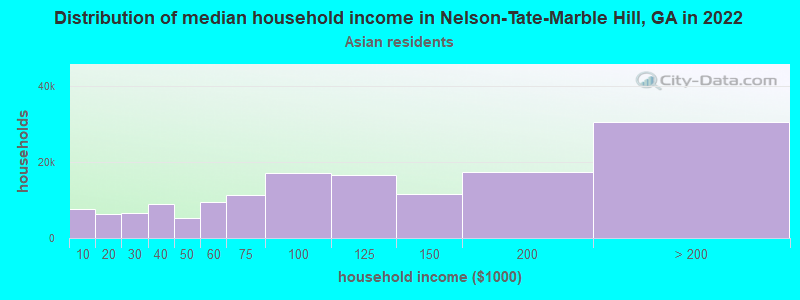
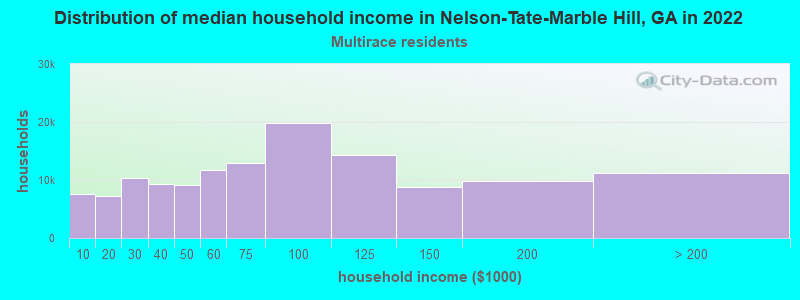
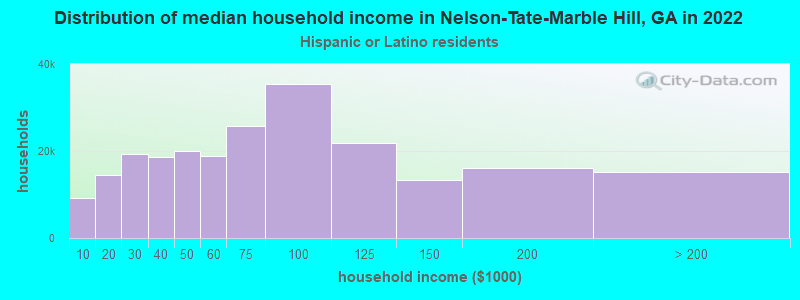
Income and house value in Nelson-Tate-Marble Hill
- Median household income in 2022
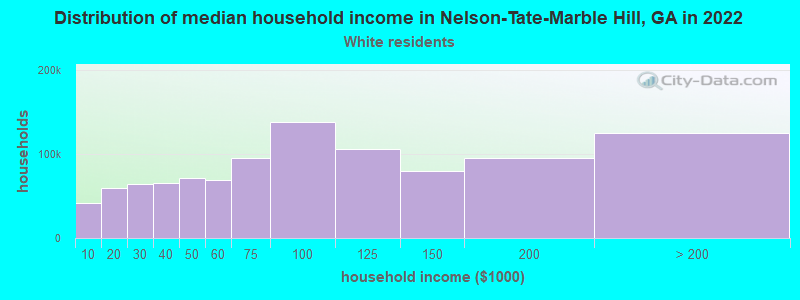
- $74,828White non-Hispanic householders
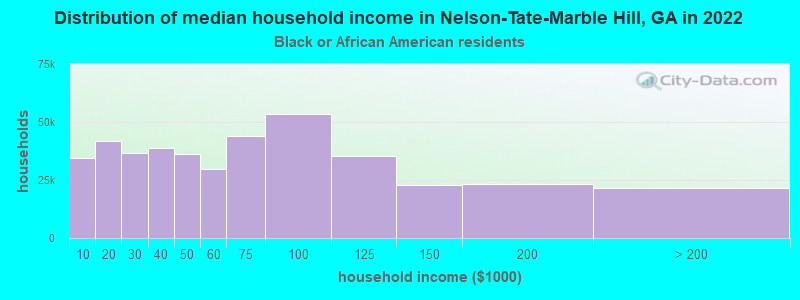
- $36,733Black householders
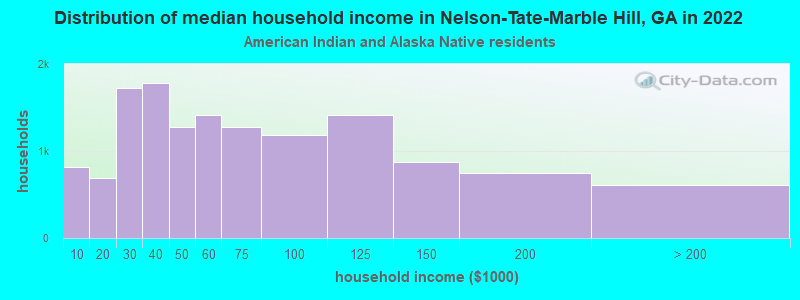
- $27,521American Indian and Alaska Native householders
- $199,678Asian householders
- $126,208Some other race householders
- $76,041Two or more races householders
- $111,264Hispanic or Latino race householders
- Median 2022 house value
- $429,263White Non-Hispanic householders
- $86,672Black or African American householders
- $236,378American Indian or Alaska Native householders
- $506,480Some other race householders
- $39,396Two or more races householders
- $506,480Hispanic or Latino householders
Household income for White non-Hispanic householders
Household income for Black householders
Household income for American Indian and Alaska Native householders
Household income for Asian householders
Household income for Two or more races householders
Household income for Hispanic or Latino race householders
Zip code: 30143