Races in Mount Washington, Kentucky (KY) Detailed Stats
Data:
Races - White alone (%)
Races - White alone (% change since 2000)
Races - Black alone (%)
Races - Black alone (% change since 2000)
Races - American Indian alone (%)
Races - American Indian alone (% change since 2000)
Races - Asian alone (%)
Races - Asian alone (% change since 2000)
Races - Hispanic (%)
Races - Hispanic (% change since 2000)
Races - Native Hawaiian and Other Pacific Islander alone (%)
Races - Native Hawaiian and Other Pacific Islander alone (% change since 2000)
Races - Two or more races(%)
Races - Two or more races(% change since 2000)
Races - Other race alone (%)
Races - Other race alone (% change since 2000)
Racial diversity
Place of birth - Born in state of residence (%)
Place of birth - Born in state of residence (%) - White
Place of birth - Born in state of residence (%) - Black or African American
Place of birth - Born in state of residence (%) - Asian
Place of birth - Born in state of residence (%) - Hispanic or Latino
Place of birth - Born in state of residence (%) - American Indian and Alaska Native
Place of birth - Born in state of residence (%) - Multirace
Place of birth - Born in state of residence (%) - Other Race
Place of birth - Born in other state (%)
Place of birth - Born in other state (%) - White
Place of birth - Born in other state (%) - Black or African American
Place of birth - Born in other state (%) - Asian
Place of birth - Born in other state (%) - Hispanic or Latino
Place of birth - Born in other state (%) - American Indian and Alaska Native
Place of birth - Born in other state (%) - Multirace
Place of birth - Born in other state (%) - Other Race
Place of birth - Native, outside of US (%)
Place of birth - Native, outside of US (%) - White
Place of birth - Native, outside of US (%) - Black or African American
Place of birth - Native, outside of US (%) - Asian
Place of birth - Native, outside of US (%) - Hispanic or Latino
Place of birth - Native, outside of US (%) - American Indian and Alaska Native
Place of birth - Native, outside of US (%) - Multirace
Place of birth - Native, outside of US (%) - Other Race
Place of birth - Foreign born (%)
Place of birth - Foreign born (%) - White
Place of birth - Foreign born (%) - Black or African American
Place of birth - Foreign born (%) - Asian
Place of birth - Foreign born (%) - Hispanic or Latino
Place of birth - Foreign born (%) - American Indian and Alaska Native
Place of birth - Foreign born (%) - Multirace
Place of birth - Foreign born (%) - Other Race
Residents speaking English at home (%)
Residents speaking English at home - Born in the United States (%)
Residents speaking English at home - Native, born elsewhere (%)
Residents speaking English at home - Foreign born (%)
Residents speaking Spanish at home (%)
Residents speaking Spanish at home - Born in the United States (%)
Residents speaking Spanish at home - Native, born elsewhere (%)
Residents speaking Spanish at home - Foreign born (%)
Residents speaking other language at home (%)
Residents speaking other language at home - Born in the United States (%)
Residents speaking other language at home - Native, born elsewhere (%)
Residents speaking other language at home - Foreign born (%)
Marital status - Never married (%)
Marital status - Now married (%)
Marital status - Separated (%)
Marital status - Widowed (%)
Marital status - Divorced (%)
Ancestries Reported - Arab (%)
Ancestries Reported - Czech (%)
Ancestries Reported - Danish (%)
Ancestries Reported - Dutch (%)
Ancestries Reported - English (%)
Ancestries Reported - French (%)
Ancestries Reported - French Canadian (%)
Ancestries Reported - German (%)
Ancestries Reported - Greek (%)
Ancestries Reported - Hungarian (%)
Ancestries Reported - Irish (%)
Ancestries Reported - Italian (%)
Ancestries Reported - Lithuanian (%)
Ancestries Reported - Norwegian (%)
Ancestries Reported - Polish (%)
Ancestries Reported - Portuguese (%)
Ancestries Reported - Russian (%)
Ancestries Reported - Scotch-Irish (%)
Ancestries Reported - Scottish (%)
Ancestries Reported - Slovak (%)
Ancestries Reported - Subsaharan African (%)
Ancestries Reported - Swedish (%)
Ancestries Reported - Swiss (%)
Ancestries Reported - Ukrainian (%)
Ancestries Reported - United States (%)
Ancestries Reported - Welsh (%)
Ancestries Reported - West Indian (%)
Ancestries Reported - Other (%)
Geographical mobility - Same house 1 year ago (%)
Geographical mobility - Same house 1 year ago (%) - White
Geographical mobility - Same house 1 year ago (%) - Black or African American
Geographical mobility - Same house 1 year ago (%) - Asian
Geographical mobility - Same house 1 year ago (%) - Hispanic or Latino
Geographical mobility - Same house 1 year ago (%) - American Indian and Alaska Native
Geographical mobility - Same house 1 year ago (%) - Multirace
Geographical mobility - Same house 1 year ago (%) - Other Race
Geographical mobility - Moved within same county (%)
Geographical mobility - Moved within same county (%) - White
Geographical mobility - Moved within same county (%) - Black or African American
Geographical mobility - Moved within same county (%) - Asian
Geographical mobility - Moved within same county (%) - Hispanic or Latino
Geographical mobility - Moved within same county (%) - American Indian and Alaska Native
Geographical mobility - Moved within same county (%) - Multirace
Geographical mobility - Moved within same county (%) - Other Race
Geographical mobility - Moved from different county within same state (%)
Geographical mobility - Moved from different county within same state (%) - White
Geographical mobility - Moved from different county within same state (%) - Black or African American
Geographical mobility - Moved from different county within same state (%) - Asian
Geographical mobility - Moved from different county within same state (%) - Hispanic or Latino
Geographical mobility - Moved from different county within same state (%) - American Indian and Alaska Native
Geographical mobility - Moved from different county within same state (%) - Multirace
Geographical mobility - Moved from different county within same state (%) - Other Race
Geographical mobility - Moved from different state (%)
Geographical mobility - Moved from different state (%) - White
Geographical mobility - Moved from different state (%) - Black or African American
Geographical mobility - Moved from different state (%) - Asian
Geographical mobility - Moved from different state (%) - Hispanic or Latino
Geographical mobility - Moved from different state (%) - American Indian and Alaska Native
Geographical mobility - Moved from different state (%) - Multirace
Geographical mobility - Moved from different state (%) - Other Race
Geographical mobility - Moved from abroad (%)
Geographical mobility - Moved from abroad (%) - White
Geographical mobility - Moved from abroad (%) - Black or African American
Geographical mobility - Moved from abroad (%) - Asian
Geographical mobility - Moved from abroad (%) - Hispanic or Latino
Geographical mobility - Moved from abroad (%) - American Indian and Alaska Native
Geographical mobility - Moved from abroad (%) - Multirace
Geographical mobility - Moved from abroad (%) - Other Race
Place of birth for the foreign-born population - Ireland (%)
Place of birth for the foreign-born population - Denmark (%)
Place of birth for the foreign-born population - Norway (%)
Place of birth for the foreign-born population - Sweden (%)
Place of birth for the foreign-born population - United Kingdom (%)
Place of birth for the foreign-born population - England (%)
Place of birth for the foreign-born population - Scotland (%)
Place of birth for the foreign-born population - Other Northern Europe (%)
Place of birth for the foreign-born population - Austria (%)
Place of birth for the foreign-born population - Belgium (%)
Place of birth for the foreign-born population - France (%)
Place of birth for the foreign-born population - Germany (%)
Place of birth for the foreign-born population - Netherlands (%)
Place of birth for the foreign-born population - Switzerland (%)
Place of birth for the foreign-born population - Other Western Europe (%)
Place of birth for the foreign-born population - Greece (%)
Place of birth for the foreign-born population - Italy (%)
Place of birth for the foreign-born population - Portugal (%)
Place of birth for the foreign-born population - Spain (%)
Place of birth for the foreign-born population - Other Southern Europe (%)
Place of birth for the foreign-born population - Albania (%)
Place of birth for the foreign-born population - Belarus (%)
Place of birth for the foreign-born population - Bosnia and Herzegovina (%)
Place of birth for the foreign-born population - Bulgaria (%)
Place of birth for the foreign-born population - Croatia (%)
Place of birth for the foreign-born population - Czechoslovakia (%)
Place of birth for the foreign-born population - Hungary (%)
Place of birth for the foreign-born population - Latvia (%)
Place of birth for the foreign-born population - Lithuania (%)
Place of birth for the foreign-born population - North Macedonia (Macedonia) (%)
Place of birth for the foreign-born population - Moldova (%)
Place of birth for the foreign-born population - Poland (%)
Place of birth for the foreign-born population - Romania (%)
Place of birth for the foreign-born population - Russia (%)
Place of birth for the foreign-born population - Serbia (%)
Place of birth for the foreign-born population - Ukraine (%)
Place of birth for the foreign-born population - Other Eastern Europe (%)
Place of birth for the foreign-born population - China (%)
Place of birth for the foreign-born population - Hong Kong (%)
Place of birth for the foreign-born population - Taiwan (%)
Place of birth for the foreign-born population - Japan (%)
Place of birth for the foreign-born population - Korea (%)
Place of birth for the foreign-born population - Other Eastern Asia (%)
Place of birth for the foreign-born population - Afghanistan (%)
Place of birth for the foreign-born population - Bangladesh (%)
Place of birth for the foreign-born population - India (%)
Place of birth for the foreign-born population - Iran (%)
Place of birth for the foreign-born population - Kazakhstan (%)
Place of birth for the foreign-born population - Nepal (%)
Place of birth for the foreign-born population - Pakistan (%)
Place of birth for the foreign-born population - Sri Lanka (%)
Place of birth for the foreign-born population - Uzbekistan (%)
Place of birth for the foreign-born population - Other South Central Asia (%)
Place of birth for the foreign-born population - Burma (%)
Place of birth for the foreign-born population - Cambodia (%)
Place of birth for the foreign-born population - Indonesia (%)
Place of birth for the foreign-born population - Laos (%)
Place of birth for the foreign-born population - Malaysia (%)
Place of birth for the foreign-born population - Philippines (%)
Place of birth for the foreign-born population - Singapore (%)
Place of birth for the foreign-born population - Thailand (%)
Place of birth for the foreign-born population - Vietnam (%)
Place of birth for the foreign-born population - Other South Eastern Asia (%)
Place of birth for the foreign-born population - Armenia (%)
Place of birth for the foreign-born population - Iraq (%)
Place of birth for the foreign-born population - Israel (%)
Place of birth for the foreign-born population - Jordan (%)
Place of birth for the foreign-born population - Kuwait (%)
Place of birth for the foreign-born population - Lebanon (%)
Place of birth for the foreign-born population - Saudi Arabia (%)
Place of birth for the foreign-born population - Syria (%)
Place of birth for the foreign-born population - Turkey (%)
Place of birth for the foreign-born population - Yemen (%)
Place of birth for the foreign-born population - Other Western Asia (%)
Place of birth for the foreign-born population - Eritrea (%)
Place of birth for the foreign-born population - Ethiopia (%)
Place of birth for the foreign-born population - Kenya (%)
Place of birth for the foreign-born population - Somalia (%)
Place of birth for the foreign-born population - Uganda (%)
Place of birth for the foreign-born population - Zimbabwe (%)
Place of birth for the foreign-born population - Other Eastern Africa (%)
Place of birth for the foreign-born population - Cameroon (%)
Place of birth for the foreign-born population - Congo (%)
Place of birth for the foreign-born population - Democratic Republic of Congo (Zaire) (%)
Place of birth for the foreign-born population - Other Middle Africa (%)
Place of birth for the foreign-born population - Egypt (%)
Place of birth for the foreign-born population - Morocco (%)
Place of birth for the foreign-born population - Sudan (%)
Place of birth for the foreign-born population - Other Northern Africa (%)
Place of birth for the foreign-born population - South Africa (%)
Place of birth for the foreign-born population - Other Southern Africa (%)
Place of birth for the foreign-born population - Cabo Verde (%)
Place of birth for the foreign-born population - Ghana (%)
Place of birth for the foreign-born population - Liberia (%)
Place of birth for the foreign-born population - Nigeria (%)
Place of birth for the foreign-born population - Senegal (%)
Place of birth for the foreign-born population - Sierra Leone (%)
Place of birth for the foreign-born population - Other Western Africa (%)
Place of birth for the foreign-born population - Australia (%)
Place of birth for the foreign-born population - New Zealand (%)
Place of birth for the foreign-born population - Fiji (%)
Place of birth for the foreign-born population - Micronesia (%)
Place of birth for the foreign-born population - Bahamas (%)
Place of birth for the foreign-born population - Barbados (%)
Place of birth for the foreign-born population - Cuba (%)
Place of birth for the foreign-born population - Dominica (%)
Place of birth for the foreign-born population - Dominican Republic (%)
Place of birth for the foreign-born population - Grenada (%)
Place of birth for the foreign-born population - Haiti (%)
Place of birth for the foreign-born population - Jamaica (%)
Place of birth for the foreign-born population - St. Vincent and the Grenadines (%)
Place of birth for the foreign-born population - Trinidad and Tobago (%)
Place of birth for the foreign-born population - West Indies (%)
Place of birth for the foreign-born population - Other Caribbean (%)
Place of birth for the foreign-born population - Belize (%)
Place of birth for the foreign-born population - Costa Rica (%)
Place of birth for the foreign-born population - El Salvador (%)
Place of birth for the foreign-born population - Guatemala (%)
Place of birth for the foreign-born population - Honduras (%)
Place of birth for the foreign-born population - Mexico (%)
Place of birth for the foreign-born population - Nicaragua (%)
Place of birth for the foreign-born population - Panama (%)
Place of birth for the foreign-born population - Other Central America (%)
Place of birth for the foreign-born population - Argentina (%)
Place of birth for the foreign-born population - Bolivia (%)
Place of birth for the foreign-born population - Brazil (%)
Place of birth for the foreign-born population - Chile (%)
Place of birth for the foreign-born population - Colombia (%)
Place of birth for the foreign-born population - Ecuador (%)
Place of birth for the foreign-born population - Guyana (%)
Place of birth for the foreign-born population - Peru (%)
Place of birth for the foreign-born population - Uruguay (%)
Place of birth for the foreign-born population - Venezuela (%)
Place of birth for the foreign-born population - Other South America (%)
Place of birth for the foreign-born population - Canada (%)
Place of birth for the foreign-born population - Other Northern America (%)
Place of birth for the foreign-born population - Other (%)
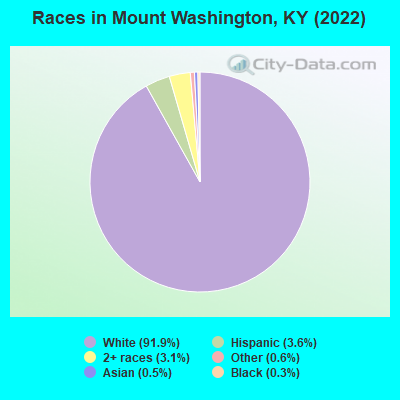
According to 2022 data, the most numerous races in Mount Washington, KY are White alone (16,561 residents), Black alone (48 residents), and Hispanic (651 residents). 96.6% of Mount Washington residents speak English at home. 2.6% of Mount Washington, KY residents are foreign-born (1.7% born in Latin America, 0.4% born in Europe, 0.3% born in Asia), which is 55.9% less than the foreign-born rate of 4.0% across the entire state of Kentucky.
Race distribution in Mount Washington
2000 2022
3,608,013 89.3% White alone 293,639 7.3% Black alone 59,939 1.5% Hispanic 37,750 0.9% Two or more races 29,368 0.7% Asian alone 7,939 0.2% American Indian alone 3,846 0.10% Other race alone 1,275 0.03% Native Hawaiian and Other
3,710,998 82.2% White alone 343,194 7.6% Black alone 187,483 4.2% Hispanic 187,394 4.2% Two or more races 62,240 1.4% Asian alone 13,529 0.3% Other race alone 4,302 0.10% American Indian alone 3,170 0.07% Native Hawaiian and Other
Income and house value in Mount Washington Median household income in 2022 $92,564 White non-Hispanic householdersover $200,000 Some other race householders$108,816 Two or more races householdersMedian 2022 house value $264,328 White Non-Hispanic householders$241,454 American Indian or Alaska Native householders$82,602 Two or more races householders
Median age by race in Mount Washington
37.9 Median age for White residents36.4 39.8 31.4 Median age for Black or African American residents14.3 -681,818,181.1 -521,556,256.1 Median age for American Indian / Alaska Native residents-607,449,856.1 -630,065,358.8 14.7 Median age for Asian residents13.6 81.0 -666,666,666.0 Median age for Native Hawaiian / Pacific Islander residents-666,666,666.0 -666,666,666.0 66.8 Median age for Other race residents77.2 66.3 22.0 Median age for Two or more races residents30.1 19.8 37.8 Median age for White alone residents36.3 39.6 37.7 Median age for Hispanic or Latino residents37.9 44.4
Owner/renter occupied households by race in Mount Washington
House owners and renters - White residents 5,772 86.8% Owner occupied875 13.2% Renter occupiedHouse owners and renters - Black or African American residents 12 100.0% Owner occupiedHouse owners and renters - Asian residents 1 100.0% Owner occupiedHouse owners and renters - Other race residents 73 82.6% Owner occupied15 17.4% Renter occupiedHouse owners and renters - Two or more races residents 201 85.0% Owner occupied36 15.0% Renter occupiedHouse owners and renters - White alone residents 5,730 87.2% Owner occupied840 12.8% Renter occupiedHouse owners and renters - Hispanic or Latino residents 123 69.9% Owner occupied53 30.1% Renter occupied
Language usage in Mount Washington
English speakers - Total 96.6% of residents of Mount Washington speak English at home.
2.4% of residents speak Spanish at home 115 28.3% Speak English very well291 71.7% Speak English less than very well1.0% of residents speak other language at home 74 44.6% Speak English very well92 55.4% Speak English less than very well
English speakers - Born in the United States 96.6% of residents of Mount Washington speak English at home.
1.1% of residents speak Spanish at home 31 100.0% Speak English very well2.3% of residents speak other language at home 17 25.4% Speak English very well50 74.6% Speak English less than very well
English speakers - Native, born elsewhere 88.0% of residents of Mount Washington speak English at home.
8.7% of residents speak Spanish at home 8 100.0% Speak English less than very well
English speakers - Foreign-born 23.3% of residents of Mount Washington speak English at home.
58.5% of residents speak Spanish at home 67 25.4% Speak English very well197 74.6% Speak English less than very well19.5% of residents speak other language at home 41 46.6% Speak English very well47 53.4% Speak English less than very well
White (Caucasian) - Speak only English Native:
99.5% (15,233)Foreign-born:
54.7% (73)
White (Caucasian) - Speak another language Native:
0.5% (79)Foreign-born:
51.1% (68)
Asian - Speak only English Native:
19.9% (10)Foreign-born:
24.4% (11)
Asian - Speak another language Native:
81.2% (41)Foreign-born:
75.1% (35)
Other race - Speak only English Native:
100.0% (102)Foreign-born:
7.7% (13)
Two or more races - Speak another language Native:
15.6% (134)Foreign-born:
98.8% (125)
White alone - Speak only English Native:
99.5% (15,181)Foreign-born:
92.3% (77)
White alone - Speak another language Native:
0.4% (66)Foreign-born:
14.0% (12)
Hispanic or Latino - Speak another language Native:
34.1% (119)Foreign-born:
100.0% (302)
Foreign-born residents in Mount Washington 469 residents are foreign born (1.7% Latin America , 0.4% Europe , 0.3% Asia ).
This city:
2.6%Kentucky:
4.1%
Marital status for residents in Mount Washington Marital status - White (Caucasian) population 15 years and over
Males 29.6% Never married58.4% Now married1.1% Separated3.7% Widowed7.2% DivorcedFemales 20.7% Never married52.4% Now married1.7% Separated8.7% Widowed16.4% DivorcedWomen who gave birth in the past 12 months Now married:
77.6% (217)Unmarried:
22.4% (63)
Women who did not give birth in the past 12 months Now married:
54.1% (2,016)Unmarried:
45.9% (1,708)
Marital status - Black or African American population 15 years and over
Males 60.0% Never married40.0% Now married0.0% Separated0.0% Widowed0.0% DivorcedFemales 0.0% Never married100.0% Now married0.0% Separated0.0% Widowed0.0% DivorcedWomen who did not give birth in the past 12 months Now married:
100.0% (18)Unmarried:
0.0% (0)
Marital status - Asian population 15 years and over
Males 0.0% Never married100.0% Now married0.0% Separated0.0% Widowed0.0% DivorcedFemales 0.0% Never married42.9% Now married0.0% Separated0.0% Widowed57.1% DivorcedWomen who did not give birth in the past 12 months Now married:
100.0% (13)Unmarried:
0.0% (0)
Marital status - Other race population 15 years and over
Males 45.6% Never married54.4% Now married0.0% Separated0.0% Widowed0.0% DivorcedFemales 0.0% Never married65.4% Now married0.0% Separated0.0% Widowed34.6% DivorcedWomen who did not give birth in the past 12 months Now married:
100.0% (22)Unmarried:
0.0% (0)
Marital status - Two or more races population 15 years and over
Males 34.2% Never married49.2% Now married0.0% Separated1.2% Widowed15.4% DivorcedFemales 18.9% Never married45.9% Now married12.2% Separated19.6% Widowed3.4% DivorcedWomen who did not give birth in the past 12 months Now married:
68.9% (89)Unmarried:
31.1% (40)
Marital status - White alone, not Hispanic / Latino population 15 years and over
Males 29.6% Never married58.6% Now married1.1% Separated3.7% Widowed6.9% DivorcedFemales 21.0% Never married51.9% Now married1.8% Separated8.8% Widowed16.5% DivorcedWomen who gave birth in the past 12 months Now married:
77.6% (216)Unmarried:
22.4% (62)
Women who did not give birth in the past 12 months Now married:
53.3% (1,940)Unmarried:
46.7% (1,703)
Marital status - Hispanic or Latino population 15 years and over
Males 43.1% Never married48.0% Now married0.0% Separated0.0% Widowed8.9% DivorcedFemales 0.0% Never married79.6% Now married0.0% Separated0.0% Widowed20.4% DivorcedWomen who did not give birth in the past 12 months Now married:
100.0% (129)Unmarried:
0.0% (0)
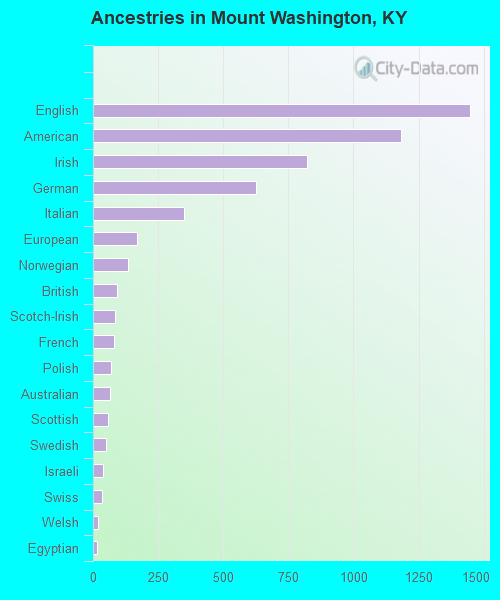
Ancestries in Mount Washington
1,448 22.8% English1,181 18.6% American821 12.9% Irish627 9.9% German349 5.5% Italian169 2.7% European134 2.1% Norwegian94 1.5% British86 1.4% Scotch-Irish81 1.3% French71 1.1% Polish65 1.0% Australian58 0.9% Scottish50 0.8% Swedish40 0.6% Israeli34 0.5% Swiss18 0.3% Welsh17 0.3% Egyptian12 0.2% Eastern European11 0.2% Dutch11 0.2% Northern European11 0.2% Pennsylvania German9 0.1% Albanian9 0.1% French Canadian
Children Nativity (place of birth) in Mount Washington
Children under 6 years - Living with two parents Both parents native 1,074 100.0% NativeOne native, one foreign-born parent 20 100.0% NativeChildren under 6 years - Living with one parent Native parent 213 100.0% NativeForeign-born parent 27 100.0% NativeChildren 6 to 17 years - Living with two parents Both parents native 1,967 100.0% NativeBoth parents foreign-born 148 100.0% NativeOne native, one foreign-born parent 47 100.0% NativeChildren 6 to 17 years - Living with one parent Native parent 783 100.0% NativeForeign-born parent 20 54.1% Native17 45.9% Foreign-born
Grandparents responsible for own grandchildren in Mount Washington
Grandparents (30 to 59 years) White / Caucasian 45 81.9% Responsible for grandchildren10 18.1% Not responsible for grandchildrenTwo or more races 3 100.0% Not responsible for grandchildrenWhite alone, not Hispanic / Latino 45 81.7% Responsible for grandchildren10 18.3% Not responsible for grandchildrenGrandparents (60 years and over) White / Caucasian 16 21.1% Responsible for grandchildren62 78.9% Not responsible for grandchildrenTwo or more races 5 100.0% Responsible for grandchildrenWhite alone, not Hispanic / Latino 16 21.1% Responsible for grandchildren62 78.9% Not responsible for grandchildren