Races in Mount Pleasant, Wisconsin (WI) Detailed Stats
Data:
Races - White alone (%)
Races - White alone (% change since 2000)
Races - Black alone (%)
Races - Black alone (% change since 2000)
Races - American Indian alone (%)
Races - American Indian alone (% change since 2000)
Races - Asian alone (%)
Races - Asian alone (% change since 2000)
Races - Hispanic (%)
Races - Hispanic (% change since 2000)
Races - Native Hawaiian and Other Pacific Islander alone (%)
Races - Native Hawaiian and Other Pacific Islander alone (% change since 2000)
Races - Two or more races(%)
Races - Two or more races(% change since 2000)
Races - Other race alone (%)
Races - Other race alone (% change since 2000)
Racial diversity
Place of birth - Born in state of residence (%)
Place of birth - Born in state of residence (%) - White
Place of birth - Born in state of residence (%) - Black or African American
Place of birth - Born in state of residence (%) - Asian
Place of birth - Born in state of residence (%) - Hispanic or Latino
Place of birth - Born in state of residence (%) - American Indian and Alaska Native
Place of birth - Born in state of residence (%) - Multirace
Place of birth - Born in state of residence (%) - Other Race
Place of birth - Born in other state (%)
Place of birth - Born in other state (%) - White
Place of birth - Born in other state (%) - Black or African American
Place of birth - Born in other state (%) - Asian
Place of birth - Born in other state (%) - Hispanic or Latino
Place of birth - Born in other state (%) - American Indian and Alaska Native
Place of birth - Born in other state (%) - Multirace
Place of birth - Born in other state (%) - Other Race
Place of birth - Native, outside of US (%)
Place of birth - Native, outside of US (%) - White
Place of birth - Native, outside of US (%) - Black or African American
Place of birth - Native, outside of US (%) - Asian
Place of birth - Native, outside of US (%) - Hispanic or Latino
Place of birth - Native, outside of US (%) - American Indian and Alaska Native
Place of birth - Native, outside of US (%) - Multirace
Place of birth - Native, outside of US (%) - Other Race
Place of birth - Foreign born (%)
Place of birth - Foreign born (%) - White
Place of birth - Foreign born (%) - Black or African American
Place of birth - Foreign born (%) - Asian
Place of birth - Foreign born (%) - Hispanic or Latino
Place of birth - Foreign born (%) - American Indian and Alaska Native
Place of birth - Foreign born (%) - Multirace
Place of birth - Foreign born (%) - Other Race
Residents speaking English at home (%)
Residents speaking English at home - Born in the United States (%)
Residents speaking English at home - Native, born elsewhere (%)
Residents speaking English at home - Foreign born (%)
Residents speaking Spanish at home (%)
Residents speaking Spanish at home - Born in the United States (%)
Residents speaking Spanish at home - Native, born elsewhere (%)
Residents speaking Spanish at home - Foreign born (%)
Residents speaking other language at home (%)
Residents speaking other language at home - Born in the United States (%)
Residents speaking other language at home - Native, born elsewhere (%)
Residents speaking other language at home - Foreign born (%)
Marital status - Never married (%)
Marital status - Now married (%)
Marital status - Separated (%)
Marital status - Widowed (%)
Marital status - Divorced (%)
Ancestries Reported - Arab (%)
Ancestries Reported - Czech (%)
Ancestries Reported - Danish (%)
Ancestries Reported - Dutch (%)
Ancestries Reported - English (%)
Ancestries Reported - French (%)
Ancestries Reported - French Canadian (%)
Ancestries Reported - German (%)
Ancestries Reported - Greek (%)
Ancestries Reported - Hungarian (%)
Ancestries Reported - Irish (%)
Ancestries Reported - Italian (%)
Ancestries Reported - Lithuanian (%)
Ancestries Reported - Norwegian (%)
Ancestries Reported - Polish (%)
Ancestries Reported - Portuguese (%)
Ancestries Reported - Russian (%)
Ancestries Reported - Scotch-Irish (%)
Ancestries Reported - Scottish (%)
Ancestries Reported - Slovak (%)
Ancestries Reported - Subsaharan African (%)
Ancestries Reported - Swedish (%)
Ancestries Reported - Swiss (%)
Ancestries Reported - Ukrainian (%)
Ancestries Reported - United States (%)
Ancestries Reported - Welsh (%)
Ancestries Reported - West Indian (%)
Ancestries Reported - Other (%)
Geographical mobility - Same house 1 year ago (%)
Geographical mobility - Same house 1 year ago (%) - White
Geographical mobility - Same house 1 year ago (%) - Black or African American
Geographical mobility - Same house 1 year ago (%) - Asian
Geographical mobility - Same house 1 year ago (%) - Hispanic or Latino
Geographical mobility - Same house 1 year ago (%) - American Indian and Alaska Native
Geographical mobility - Same house 1 year ago (%) - Multirace
Geographical mobility - Same house 1 year ago (%) - Other Race
Geographical mobility - Moved within same county (%)
Geographical mobility - Moved within same county (%) - White
Geographical mobility - Moved within same county (%) - Black or African American
Geographical mobility - Moved within same county (%) - Asian
Geographical mobility - Moved within same county (%) - Hispanic or Latino
Geographical mobility - Moved within same county (%) - American Indian and Alaska Native
Geographical mobility - Moved within same county (%) - Multirace
Geographical mobility - Moved within same county (%) - Other Race
Geographical mobility - Moved from different county within same state (%)
Geographical mobility - Moved from different county within same state (%) - White
Geographical mobility - Moved from different county within same state (%) - Black or African American
Geographical mobility - Moved from different county within same state (%) - Asian
Geographical mobility - Moved from different county within same state (%) - Hispanic or Latino
Geographical mobility - Moved from different county within same state (%) - American Indian and Alaska Native
Geographical mobility - Moved from different county within same state (%) - Multirace
Geographical mobility - Moved from different county within same state (%) - Other Race
Geographical mobility - Moved from different state (%)
Geographical mobility - Moved from different state (%) - White
Geographical mobility - Moved from different state (%) - Black or African American
Geographical mobility - Moved from different state (%) - Asian
Geographical mobility - Moved from different state (%) - Hispanic or Latino
Geographical mobility - Moved from different state (%) - American Indian and Alaska Native
Geographical mobility - Moved from different state (%) - Multirace
Geographical mobility - Moved from different state (%) - Other Race
Geographical mobility - Moved from abroad (%)
Geographical mobility - Moved from abroad (%) - White
Geographical mobility - Moved from abroad (%) - Black or African American
Geographical mobility - Moved from abroad (%) - Asian
Geographical mobility - Moved from abroad (%) - Hispanic or Latino
Geographical mobility - Moved from abroad (%) - American Indian and Alaska Native
Geographical mobility - Moved from abroad (%) - Multirace
Geographical mobility - Moved from abroad (%) - Other Race
Place of birth for the foreign-born population - Ireland (%)
Place of birth for the foreign-born population - Denmark (%)
Place of birth for the foreign-born population - Norway (%)
Place of birth for the foreign-born population - Sweden (%)
Place of birth for the foreign-born population - United Kingdom (%)
Place of birth for the foreign-born population - England (%)
Place of birth for the foreign-born population - Scotland (%)
Place of birth for the foreign-born population - Other Northern Europe (%)
Place of birth for the foreign-born population - Austria (%)
Place of birth for the foreign-born population - Belgium (%)
Place of birth for the foreign-born population - France (%)
Place of birth for the foreign-born population - Germany (%)
Place of birth for the foreign-born population - Netherlands (%)
Place of birth for the foreign-born population - Switzerland (%)
Place of birth for the foreign-born population - Other Western Europe (%)
Place of birth for the foreign-born population - Greece (%)
Place of birth for the foreign-born population - Italy (%)
Place of birth for the foreign-born population - Portugal (%)
Place of birth for the foreign-born population - Spain (%)
Place of birth for the foreign-born population - Other Southern Europe (%)
Place of birth for the foreign-born population - Albania (%)
Place of birth for the foreign-born population - Belarus (%)
Place of birth for the foreign-born population - Bosnia and Herzegovina (%)
Place of birth for the foreign-born population - Bulgaria (%)
Place of birth for the foreign-born population - Croatia (%)
Place of birth for the foreign-born population - Czechoslovakia (%)
Place of birth for the foreign-born population - Hungary (%)
Place of birth for the foreign-born population - Latvia (%)
Place of birth for the foreign-born population - Lithuania (%)
Place of birth for the foreign-born population - North Macedonia (Macedonia) (%)
Place of birth for the foreign-born population - Moldova (%)
Place of birth for the foreign-born population - Poland (%)
Place of birth for the foreign-born population - Romania (%)
Place of birth for the foreign-born population - Russia (%)
Place of birth for the foreign-born population - Serbia (%)
Place of birth for the foreign-born population - Ukraine (%)
Place of birth for the foreign-born population - Other Eastern Europe (%)
Place of birth for the foreign-born population - China (%)
Place of birth for the foreign-born population - Hong Kong (%)
Place of birth for the foreign-born population - Taiwan (%)
Place of birth for the foreign-born population - Japan (%)
Place of birth for the foreign-born population - Korea (%)
Place of birth for the foreign-born population - Other Eastern Asia (%)
Place of birth for the foreign-born population - Afghanistan (%)
Place of birth for the foreign-born population - Bangladesh (%)
Place of birth for the foreign-born population - India (%)
Place of birth for the foreign-born population - Iran (%)
Place of birth for the foreign-born population - Kazakhstan (%)
Place of birth for the foreign-born population - Nepal (%)
Place of birth for the foreign-born population - Pakistan (%)
Place of birth for the foreign-born population - Sri Lanka (%)
Place of birth for the foreign-born population - Uzbekistan (%)
Place of birth for the foreign-born population - Other South Central Asia (%)
Place of birth for the foreign-born population - Burma (%)
Place of birth for the foreign-born population - Cambodia (%)
Place of birth for the foreign-born population - Indonesia (%)
Place of birth for the foreign-born population - Laos (%)
Place of birth for the foreign-born population - Malaysia (%)
Place of birth for the foreign-born population - Philippines (%)
Place of birth for the foreign-born population - Singapore (%)
Place of birth for the foreign-born population - Thailand (%)
Place of birth for the foreign-born population - Vietnam (%)
Place of birth for the foreign-born population - Other South Eastern Asia (%)
Place of birth for the foreign-born population - Armenia (%)
Place of birth for the foreign-born population - Iraq (%)
Place of birth for the foreign-born population - Israel (%)
Place of birth for the foreign-born population - Jordan (%)
Place of birth for the foreign-born population - Kuwait (%)
Place of birth for the foreign-born population - Lebanon (%)
Place of birth for the foreign-born population - Saudi Arabia (%)
Place of birth for the foreign-born population - Syria (%)
Place of birth for the foreign-born population - Turkey (%)
Place of birth for the foreign-born population - Yemen (%)
Place of birth for the foreign-born population - Other Western Asia (%)
Place of birth for the foreign-born population - Eritrea (%)
Place of birth for the foreign-born population - Ethiopia (%)
Place of birth for the foreign-born population - Kenya (%)
Place of birth for the foreign-born population - Somalia (%)
Place of birth for the foreign-born population - Uganda (%)
Place of birth for the foreign-born population - Zimbabwe (%)
Place of birth for the foreign-born population - Other Eastern Africa (%)
Place of birth for the foreign-born population - Cameroon (%)
Place of birth for the foreign-born population - Congo (%)
Place of birth for the foreign-born population - Democratic Republic of Congo (Zaire) (%)
Place of birth for the foreign-born population - Other Middle Africa (%)
Place of birth for the foreign-born population - Egypt (%)
Place of birth for the foreign-born population - Morocco (%)
Place of birth for the foreign-born population - Sudan (%)
Place of birth for the foreign-born population - Other Northern Africa (%)
Place of birth for the foreign-born population - South Africa (%)
Place of birth for the foreign-born population - Other Southern Africa (%)
Place of birth for the foreign-born population - Cabo Verde (%)
Place of birth for the foreign-born population - Ghana (%)
Place of birth for the foreign-born population - Liberia (%)
Place of birth for the foreign-born population - Nigeria (%)
Place of birth for the foreign-born population - Senegal (%)
Place of birth for the foreign-born population - Sierra Leone (%)
Place of birth for the foreign-born population - Other Western Africa (%)
Place of birth for the foreign-born population - Australia (%)
Place of birth for the foreign-born population - New Zealand (%)
Place of birth for the foreign-born population - Fiji (%)
Place of birth for the foreign-born population - Micronesia (%)
Place of birth for the foreign-born population - Bahamas (%)
Place of birth for the foreign-born population - Barbados (%)
Place of birth for the foreign-born population - Cuba (%)
Place of birth for the foreign-born population - Dominica (%)
Place of birth for the foreign-born population - Dominican Republic (%)
Place of birth for the foreign-born population - Grenada (%)
Place of birth for the foreign-born population - Haiti (%)
Place of birth for the foreign-born population - Jamaica (%)
Place of birth for the foreign-born population - St. Vincent and the Grenadines (%)
Place of birth for the foreign-born population - Trinidad and Tobago (%)
Place of birth for the foreign-born population - West Indies (%)
Place of birth for the foreign-born population - Other Caribbean (%)
Place of birth for the foreign-born population - Belize (%)
Place of birth for the foreign-born population - Costa Rica (%)
Place of birth for the foreign-born population - El Salvador (%)
Place of birth for the foreign-born population - Guatemala (%)
Place of birth for the foreign-born population - Honduras (%)
Place of birth for the foreign-born population - Mexico (%)
Place of birth for the foreign-born population - Nicaragua (%)
Place of birth for the foreign-born population - Panama (%)
Place of birth for the foreign-born population - Other Central America (%)
Place of birth for the foreign-born population - Argentina (%)
Place of birth for the foreign-born population - Bolivia (%)
Place of birth for the foreign-born population - Brazil (%)
Place of birth for the foreign-born population - Chile (%)
Place of birth for the foreign-born population - Colombia (%)
Place of birth for the foreign-born population - Ecuador (%)
Place of birth for the foreign-born population - Guyana (%)
Place of birth for the foreign-born population - Peru (%)
Place of birth for the foreign-born population - Uruguay (%)
Place of birth for the foreign-born population - Venezuela (%)
Place of birth for the foreign-born population - Other South America (%)
Place of birth for the foreign-born population - Canada (%)
Place of birth for the foreign-born population - Other Northern America (%)
Place of birth for the foreign-born population - Other (%)
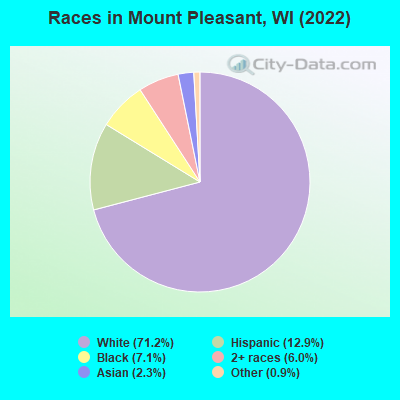
According to 2022 data, the most numerous races in Mount Pleasant, WI are White alone (19,558 residents), Hispanic (3,548 residents), and Black alone (1,956 residents). 87.9% of Mount Pleasant residents speak English at home. 9.3% of Mount Pleasant, WI residents are foreign-born (4.3% born in Latin America, 2.1% born in Asia, 1.8% born in Europe), which is 46.0% greater than the foreign-born rate of 5.0% across the entire state of Wisconsin.
Race distribution in Mount Pleasant
2000 2022
4,681,630 87.3% White alone 300,245 5.6% Black alone 192,921 3.6% Hispanic 87,995 1.6% Asian alone 51,921 1.0% Two or more races 43,980 0.8% American Indian alone 3,637 0.07% Other race alone 1,346 0.03% Native Hawaiian and Other
4,654,031 79.0% White alone 447,022 7.6% Hispanic 345,678 5.9% Black alone 217,532 3.7% Two or more races 172,242 2.9% Asian alone 33,762 0.6% American Indian alone 19,680 0.3% Other race alone 2,592 0.04% Native Hawaiian and Other
Income and house value in Mount Pleasant Median household income in 2022 $78,201 White non-Hispanic householders$79,178 Black householders$53,125 American Indian and Alaska Native householders$114,532 Asian householders$151,009 Some other race householders$94,107 Two or more races householders$108,815 Hispanic or Latino race householdersMedian 2022 house value $286,049 White Non-Hispanic householders$228,839 Black or African American householders$376,129 American Indian or Alaska Native householders $288,129 Asian householders$147,913 Some other race householders$250,267 Two or more races householders$195,345 Hispanic or Latino householders
Median age by race in Mount Pleasant
52.6 Median age for White residents49.7 55.6 35.4 Median age for Black or African American residents27.4 41.7 39.4 Median age for American Indian / Alaska Native residents13.3 40.4 29.9 Median age for Asian residents30.4 26.9 -825,688,072.6 Median age for Native Hawaiian / Pacific Islander residents-862,745,097.2 -732,444,443.7 61.5 Median age for Other race residents43.6 85.2 23.1 Median age for Two or more races residents20.2 32.6 53.5 Median age for White alone residents50.6 56.0 33.8 Median age for Hispanic or Latino residents22.1 43.3
Owner/renter occupied households by race in Mount Pleasant
House owners and renters - White residents 8,031 84.3% Owner occupied1,493 15.7% Renter occupiedHouse owners and renters - Black or African American residents 271 38.1% Owner occupied440 61.9% Renter occupiedHouse owners and renters - American Indian / Alaska Native residents 36 100.0% Renter occupiedHouse owners and renters - Asian residents 176 73.0% Owner occupied65 27.0% Renter occupiedHouse owners and renters - Native Hawaiian / Pacific Islander residents 12 100.0% Owner occupiedHouse owners and renters - Other race residents 345 85.9% Owner occupied57 14.1% Renter occupiedHouse owners and renters - Two or more races residents 704 78.0% Owner occupied198 22.0% Renter occupiedHouse owners and renters - White alone residents 7,892 84.8% Owner occupied1,413 15.2% Renter occupiedHouse owners and renters - Hispanic or Latino residents 896 82.1% Owner occupied196 17.9% Renter occupied
Language usage in Mount Pleasant
English speakers - Total 87.9% of residents of Mount Pleasant speak English at home.
7.9% of residents speak Spanish at home 1,252 61.4% Speak English very well787 38.6% Speak English less than very well4.4% of residents speak other language at home 506 44.9% Speak English very well622 55.1% Speak English less than very well
English speakers - Born in the United States 93.4% of residents of Mount Pleasant speak English at home.
5.9% of residents speak Spanish at home 330 96.8% Speak English very well11 3.2% Speak English less than very well
English speakers - Native, born elsewhere 76.9% of residents of Mount Pleasant speak English at home.
39.2% of residents speak Spanish at home 51 100.0% Speak English very well13.8% of residents speak other language at home 18 100.0% Speak English very well
English speakers - Foreign-born 9.0% of residents of Mount Pleasant speak English at home.
53.8% of residents speak Spanish at home 396 29.8% Speak English very well932 70.2% Speak English less than very well40.1% of residents speak other language at home 308 31.1% Speak English very well681 68.9% Speak English less than very well
White (Caucasian) - Speak only English Native:
98.7% (18,489)Foreign-born:
25.1% (120)
White (Caucasian) - Speak another language Native:
1.6% (300)Foreign-born:
75.3% (361)
Black or African American - Speak only English Native:
99.2% (1,769)Foreign-born:
27.7% (24)
Black or African American - Speak another language Native:
1.1% (19)Foreign-born:
74.6% (66)
American Indian / Alaska Native - Speak only English Native:
45.6% (24)Foreign-born:
53.1% (32)
American Indian / Alaska Native - Speak another language Native:
76.0% (40)Foreign-born:
45.1% (27)
Asian - Speak only English Native:
86.8% (112)Foreign-born:
14.9% (66)
Asian - Speak another language Native:
20.5% (26)Foreign-born:
85.3% (375)
Other race - Speak another language Native:
17.6% (91)Foreign-born:
100.0% (376)
Two or more races - Speak another language Native:
28.1% (632)Foreign-born:
100.0% (1,018)
White alone - Speak only English Native:
99.5% (18,214)Foreign-born:
31.3% (139)
White alone - Speak another language Native:
0.7% (131)Foreign-born:
70.8% (316)
Hispanic or Latino - Speak only English Native:
57.4% (1,082)Foreign-born:
1.6% (22)
Hispanic or Latino - Speak another language Native:
40.2% (759)Foreign-born:
100.0% (1,403)
Foreign-born residents in Mount Pleasant 2,542 residents are foreign born (4.3% Latin America , 2.1% Asia , 1.8% Europe ).
This city:
9.3%Wisconsin:
5.0%
Marital status for residents in Mount Pleasant Marital status - White (Caucasian) population 15 years and over
Males 28.8% Never married56.1% Now married0.2% Separated4.9% Widowed10.0% DivorcedFemales 20.1% Never married53.4% Now married0.6% Separated12.2% Widowed13.7% DivorcedWomen who gave birth in the past 12 months Now married:
96.5% (147)Unmarried:
3.5% (5)
Women who did not give birth in the past 12 months Now married:
45.8% (1,356)Unmarried:
54.2% (1,603)
Marital status - Black or African American population 15 years and over
Males 62.9% Never married28.4% Now married0.0% Separated1.1% Widowed7.6% DivorcedFemales 50.8% Never married24.7% Now married4.4% Separated5.0% Widowed15.0% DivorcedWomen who gave birth in the past 12 months Now married:
72.9% (81)Unmarried:
27.1% (30)
Women who did not give birth in the past 12 months Now married:
13.0% (52)Unmarried:
87.0% (344)
Marital status - American Indian / Alaska Native population 15 years and over
Males 0.0% Never married40.9% Now married59.1% Separated0.0% Widowed0.0% DivorcedFemales 0.0% Never married64.0% Now married0.0% Separated0.0% Widowed36.0% DivorcedMarital status - Asian population 15 years and over
Males 24.4% Never married67.2% Now married0.0% Separated0.0% Widowed8.4% DivorcedFemales 0.0% Never married76.0% Now married0.0% Separated15.7% Widowed8.3% DivorcedWomen who gave birth in the past 12 months Now married:
100.0% (12)Unmarried:
0.0% (0)
Women who did not give birth in the past 12 months Now married:
93.0% (130)Unmarried:
7.0% (10)
Marital status - Other race population 15 years and over
Males 27.0% Never married68.4% Now married0.0% Separated0.0% Widowed4.6% DivorcedFemales 30.1% Never married66.0% Now married0.0% Separated0.0% Widowed3.9% DivorcedWomen who gave birth in the past 12 months Now married:
100.0% (10)Unmarried:
0.0% (0)
Women who did not give birth in the past 12 months Now married:
30.4% (31)Unmarried:
69.6% (71)
Marital status - Two or more races population 15 years and over
Males 58.4% Never married39.6% Now married0.0% Separated0.0% Widowed2.0% DivorcedFemales 19.8% Never married67.2% Now married0.0% Separated9.6% Widowed3.4% DivorcedWomen who gave birth in the past 12 months Now married:
59.5% (38)Unmarried:
40.5% (26)
Women who did not give birth in the past 12 months Now married:
69.1% (532)Unmarried:
30.9% (238)
Marital status - White alone, not Hispanic / Latino population 15 years and over
Males 26.7% Never married57.7% Now married0.2% Separated5.1% Widowed10.2% DivorcedFemales 18.5% Never married53.7% Now married0.4% Separated12.9% Widowed14.4% DivorcedWomen who gave birth in the past 12 months Now married:
96.5% (156)Unmarried:
3.5% (6)
Women who did not give birth in the past 12 months Now married:
45.3% (1,199)Unmarried:
54.7% (1,449)
Marital status - Hispanic or Latino population 15 years and over
Males 45.8% Never married48.0% Now married1.0% Separated0.7% Widowed4.6% DivorcedFemales 26.7% Never married60.4% Now married1.8% Separated5.9% Widowed5.2% DivorcedWomen who gave birth in the past 12 months Now married:
100.0% (10)Unmarried:
0.0% (0)
Women who did not give birth in the past 12 months Now married:
56.3% (450)Unmarried:
43.7% (349)
Ancestries in Mount Pleasant
2,881 20.9% German787 5.7% Irish703 5.1% Danish606 4.4% Polish524 3.8% Italian466 3.4% English361 2.6% American249 1.8% Norwegian228 1.7% European161 1.2% Czech150 1.1% French146 1.1% Arab140 1.0% Australian116 0.8% Croatian115 0.8% Swedish106 0.8% Dutch50 0.4% Serbian49 0.4% Scandinavian44 0.3% French Canadian39 0.3% Slovak39 0.3% Scottish38 0.3% Lithuanian34 0.2% Greek30 0.2% Ethiopian28 0.2% Austrian23 0.2% Scotch-Irish21 0.2% Egyptian19 0.1% Jamaican16 0.1% Welsh14 0.1% Luxembourger14 0.1% African14 0.1% Belgian13 0.09% Hungarian13 0.09% Slovene11 0.08% Armenian11 0.08% Romanian11 0.08% Eastern European10 0.07% Swiss10 0.07% Ukrainian9 0.07% Russian9 0.07% Northern European7 0.05% Carpatho Rusyn4 0.03% Portuguese2 0.01% British1 0.01% Trinidadian and Tobagonian
Geographical mobility in Mount Pleasant Same house 1 year ago 18,125 90.2% White (Caucasian)1,625 84.9% Black or African American80 81.0% American Indian / Alaska Native603 82.7% Asian10 100.0% Native Hawaiian / Pacific Islander539 81.8% Other race2,883 85.2% Two or more races17,420 90.1% White alone, not Hispanic / Latino3,140 88.3% Hispanic or LatinoMoved within same county 956 4.8% White / Caucasian93 4.8% Black or African American19 18.8% American Indian / Alaska Native65 9.9% Other race229 6.8% Two or more races959 5.0% White alone, not Hispanic / Latino145 4.1% Hispanic or LatinoMoved within same state 656 3.3% White / Caucasian65 3.4% Black or African American33 4.6% Asian35 5.4% Other race71 2.1% Two or more races606 3.1% White alone, not Hispanic / Latino152 4.3% Hispanic or LatinoMoved from different state 398 2.0% White / Caucasian16 0.8% Black or African American393 2.0% White alone, not Hispanic / Latino38 1.1% Hispanic or LatinoMoved from abroad 10 0.1% White134 18.4% Asian155 4.6% Two or more races11 0.1% White alone, not Hispanic / Latino156 4.4% Hispanic or Latino
Children Nativity (place of birth) in Mount Pleasant
Children under 6 years - Living with two parents Both parents native 770 100.0% NativeBoth parents foreign-born 193 62.1% Native118 37.9% Foreign-bornOne native, one foreign-born parent 83 100.0% NativeChildren under 6 years - Living with one parent Native parent 672 100.0% NativeForeign-born parent 20 100.0% NativeChildren 6 to 17 years - Living with two parents Both parents native 1,563 97.6% Native39 2.4% Foreign-bornBoth parents foreign-born 329 72.2% Native126 27.8% Foreign-bornOne native, one foreign-born parent 203 90.2% Native22 9.8% Foreign-bornChildren 6 to 17 years - Living with one parent Native parent 980 100.0% Native
Grandparents responsible for own grandchildren in Mount Pleasant
Grandparents (30 to 59 years) White / Caucasian 59 73.6% Responsible for grandchildren21 26.4% Not responsible for grandchildrenBlack or African American 24 100.0% Responsible for grandchildrenWhite alone, not Hispanic / Latino 44 67.0% Responsible for grandchildren22 33.0% Not responsible for grandchildrenGrandparents (60 years and over) White / Caucasian 81 86.6% Responsible for grandchildren13 13.4% Not responsible for grandchildrenBlack or African American 7 100.0% Responsible for grandchildrenWhite alone, not Hispanic / Latino 81 86.6% Responsible for grandchildren13 13.4% Not responsible for grandchildren