Races in Moline, Illinois (IL) Detailed Stats
Data:
Races - White alone (%)
Races - White alone (% change since 2000)
Races - Black alone (%)
Races - Black alone (% change since 2000)
Races - American Indian alone (%)
Races - American Indian alone (% change since 2000)
Races - Asian alone (%)
Races - Asian alone (% change since 2000)
Races - Hispanic (%)
Races - Hispanic (% change since 2000)
Races - Native Hawaiian and Other Pacific Islander alone (%)
Races - Native Hawaiian and Other Pacific Islander alone (% change since 2000)
Races - Two or more races(%)
Races - Two or more races(% change since 2000)
Races - Other race alone (%)
Races - Other race alone (% change since 2000)
Racial diversity
Place of birth - Born in state of residence (%)
Place of birth - Born in state of residence (%) - White
Place of birth - Born in state of residence (%) - Black or African American
Place of birth - Born in state of residence (%) - Asian
Place of birth - Born in state of residence (%) - Hispanic or Latino
Place of birth - Born in state of residence (%) - American Indian and Alaska Native
Place of birth - Born in state of residence (%) - Multirace
Place of birth - Born in state of residence (%) - Other Race
Place of birth - Born in other state (%)
Place of birth - Born in other state (%) - White
Place of birth - Born in other state (%) - Black or African American
Place of birth - Born in other state (%) - Asian
Place of birth - Born in other state (%) - Hispanic or Latino
Place of birth - Born in other state (%) - American Indian and Alaska Native
Place of birth - Born in other state (%) - Multirace
Place of birth - Born in other state (%) - Other Race
Place of birth - Native, outside of US (%)
Place of birth - Native, outside of US (%) - White
Place of birth - Native, outside of US (%) - Black or African American
Place of birth - Native, outside of US (%) - Asian
Place of birth - Native, outside of US (%) - Hispanic or Latino
Place of birth - Native, outside of US (%) - American Indian and Alaska Native
Place of birth - Native, outside of US (%) - Multirace
Place of birth - Native, outside of US (%) - Other Race
Place of birth - Foreign born (%)
Place of birth - Foreign born (%) - White
Place of birth - Foreign born (%) - Black or African American
Place of birth - Foreign born (%) - Asian
Place of birth - Foreign born (%) - Hispanic or Latino
Place of birth - Foreign born (%) - American Indian and Alaska Native
Place of birth - Foreign born (%) - Multirace
Place of birth - Foreign born (%) - Other Race
Residents speaking English at home (%)
Residents speaking English at home - Born in the United States (%)
Residents speaking English at home - Native, born elsewhere (%)
Residents speaking English at home - Foreign born (%)
Residents speaking Spanish at home (%)
Residents speaking Spanish at home - Born in the United States (%)
Residents speaking Spanish at home - Native, born elsewhere (%)
Residents speaking Spanish at home - Foreign born (%)
Residents speaking other language at home (%)
Residents speaking other language at home - Born in the United States (%)
Residents speaking other language at home - Native, born elsewhere (%)
Residents speaking other language at home - Foreign born (%)
Marital status - Never married (%)
Marital status - Now married (%)
Marital status - Separated (%)
Marital status - Widowed (%)
Marital status - Divorced (%)
Ancestries Reported - Arab (%)
Ancestries Reported - Czech (%)
Ancestries Reported - Danish (%)
Ancestries Reported - Dutch (%)
Ancestries Reported - English (%)
Ancestries Reported - French (%)
Ancestries Reported - French Canadian (%)
Ancestries Reported - German (%)
Ancestries Reported - Greek (%)
Ancestries Reported - Hungarian (%)
Ancestries Reported - Irish (%)
Ancestries Reported - Italian (%)
Ancestries Reported - Lithuanian (%)
Ancestries Reported - Norwegian (%)
Ancestries Reported - Polish (%)
Ancestries Reported - Portuguese (%)
Ancestries Reported - Russian (%)
Ancestries Reported - Scotch-Irish (%)
Ancestries Reported - Scottish (%)
Ancestries Reported - Slovak (%)
Ancestries Reported - Subsaharan African (%)
Ancestries Reported - Swedish (%)
Ancestries Reported - Swiss (%)
Ancestries Reported - Ukrainian (%)
Ancestries Reported - United States (%)
Ancestries Reported - Welsh (%)
Ancestries Reported - West Indian (%)
Ancestries Reported - Other (%)
Geographical mobility - Same house 1 year ago (%)
Geographical mobility - Same house 1 year ago (%) - White
Geographical mobility - Same house 1 year ago (%) - Black or African American
Geographical mobility - Same house 1 year ago (%) - Asian
Geographical mobility - Same house 1 year ago (%) - Hispanic or Latino
Geographical mobility - Same house 1 year ago (%) - American Indian and Alaska Native
Geographical mobility - Same house 1 year ago (%) - Multirace
Geographical mobility - Same house 1 year ago (%) - Other Race
Geographical mobility - Moved within same county (%)
Geographical mobility - Moved within same county (%) - White
Geographical mobility - Moved within same county (%) - Black or African American
Geographical mobility - Moved within same county (%) - Asian
Geographical mobility - Moved within same county (%) - Hispanic or Latino
Geographical mobility - Moved within same county (%) - American Indian and Alaska Native
Geographical mobility - Moved within same county (%) - Multirace
Geographical mobility - Moved within same county (%) - Other Race
Geographical mobility - Moved from different county within same state (%)
Geographical mobility - Moved from different county within same state (%) - White
Geographical mobility - Moved from different county within same state (%) - Black or African American
Geographical mobility - Moved from different county within same state (%) - Asian
Geographical mobility - Moved from different county within same state (%) - Hispanic or Latino
Geographical mobility - Moved from different county within same state (%) - American Indian and Alaska Native
Geographical mobility - Moved from different county within same state (%) - Multirace
Geographical mobility - Moved from different county within same state (%) - Other Race
Geographical mobility - Moved from different state (%)
Geographical mobility - Moved from different state (%) - White
Geographical mobility - Moved from different state (%) - Black or African American
Geographical mobility - Moved from different state (%) - Asian
Geographical mobility - Moved from different state (%) - Hispanic or Latino
Geographical mobility - Moved from different state (%) - American Indian and Alaska Native
Geographical mobility - Moved from different state (%) - Multirace
Geographical mobility - Moved from different state (%) - Other Race
Geographical mobility - Moved from abroad (%)
Geographical mobility - Moved from abroad (%) - White
Geographical mobility - Moved from abroad (%) - Black or African American
Geographical mobility - Moved from abroad (%) - Asian
Geographical mobility - Moved from abroad (%) - Hispanic or Latino
Geographical mobility - Moved from abroad (%) - American Indian and Alaska Native
Geographical mobility - Moved from abroad (%) - Multirace
Geographical mobility - Moved from abroad (%) - Other Race
Place of birth for the foreign-born population - Ireland (%)
Place of birth for the foreign-born population - Denmark (%)
Place of birth for the foreign-born population - Norway (%)
Place of birth for the foreign-born population - Sweden (%)
Place of birth for the foreign-born population - United Kingdom (%)
Place of birth for the foreign-born population - England (%)
Place of birth for the foreign-born population - Scotland (%)
Place of birth for the foreign-born population - Other Northern Europe (%)
Place of birth for the foreign-born population - Austria (%)
Place of birth for the foreign-born population - Belgium (%)
Place of birth for the foreign-born population - France (%)
Place of birth for the foreign-born population - Germany (%)
Place of birth for the foreign-born population - Netherlands (%)
Place of birth for the foreign-born population - Switzerland (%)
Place of birth for the foreign-born population - Other Western Europe (%)
Place of birth for the foreign-born population - Greece (%)
Place of birth for the foreign-born population - Italy (%)
Place of birth for the foreign-born population - Portugal (%)
Place of birth for the foreign-born population - Spain (%)
Place of birth for the foreign-born population - Other Southern Europe (%)
Place of birth for the foreign-born population - Albania (%)
Place of birth for the foreign-born population - Belarus (%)
Place of birth for the foreign-born population - Bosnia and Herzegovina (%)
Place of birth for the foreign-born population - Bulgaria (%)
Place of birth for the foreign-born population - Croatia (%)
Place of birth for the foreign-born population - Czechoslovakia (%)
Place of birth for the foreign-born population - Hungary (%)
Place of birth for the foreign-born population - Latvia (%)
Place of birth for the foreign-born population - Lithuania (%)
Place of birth for the foreign-born population - North Macedonia (Macedonia) (%)
Place of birth for the foreign-born population - Moldova (%)
Place of birth for the foreign-born population - Poland (%)
Place of birth for the foreign-born population - Romania (%)
Place of birth for the foreign-born population - Russia (%)
Place of birth for the foreign-born population - Serbia (%)
Place of birth for the foreign-born population - Ukraine (%)
Place of birth for the foreign-born population - Other Eastern Europe (%)
Place of birth for the foreign-born population - China (%)
Place of birth for the foreign-born population - Hong Kong (%)
Place of birth for the foreign-born population - Taiwan (%)
Place of birth for the foreign-born population - Japan (%)
Place of birth for the foreign-born population - Korea (%)
Place of birth for the foreign-born population - Other Eastern Asia (%)
Place of birth for the foreign-born population - Afghanistan (%)
Place of birth for the foreign-born population - Bangladesh (%)
Place of birth for the foreign-born population - India (%)
Place of birth for the foreign-born population - Iran (%)
Place of birth for the foreign-born population - Kazakhstan (%)
Place of birth for the foreign-born population - Nepal (%)
Place of birth for the foreign-born population - Pakistan (%)
Place of birth for the foreign-born population - Sri Lanka (%)
Place of birth for the foreign-born population - Uzbekistan (%)
Place of birth for the foreign-born population - Other South Central Asia (%)
Place of birth for the foreign-born population - Burma (%)
Place of birth for the foreign-born population - Cambodia (%)
Place of birth for the foreign-born population - Indonesia (%)
Place of birth for the foreign-born population - Laos (%)
Place of birth for the foreign-born population - Malaysia (%)
Place of birth for the foreign-born population - Philippines (%)
Place of birth for the foreign-born population - Singapore (%)
Place of birth for the foreign-born population - Thailand (%)
Place of birth for the foreign-born population - Vietnam (%)
Place of birth for the foreign-born population - Other South Eastern Asia (%)
Place of birth for the foreign-born population - Armenia (%)
Place of birth for the foreign-born population - Iraq (%)
Place of birth for the foreign-born population - Israel (%)
Place of birth for the foreign-born population - Jordan (%)
Place of birth for the foreign-born population - Kuwait (%)
Place of birth for the foreign-born population - Lebanon (%)
Place of birth for the foreign-born population - Saudi Arabia (%)
Place of birth for the foreign-born population - Syria (%)
Place of birth for the foreign-born population - Turkey (%)
Place of birth for the foreign-born population - Yemen (%)
Place of birth for the foreign-born population - Other Western Asia (%)
Place of birth for the foreign-born population - Eritrea (%)
Place of birth for the foreign-born population - Ethiopia (%)
Place of birth for the foreign-born population - Kenya (%)
Place of birth for the foreign-born population - Somalia (%)
Place of birth for the foreign-born population - Uganda (%)
Place of birth for the foreign-born population - Zimbabwe (%)
Place of birth for the foreign-born population - Other Eastern Africa (%)
Place of birth for the foreign-born population - Cameroon (%)
Place of birth for the foreign-born population - Congo (%)
Place of birth for the foreign-born population - Democratic Republic of Congo (Zaire) (%)
Place of birth for the foreign-born population - Other Middle Africa (%)
Place of birth for the foreign-born population - Egypt (%)
Place of birth for the foreign-born population - Morocco (%)
Place of birth for the foreign-born population - Sudan (%)
Place of birth for the foreign-born population - Other Northern Africa (%)
Place of birth for the foreign-born population - South Africa (%)
Place of birth for the foreign-born population - Other Southern Africa (%)
Place of birth for the foreign-born population - Cabo Verde (%)
Place of birth for the foreign-born population - Ghana (%)
Place of birth for the foreign-born population - Liberia (%)
Place of birth for the foreign-born population - Nigeria (%)
Place of birth for the foreign-born population - Senegal (%)
Place of birth for the foreign-born population - Sierra Leone (%)
Place of birth for the foreign-born population - Other Western Africa (%)
Place of birth for the foreign-born population - Australia (%)
Place of birth for the foreign-born population - New Zealand (%)
Place of birth for the foreign-born population - Fiji (%)
Place of birth for the foreign-born population - Micronesia (%)
Place of birth for the foreign-born population - Bahamas (%)
Place of birth for the foreign-born population - Barbados (%)
Place of birth for the foreign-born population - Cuba (%)
Place of birth for the foreign-born population - Dominica (%)
Place of birth for the foreign-born population - Dominican Republic (%)
Place of birth for the foreign-born population - Grenada (%)
Place of birth for the foreign-born population - Haiti (%)
Place of birth for the foreign-born population - Jamaica (%)
Place of birth for the foreign-born population - St. Vincent and the Grenadines (%)
Place of birth for the foreign-born population - Trinidad and Tobago (%)
Place of birth for the foreign-born population - West Indies (%)
Place of birth for the foreign-born population - Other Caribbean (%)
Place of birth for the foreign-born population - Belize (%)
Place of birth for the foreign-born population - Costa Rica (%)
Place of birth for the foreign-born population - El Salvador (%)
Place of birth for the foreign-born population - Guatemala (%)
Place of birth for the foreign-born population - Honduras (%)
Place of birth for the foreign-born population - Mexico (%)
Place of birth for the foreign-born population - Nicaragua (%)
Place of birth for the foreign-born population - Panama (%)
Place of birth for the foreign-born population - Other Central America (%)
Place of birth for the foreign-born population - Argentina (%)
Place of birth for the foreign-born population - Bolivia (%)
Place of birth for the foreign-born population - Brazil (%)
Place of birth for the foreign-born population - Chile (%)
Place of birth for the foreign-born population - Colombia (%)
Place of birth for the foreign-born population - Ecuador (%)
Place of birth for the foreign-born population - Guyana (%)
Place of birth for the foreign-born population - Peru (%)
Place of birth for the foreign-born population - Uruguay (%)
Place of birth for the foreign-born population - Venezuela (%)
Place of birth for the foreign-born population - Other South America (%)
Place of birth for the foreign-born population - Canada (%)
Place of birth for the foreign-born population - Other Northern America (%)
Place of birth for the foreign-born population - Other (%)
Latest news about races in Moline, IL collected exclusively by city-data.com from local newspapers, TV, and radio stations
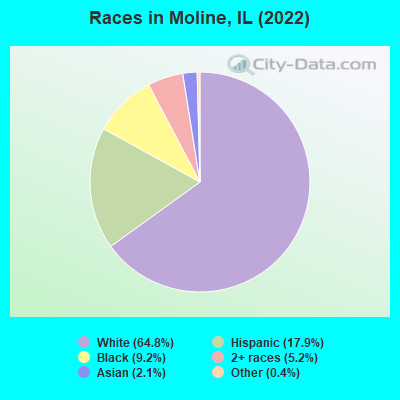
According to 2022 data, the most numerous races in Moline, IL are White alone (27,058 residents), Hispanic (7,464 residents), and Black alone (3,861 residents). 85.6% of Moline residents speak English at home. 9.0% of Moline, IL residents are foreign-born (5.1% born in Latin America, 1.8% born in Africa, 1.6% born in Asia), which is 54.8% less than the foreign-born rate of 14.0% across the entire state of Illinois.
Race distribution in Moline
2000 2022
8,424,140 67.8% White alone 1,856,152 14.9% Black alone 1,530,262 12.3% Hispanic 419,916 3.4% Asian alone 153,996 1.2% Two or more races 13,479 0.1% Other race alone 18,232 0.1% American Indian alone 3,116 0.03% Native Hawaiian and Other
7,356,301 58.5% White alone 2,299,726 18.3% Hispanic 1,660,423 13.2% Black alone 747,296 5.9% Asian alone 458,599 3.6% Two or more races 45,386 0.4% Other race alone 10,405 0.08% American Indian alone 3,896 0.03% Native Hawaiian and Other
Income and house value in Moline Median household income in 2022 $73,280 White non-Hispanic householders$36,073 Black householders$95,433 American Indian and Alaska Native householders$60,860 Some other race householders$43,523 Two or more races householders$48,353 Hispanic or Latino race householdersMedian 2022 house value $144,266 White Non-Hispanic householders$147,437 Black or African American householders$85,432 American Indian or Alaska Native householders $380,660 Asian householders$108,860 Some other race householders$112,736 Two or more races householders$110,622 Hispanic or Latino householders
Median age by race in Moline
45.6 Median age for White residents44.0 47.7 26.0 Median age for Black or African American residents21.2 30.9 66.4 Median age for American Indian / Alaska Native residents81.1 30.4 32.7 Median age for Asian residents26.0 36.6 -593,236,714.4 Median age for Native Hawaiian / Pacific Islander residents-658,536,584.7 -576,015,108.0 38.0 Median age for Other race residents36.2 37.3 25.0 Median age for Two or more races residents23.9 25.2 47.2 Median age for White alone residents44.5 50.3 32.7 Median age for Hispanic or Latino residents32.7 32.7
Owner/renter occupied households by race in Moline
House owners and renters - White residents 10,455 72.7% Owner occupied3,917 27.3% Renter occupiedHouse owners and renters - Black or African American residents 496 34.7% Owner occupied935 65.3% Renter occupiedHouse owners and renters - American Indian / Alaska Native residents 25 100.0% Owner occupiedHouse owners and renters - Asian residents 195 56.1% Owner occupied152 43.9% Renter occupiedHouse owners and renters - Native Hawaiian / Pacific Islander residents 10 100.0% Owner occupiedHouse owners and renters - Other race residents 709 61.6% Owner occupied441 38.4% Renter occupiedHouse owners and renters - Two or more races residents 801 58.5% Owner occupied569 41.5% Renter occupiedHouse owners and renters - White alone residents 9,702 72.6% Owner occupied3,661 27.4% Renter occupiedHouse owners and renters - Hispanic or Latino residents 1,708 70.9% Owner occupied703 29.1% Renter occupied
Language usage in Moline
English speakers - Total 85.6% of residents of Moline speak English at home.
10.9% of residents speak Spanish at home 2,531 59.1% Speak English very well1,753 40.9% Speak English less than very well3.7% of residents speak other language at home 908 62.3% Speak English very well549 37.7% Speak English less than very well
English speakers - Born in the United States 94.1% of residents of Moline speak English at home.
6.3% of residents speak Spanish at home 395 60.2% Speak English very well261 39.8% Speak English less than very well0.7% of residents speak other language at home 73 98.6% Speak English very well1 1.4% Speak English less than very well
English speakers - Native, born elsewhere 77.8% of residents of Moline speak English at home.
10.8% of residents speak Spanish at home 31 63.3% Speak English very well18 36.7% Speak English less than very well42.6% of residents speak other language at home 168 86.6% Speak English very well26 13.4% Speak English less than very well
English speakers - Foreign-born 9.0% of residents of Moline speak English at home.
59.0% of residents speak Spanish at home 539 31.2% Speak English very well1,190 68.8% Speak English less than very well34.7% of residents speak other language at home 593 58.3% Speak English very well425 41.7% Speak English less than very well
White (Caucasian) - Speak only English Native:
97.0% (26,935)Foreign-born:
21.1% (95)
White (Caucasian) - Speak another language Native:
2.8% (790)Foreign-born:
96.7% (436)
Black or African American - Speak only English Native:
93.4% (2,815)Foreign-born:
23.7% (101)
Black or African American - Speak another language Native:
6.6% (199)Foreign-born:
100.0% (425)
American Indian / Alaska Native - Speak another language Native:
8.4% (8)Foreign-born:
100.0% (14)
Asian - Speak only English Native:
27.8% (47)Foreign-born:
2.0% (13)
Asian - Speak another language Native:
73.0% (124)Foreign-born:
99.5% (667)
Other race - Speak only English Native:
36.4% (694)Foreign-born:
4.5% (46)
Other race - Speak another language Native:
62.1% (1,185)Foreign-born:
95.6% (985)
Two or more races - Speak only English Native:
81.8% (2,990)Foreign-born:
12.3% (62)
Two or more races - Speak another language Native:
18.6% (679)Foreign-born:
88.4% (447)
White alone - Speak only English Native:
99.1% (25,622)Foreign-born:
32.4% (96)
White alone - Speak another language Native:
0.9% (233)Foreign-born:
66.3% (196)
Hispanic or Latino - Speak only English Native:
56.3% (2,859)Foreign-born:
4.0% (72)
Hispanic or Latino - Speak another language Native:
43.4% (2,206)Foreign-born:
96.0% (1,736)
Foreign-born residents in Moline 3,779 residents are foreign born (5.1% Latin America , 1.8% Africa , 1.6% Asia ).
This city:
9.0%Illinois:
14.1%
Marital status for residents in Moline Marital status - White (Caucasian) population 15 years and over
Males 30.3% Never married53.1% Now married1.6% Separated4.0% Widowed11.0% DivorcedFemales 26.2% Never married48.3% Now married1.2% Separated10.3% Widowed14.0% DivorcedWomen who gave birth in the past 12 months Now married:
54.4% (145)Unmarried:
45.6% (122)
Women who did not give birth in the past 12 months Now married:
43.8% (2,531)Unmarried:
56.2% (3,247)
Marital status - Black or African American population 15 years and over
Males 52.9% Never married31.9% Now married1.6% Separated0.5% Widowed13.1% DivorcedFemales 51.1% Never married35.7% Now married1.2% Separated5.8% Widowed6.2% DivorcedWomen who gave birth in the past 12 months Now married:
36.4% (38)Unmarried:
63.6% (66)
Women who did not give birth in the past 12 months Now married:
35.2% (199)Unmarried:
64.8% (366)
Marital status - American Indian / Alaska Native population 15 years and over
Males 78.3% Never married19.6% Now married0.0% Separated0.0% Widowed2.2% DivorcedFemales 0.0% Never married100.0% Now married0.0% Separated0.0% Widowed0.0% DivorcedWomen who gave birth in the past 12 months Now married:
100.0% (7)Unmarried:
0.0% (0)
Women who did not give birth in the past 12 months Now married:
100.0% (20)Unmarried:
0.0% (0)
Marital status - Asian population 15 years and over
Males 23.5% Never married76.5% Now married0.0% Separated0.0% Widowed0.0% DivorcedFemales 21.7% Never married65.6% Now married1.4% Separated4.2% Widowed7.2% DivorcedWomen who gave birth in the past 12 months Now married:
100.0% (7)Unmarried:
0.0% (0)
Women who did not give birth in the past 12 months Now married:
68.3% (202)Unmarried:
31.7% (94)
Marital status - Other race population 15 years and over
Males 29.7% Never married55.2% Now married0.0% Separated0.0% Widowed15.1% DivorcedFemales 46.2% Never married39.8% Now married5.8% Separated1.2% Widowed7.0% DivorcedWomen who gave birth in the past 12 months Now married:
0.0% (0)Unmarried:
100.0% (5)
Women who did not give birth in the past 12 months Now married:
42.3% (366)Unmarried:
57.7% (499)
Marital status - Two or more races population 15 years and over
Males 43.4% Never married42.7% Now married6.2% Separated3.0% Widowed4.7% DivorcedFemales 43.1% Never married43.1% Now married0.6% Separated6.1% Widowed7.2% DivorcedWomen who gave birth in the past 12 months Now married:
48.6% (26)Unmarried:
51.4% (28)
Women who did not give birth in the past 12 months Now married:
36.8% (376)Unmarried:
63.2% (645)
Marital status - White alone, not Hispanic / Latino population 15 years and over
Males 29.2% Never married53.8% Now married1.5% Separated4.2% Widowed11.2% DivorcedFemales 25.3% Never married48.8% Now married1.0% Separated10.7% Widowed14.2% DivorcedWomen who gave birth in the past 12 months Now married:
55.9% (133)Unmarried:
44.1% (105)
Women who did not give birth in the past 12 months Now married:
44.4% (2,286)Unmarried:
55.6% (2,858)
Marital status - Hispanic or Latino population 15 years and over
Males 38.0% Never married48.2% Now married3.2% Separated1.2% Widowed9.5% DivorcedFemales 42.2% Never married41.2% Now married3.9% Separated5.0% Widowed7.8% DivorcedWomen who gave birth in the past 12 months Now married:
33.3% (21)Unmarried:
66.7% (43)
Women who did not give birth in the past 12 months Now married:
38.2% (693)Unmarried:
61.8% (1,123)
Ancestries in Moline
2,117 12.7% German1,287 7.7% English1,005 6.0% Irish971 5.8% American722 4.3% Swedish495 3.0% European376 2.2% Belgian290 1.7% African215 1.3% Italian161 1.0% French140 0.8% Polish139 0.8% Norwegian129 0.8% Scandinavian126 0.8% Dutch95 0.6% Scottish93 0.6% Scotch-Irish68 0.4% Northern European60 0.4% Czech58 0.3% Eastern European50 0.3% Moroccan44 0.3% Greek39 0.2% British34 0.2% Welsh33 0.2% Lebanese24 0.1% Finnish19 0.1% Russian15 0.09% Croatian14 0.08% Hungarian13 0.08% Belizean7 0.04% Danish7 0.04% Ukrainian6 0.04% Brazilian4 0.02% Turkish2 0.01% Romanian
Geographical mobility in Moline Same house 1 year ago 25,768 87.7% White (Caucasian)3,056 85.4% Black or African American113 92.1% American Indian / Alaska Native743 77.4% Asian12 100.0% Native Hawaiian / Pacific Islander3,047 92.2% Other race3,812 79.9% Two or more races24,041 89.3% White alone, not Hispanic / Latino6,302 84.7% Hispanic or LatinoMoved within same county 1,835 6.2% White / Caucasian494 13.8% Black or African American10 7.7% American Indian / Alaska Native15 1.6% Asian199 6.0% Other race404 8.5% Two or more races1,269 4.7% White alone, not Hispanic / Latino770 10.4% Hispanic or LatinoMoved within same state 665 2.3% White / Caucasian182 5.1% Black or African American154 16.1% Asian14 0.4% Other race186 3.9% Two or more races631 2.3% White alone, not Hispanic / Latino83 1.1% Hispanic or LatinoMoved from different state 1,069 3.6% White / Caucasian68 1.9% Black or African American22 2.3% Asian61 1.3% Two or more races893 3.3% White alone, not Hispanic / Latino65 0.9% Hispanic or LatinoMoved from abroad 11 0.0% White32 0.9% Black or African American49 5.1% Asian38 1.1% Other race12 0.3% Two or more races11 0.0% White alone, not Hispanic / Latino38 0.5% Hispanic or Latino
Children Nativity (place of birth) in Moline
Children under 6 years - Living with two parents Both parents native 1,042 100.0% NativeBoth parents foreign-born 388 100.0% NativeOne native, one foreign-born parent 130 100.0% NativeChildren under 6 years - Living with one parent Native parent 1,139 100.0% NativeForeign-born parent 60 100.0% NativeChildren 6 to 17 years - Living with two parents Both parents native 2,404 95.1% Native123 4.9% Foreign-bornBoth parents foreign-born 495 86.0% Native81 14.0% Foreign-bornOne native, one foreign-born parent 283 90.4% Native30 9.6% Foreign-bornChildren 6 to 17 years - Living with one parent Native parent 2,654 100.0% NativeForeign-born parent 714 51.1% Native684 48.9% Foreign-born
Grandparents responsible for own grandchildren in Moline
Grandparents (30 to 59 years) White / Caucasian 58 43.7% Responsible for grandchildren75 56.3% Not responsible for grandchildrenBlack or African American 3 100.0% Not responsible for grandchildrenOther race 68 100.0% Responsible for grandchildrenTwo or more races 47 96.8% Responsible for grandchildren2 3.2% Not responsible for grandchildrenWhite alone, not Hispanic / Latino 64 52.1% Responsible for grandchildren59 47.9% Not responsible for grandchildrenHispanic or Latino 77 58.7% Responsible for grandchildren54 41.3% Not responsible for grandchildrenGrandparents (60 years and over) White / Caucasian 136 52.0% Responsible for grandchildren126 48.0% Not responsible for grandchildrenBlack or African American 8 15.3% Responsible for grandchildren46 84.7% Not responsible for grandchildrenOther race 110 100.0% Not responsible for grandchildrenTwo or more races 35 27.8% Responsible for grandchildren90 72.2% Not responsible for grandchildrenWhite alone, not Hispanic / Latino 136 61.4% Responsible for grandchildren86 38.6% Not responsible for grandchildrenHispanic or Latino 225 100.0% Not responsible for grandchildren