Races in Mineral Wells, Texas (TX) Detailed Stats
Data:
Races - White alone (%)
Races - White alone (% change since 2000)
Races - Black alone (%)
Races - Black alone (% change since 2000)
Races - American Indian alone (%)
Races - American Indian alone (% change since 2000)
Races - Asian alone (%)
Races - Asian alone (% change since 2000)
Races - Hispanic (%)
Races - Hispanic (% change since 2000)
Races - Native Hawaiian and Other Pacific Islander alone (%)
Races - Native Hawaiian and Other Pacific Islander alone (% change since 2000)
Races - Two or more races(%)
Races - Two or more races(% change since 2000)
Races - Other race alone (%)
Races - Other race alone (% change since 2000)
Racial diversity
Place of birth - Born in state of residence (%)
Place of birth - Born in state of residence (%) - White
Place of birth - Born in state of residence (%) - Black or African American
Place of birth - Born in state of residence (%) - Asian
Place of birth - Born in state of residence (%) - Hispanic or Latino
Place of birth - Born in state of residence (%) - American Indian and Alaska Native
Place of birth - Born in state of residence (%) - Multirace
Place of birth - Born in state of residence (%) - Other Race
Place of birth - Born in other state (%)
Place of birth - Born in other state (%) - White
Place of birth - Born in other state (%) - Black or African American
Place of birth - Born in other state (%) - Asian
Place of birth - Born in other state (%) - Hispanic or Latino
Place of birth - Born in other state (%) - American Indian and Alaska Native
Place of birth - Born in other state (%) - Multirace
Place of birth - Born in other state (%) - Other Race
Place of birth - Native, outside of US (%)
Place of birth - Native, outside of US (%) - White
Place of birth - Native, outside of US (%) - Black or African American
Place of birth - Native, outside of US (%) - Asian
Place of birth - Native, outside of US (%) - Hispanic or Latino
Place of birth - Native, outside of US (%) - American Indian and Alaska Native
Place of birth - Native, outside of US (%) - Multirace
Place of birth - Native, outside of US (%) - Other Race
Place of birth - Foreign born (%)
Place of birth - Foreign born (%) - White
Place of birth - Foreign born (%) - Black or African American
Place of birth - Foreign born (%) - Asian
Place of birth - Foreign born (%) - Hispanic or Latino
Place of birth - Foreign born (%) - American Indian and Alaska Native
Place of birth - Foreign born (%) - Multirace
Place of birth - Foreign born (%) - Other Race
Residents speaking English at home (%)
Residents speaking English at home - Born in the United States (%)
Residents speaking English at home - Native, born elsewhere (%)
Residents speaking English at home - Foreign born (%)
Residents speaking Spanish at home (%)
Residents speaking Spanish at home - Born in the United States (%)
Residents speaking Spanish at home - Native, born elsewhere (%)
Residents speaking Spanish at home - Foreign born (%)
Residents speaking other language at home (%)
Residents speaking other language at home - Born in the United States (%)
Residents speaking other language at home - Native, born elsewhere (%)
Residents speaking other language at home - Foreign born (%)
Marital status - Never married (%)
Marital status - Now married (%)
Marital status - Separated (%)
Marital status - Widowed (%)
Marital status - Divorced (%)
Ancestries Reported - Arab (%)
Ancestries Reported - Czech (%)
Ancestries Reported - Danish (%)
Ancestries Reported - Dutch (%)
Ancestries Reported - English (%)
Ancestries Reported - French (%)
Ancestries Reported - French Canadian (%)
Ancestries Reported - German (%)
Ancestries Reported - Greek (%)
Ancestries Reported - Hungarian (%)
Ancestries Reported - Irish (%)
Ancestries Reported - Italian (%)
Ancestries Reported - Lithuanian (%)
Ancestries Reported - Norwegian (%)
Ancestries Reported - Polish (%)
Ancestries Reported - Portuguese (%)
Ancestries Reported - Russian (%)
Ancestries Reported - Scotch-Irish (%)
Ancestries Reported - Scottish (%)
Ancestries Reported - Slovak (%)
Ancestries Reported - Subsaharan African (%)
Ancestries Reported - Swedish (%)
Ancestries Reported - Swiss (%)
Ancestries Reported - Ukrainian (%)
Ancestries Reported - United States (%)
Ancestries Reported - Welsh (%)
Ancestries Reported - West Indian (%)
Ancestries Reported - Other (%)
Geographical mobility - Same house 1 year ago (%)
Geographical mobility - Same house 1 year ago (%) - White
Geographical mobility - Same house 1 year ago (%) - Black or African American
Geographical mobility - Same house 1 year ago (%) - Asian
Geographical mobility - Same house 1 year ago (%) - Hispanic or Latino
Geographical mobility - Same house 1 year ago (%) - American Indian and Alaska Native
Geographical mobility - Same house 1 year ago (%) - Multirace
Geographical mobility - Same house 1 year ago (%) - Other Race
Geographical mobility - Moved within same county (%)
Geographical mobility - Moved within same county (%) - White
Geographical mobility - Moved within same county (%) - Black or African American
Geographical mobility - Moved within same county (%) - Asian
Geographical mobility - Moved within same county (%) - Hispanic or Latino
Geographical mobility - Moved within same county (%) - American Indian and Alaska Native
Geographical mobility - Moved within same county (%) - Multirace
Geographical mobility - Moved within same county (%) - Other Race
Geographical mobility - Moved from different county within same state (%)
Geographical mobility - Moved from different county within same state (%) - White
Geographical mobility - Moved from different county within same state (%) - Black or African American
Geographical mobility - Moved from different county within same state (%) - Asian
Geographical mobility - Moved from different county within same state (%) - Hispanic or Latino
Geographical mobility - Moved from different county within same state (%) - American Indian and Alaska Native
Geographical mobility - Moved from different county within same state (%) - Multirace
Geographical mobility - Moved from different county within same state (%) - Other Race
Geographical mobility - Moved from different state (%)
Geographical mobility - Moved from different state (%) - White
Geographical mobility - Moved from different state (%) - Black or African American
Geographical mobility - Moved from different state (%) - Asian
Geographical mobility - Moved from different state (%) - Hispanic or Latino
Geographical mobility - Moved from different state (%) - American Indian and Alaska Native
Geographical mobility - Moved from different state (%) - Multirace
Geographical mobility - Moved from different state (%) - Other Race
Geographical mobility - Moved from abroad (%)
Geographical mobility - Moved from abroad (%) - White
Geographical mobility - Moved from abroad (%) - Black or African American
Geographical mobility - Moved from abroad (%) - Asian
Geographical mobility - Moved from abroad (%) - Hispanic or Latino
Geographical mobility - Moved from abroad (%) - American Indian and Alaska Native
Geographical mobility - Moved from abroad (%) - Multirace
Geographical mobility - Moved from abroad (%) - Other Race
Place of birth for the foreign-born population - Ireland (%)
Place of birth for the foreign-born population - Denmark (%)
Place of birth for the foreign-born population - Norway (%)
Place of birth for the foreign-born population - Sweden (%)
Place of birth for the foreign-born population - United Kingdom (%)
Place of birth for the foreign-born population - England (%)
Place of birth for the foreign-born population - Scotland (%)
Place of birth for the foreign-born population - Other Northern Europe (%)
Place of birth for the foreign-born population - Austria (%)
Place of birth for the foreign-born population - Belgium (%)
Place of birth for the foreign-born population - France (%)
Place of birth for the foreign-born population - Germany (%)
Place of birth for the foreign-born population - Netherlands (%)
Place of birth for the foreign-born population - Switzerland (%)
Place of birth for the foreign-born population - Other Western Europe (%)
Place of birth for the foreign-born population - Greece (%)
Place of birth for the foreign-born population - Italy (%)
Place of birth for the foreign-born population - Portugal (%)
Place of birth for the foreign-born population - Spain (%)
Place of birth for the foreign-born population - Other Southern Europe (%)
Place of birth for the foreign-born population - Albania (%)
Place of birth for the foreign-born population - Belarus (%)
Place of birth for the foreign-born population - Bosnia and Herzegovina (%)
Place of birth for the foreign-born population - Bulgaria (%)
Place of birth for the foreign-born population - Croatia (%)
Place of birth for the foreign-born population - Czechoslovakia (%)
Place of birth for the foreign-born population - Hungary (%)
Place of birth for the foreign-born population - Latvia (%)
Place of birth for the foreign-born population - Lithuania (%)
Place of birth for the foreign-born population - North Macedonia (Macedonia) (%)
Place of birth for the foreign-born population - Moldova (%)
Place of birth for the foreign-born population - Poland (%)
Place of birth for the foreign-born population - Romania (%)
Place of birth for the foreign-born population - Russia (%)
Place of birth for the foreign-born population - Serbia (%)
Place of birth for the foreign-born population - Ukraine (%)
Place of birth for the foreign-born population - Other Eastern Europe (%)
Place of birth for the foreign-born population - China (%)
Place of birth for the foreign-born population - Hong Kong (%)
Place of birth for the foreign-born population - Taiwan (%)
Place of birth for the foreign-born population - Japan (%)
Place of birth for the foreign-born population - Korea (%)
Place of birth for the foreign-born population - Other Eastern Asia (%)
Place of birth for the foreign-born population - Afghanistan (%)
Place of birth for the foreign-born population - Bangladesh (%)
Place of birth for the foreign-born population - India (%)
Place of birth for the foreign-born population - Iran (%)
Place of birth for the foreign-born population - Kazakhstan (%)
Place of birth for the foreign-born population - Nepal (%)
Place of birth for the foreign-born population - Pakistan (%)
Place of birth for the foreign-born population - Sri Lanka (%)
Place of birth for the foreign-born population - Uzbekistan (%)
Place of birth for the foreign-born population - Other South Central Asia (%)
Place of birth for the foreign-born population - Burma (%)
Place of birth for the foreign-born population - Cambodia (%)
Place of birth for the foreign-born population - Indonesia (%)
Place of birth for the foreign-born population - Laos (%)
Place of birth for the foreign-born population - Malaysia (%)
Place of birth for the foreign-born population - Philippines (%)
Place of birth for the foreign-born population - Singapore (%)
Place of birth for the foreign-born population - Thailand (%)
Place of birth for the foreign-born population - Vietnam (%)
Place of birth for the foreign-born population - Other South Eastern Asia (%)
Place of birth for the foreign-born population - Armenia (%)
Place of birth for the foreign-born population - Iraq (%)
Place of birth for the foreign-born population - Israel (%)
Place of birth for the foreign-born population - Jordan (%)
Place of birth for the foreign-born population - Kuwait (%)
Place of birth for the foreign-born population - Lebanon (%)
Place of birth for the foreign-born population - Saudi Arabia (%)
Place of birth for the foreign-born population - Syria (%)
Place of birth for the foreign-born population - Turkey (%)
Place of birth for the foreign-born population - Yemen (%)
Place of birth for the foreign-born population - Other Western Asia (%)
Place of birth for the foreign-born population - Eritrea (%)
Place of birth for the foreign-born population - Ethiopia (%)
Place of birth for the foreign-born population - Kenya (%)
Place of birth for the foreign-born population - Somalia (%)
Place of birth for the foreign-born population - Uganda (%)
Place of birth for the foreign-born population - Zimbabwe (%)
Place of birth for the foreign-born population - Other Eastern Africa (%)
Place of birth for the foreign-born population - Cameroon (%)
Place of birth for the foreign-born population - Congo (%)
Place of birth for the foreign-born population - Democratic Republic of Congo (Zaire) (%)
Place of birth for the foreign-born population - Other Middle Africa (%)
Place of birth for the foreign-born population - Egypt (%)
Place of birth for the foreign-born population - Morocco (%)
Place of birth for the foreign-born population - Sudan (%)
Place of birth for the foreign-born population - Other Northern Africa (%)
Place of birth for the foreign-born population - South Africa (%)
Place of birth for the foreign-born population - Other Southern Africa (%)
Place of birth for the foreign-born population - Cabo Verde (%)
Place of birth for the foreign-born population - Ghana (%)
Place of birth for the foreign-born population - Liberia (%)
Place of birth for the foreign-born population - Nigeria (%)
Place of birth for the foreign-born population - Senegal (%)
Place of birth for the foreign-born population - Sierra Leone (%)
Place of birth for the foreign-born population - Other Western Africa (%)
Place of birth for the foreign-born population - Australia (%)
Place of birth for the foreign-born population - New Zealand (%)
Place of birth for the foreign-born population - Fiji (%)
Place of birth for the foreign-born population - Micronesia (%)
Place of birth for the foreign-born population - Bahamas (%)
Place of birth for the foreign-born population - Barbados (%)
Place of birth for the foreign-born population - Cuba (%)
Place of birth for the foreign-born population - Dominica (%)
Place of birth for the foreign-born population - Dominican Republic (%)
Place of birth for the foreign-born population - Grenada (%)
Place of birth for the foreign-born population - Haiti (%)
Place of birth for the foreign-born population - Jamaica (%)
Place of birth for the foreign-born population - St. Vincent and the Grenadines (%)
Place of birth for the foreign-born population - Trinidad and Tobago (%)
Place of birth for the foreign-born population - West Indies (%)
Place of birth for the foreign-born population - Other Caribbean (%)
Place of birth for the foreign-born population - Belize (%)
Place of birth for the foreign-born population - Costa Rica (%)
Place of birth for the foreign-born population - El Salvador (%)
Place of birth for the foreign-born population - Guatemala (%)
Place of birth for the foreign-born population - Honduras (%)
Place of birth for the foreign-born population - Mexico (%)
Place of birth for the foreign-born population - Nicaragua (%)
Place of birth for the foreign-born population - Panama (%)
Place of birth for the foreign-born population - Other Central America (%)
Place of birth for the foreign-born population - Argentina (%)
Place of birth for the foreign-born population - Bolivia (%)
Place of birth for the foreign-born population - Brazil (%)
Place of birth for the foreign-born population - Chile (%)
Place of birth for the foreign-born population - Colombia (%)
Place of birth for the foreign-born population - Ecuador (%)
Place of birth for the foreign-born population - Guyana (%)
Place of birth for the foreign-born population - Peru (%)
Place of birth for the foreign-born population - Uruguay (%)
Place of birth for the foreign-born population - Venezuela (%)
Place of birth for the foreign-born population - Other South America (%)
Place of birth for the foreign-born population - Canada (%)
Place of birth for the foreign-born population - Other Northern America (%)
Place of birth for the foreign-born population - Other (%)
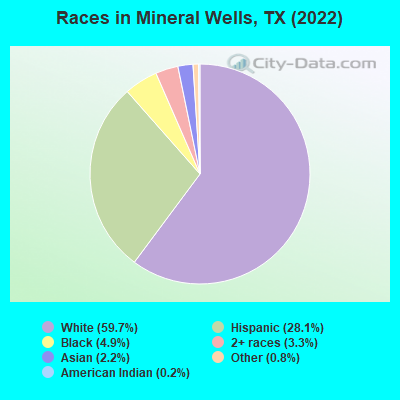
According to 2022 data, the most numerous races in Mineral Wells, TX are Hispanic (4,341 residents), White alone (9,228 residents), and Black alone (760 residents). 80.6% of Mineral Wells residents speak English at home. 7.7% of Mineral Wells, TX residents are foreign-born (5.9% born in Latin America, 1.3% born in Asia), which is 121.1% less than the foreign-born rate of 17.0% across the entire state of Texas.
Race distribution in Mineral Wells
2000 2022
10,933,313 52.4% White alone 6,669,666 32.0% Hispanic 2,364,255 11.3% Black alone 554,445 2.7% Asian alone 230,567 1.1% Two or more races 68,859 0.3% American Indian alone 19,958 0.10% Other race alone 10,757 0.05% Native Hawaiian and Other
12,070,642 40.2% Hispanic 11,683,430 38.9% White alone 3,508,706 11.7% Black alone 1,608,173 5.4% Asian alone 956,560 3.2% Two or more races 125,763 0.4% Other race alone 47,023 0.2% American Indian alone 29,275 0.10% Native Hawaiian and Other
Income and house value in Mineral Wells Median household income in 2022 $55,487 White non-Hispanic householders$90,171 American Indian and Alaska Native householders$93,258 Asian householders$42,486 Some other race householders$61,002 Two or more races householders$65,252 Hispanic or Latino race householdersMedian 2022 house value $172,781 White Non-Hispanic householders$120,834 Black or African American householders$114,434 American Indian or Alaska Native householders $118,951 Asian householders$97,871 Some other race householders$61,358 Two or more races householders$90,343 Hispanic or Latino householders
Median age by race in Mineral Wells
36.8 Median age for White residents35.3 39.9 44.6 Median age for Black or African American residents40.8 45.0 11.0 Median age for American Indian / Alaska Native residents9.1 11.1 35.3 Median age for Asian residents35.6 31.5 -581,560,283.1 Median age for Native Hawaiian / Pacific Islander residents-612,729,233.5 -577,777,777.2 43.0 Median age for Other race residents32.9 46.2 21.6 Median age for Two or more races residents21.5 36.0 39.9 Median age for White alone residents36.2 42.3 26.5 Median age for Hispanic or Latino residents26.1 28.8
Owner/renter occupied households by race in Mineral Wells
House owners and renters - White residents 2,158 57.6% Owner occupied1,588 42.4% Renter occupiedHouse owners and renters - Black or African American residents 123 43.5% Owner occupied159 56.5% Renter occupiedHouse owners and renters - American Indian / Alaska Native residents 40 69.3% Owner occupied18 30.7% Renter occupiedHouse owners and renters - Asian residents 65 58.5% Owner occupied46 41.5% Renter occupiedHouse owners and renters - Other race residents 322 87.7% Owner occupied45 12.3% Renter occupiedHouse owners and renters - Two or more races residents 406 80.2% Owner occupied100 19.8% Renter occupiedHouse owners and renters - White alone residents 2,034 55.1% Owner occupied1,656 44.9% Renter occupiedHouse owners and renters - Hispanic or Latino residents 884 75.9% Owner occupied281 24.1% Renter occupied
Language usage in Mineral Wells
English speakers - Total 80.6% of residents of Mineral Wells speak English at home.
17.1% of residents speak Spanish at home 1,773 71.9% Speak English very well693 28.1% Speak English less than very well2.2% of residents speak other language at home 246 76.2% Speak English very well77 23.8% Speak English less than very well
English speakers - Born in the United States 85.8% of residents of Mineral Wells speak English at home.
12.8% of residents speak Spanish at home 201 81.7% Speak English very well45 18.3% Speak English less than very well1.1% of residents speak other language at home 22 100.0% Speak English very well
English speakers - Native, born elsewhere 39.5% of residents of Mineral Wells speak English at home.
59.3% of residents speak Spanish at home 147 100.0% Speak English very well
English speakers - Foreign-born 5.8% of residents of Mineral Wells speak English at home.
76.3% of residents speak Spanish at home 347 38.3% Speak English very well559 61.7% Speak English less than very well17.5% of residents speak other language at home 141 67.8% Speak English very well67 32.2% Speak English less than very well
White (Caucasian) - Speak only English Native:
100.0% (8,986)Foreign-born:
22.9% (49)
White (Caucasian) - Speak another language Native:
4.7% (424)Foreign-born:
76.9% (164)
Asian - Speak only English Native:
33.1% (43)Foreign-born:
3.6% (8)
Asian - Speak another language Native:
66.5% (86)Foreign-born:
96.1% (206)
Other race - Speak another language Native:
56.6% (453)Foreign-born:
99.5% (393)
Two or more races - Speak another language Native:
39.5% (619)Foreign-born:
100.0% (303)
White alone - Speak only English Native:
98.4% (8,433)Foreign-born:
67.6% (58)
White alone - Speak another language Native:
1.6% (141)Foreign-born:
32.5% (28)
Hispanic or Latino - Speak another language Native:
45.2% (1,437)Foreign-born:
99.6% (882)
Foreign-born residents in Mineral Wells 1,188 residents are foreign born (5.9% Latin America , 1.3% Asia ).
This city:
7.7%Texas:
17.1%
Marital status for residents in Mineral Wells Marital status - White (Caucasian) population 15 years and over
Males 35.1% Never married42.8% Now married3.2% Separated6.9% Widowed12.0% DivorcedFemales 28.9% Never married40.4% Now married2.0% Separated8.4% Widowed20.4% DivorcedWomen who gave birth in the past 12 months Now married:
48.3% (82)Unmarried:
51.7% (88)
Women who did not give birth in the past 12 months Now married:
40.1% (858)Unmarried:
59.9% (1,281)
Marital status - Black or African American population 15 years and over
Males 23.4% Never married45.3% Now married0.0% Separated0.0% Widowed31.2% DivorcedFemales 44.3% Never married35.2% Now married2.8% Separated1.2% Widowed16.5% DivorcedWomen who did not give birth in the past 12 months Now married:
44.3% (83)Unmarried:
55.7% (104)
Marital status - American Indian / Alaska Native population 15 years and over
Males 87.9% Never married0.0% Now married0.0% Separated0.0% Widowed12.1% DivorcedFemales 15.1% Never married0.0% Now married0.0% Separated67.9% Widowed17.0% DivorcedWomen who gave birth in the past 12 months Now married:
0.0% (0)Unmarried:
100.0% (6)
Women who did not give birth in the past 12 months Now married:
0.0% (0)Unmarried:
100.0% (24)
Marital status - Asian population 15 years and over
Males 18.9% Never married81.1% Now married0.0% Separated0.0% Widowed0.0% DivorcedFemales 0.0% Never married81.7% Now married0.0% Separated8.3% Widowed10.1% DivorcedWomen who gave birth in the past 12 months Now married:
100.0% (4)Unmarried:
0.0% (0)
Women who did not give birth in the past 12 months Now married:
86.6% (76)Unmarried:
13.4% (12)
Marital status - Other race population 15 years and over
Males 28.8% Never married54.0% Now married17.2% Separated0.0% Widowed0.0% DivorcedFemales 23.6% Never married44.5% Now married7.6% Separated9.3% Widowed15.0% DivorcedWomen who did not give birth in the past 12 months Now married:
54.7% (185)Unmarried:
45.3% (154)
Marital status - Two or more races population 15 years and over
Males 52.0% Never married17.4% Now married0.5% Separated1.8% Widowed28.3% DivorcedFemales 32.3% Never married32.6% Now married18.5% Separated2.6% Widowed14.1% DivorcedWomen who did not give birth in the past 12 months Now married:
43.9% (158)Unmarried:
56.1% (202)
Marital status - White alone, not Hispanic / Latino population 15 years and over
Males 33.7% Never married45.6% Now married1.7% Separated7.3% Widowed11.7% DivorcedFemales 21.4% Never married44.2% Now married0.8% Separated10.1% Widowed23.6% DivorcedWomen who gave birth in the past 12 months Now married:
48.1% (88)Unmarried:
51.9% (95)
Women who did not give birth in the past 12 months Now married:
46.3% (861)Unmarried:
53.7% (997)
Marital status - Hispanic or Latino population 15 years and over
Males 40.1% Never married33.8% Now married9.8% Separated3.0% Widowed13.3% DivorcedFemales 46.2% Never married31.3% Now married10.4% Separated3.8% Widowed8.4% DivorcedWomen who gave birth in the past 12 months Now married:
50.0% (14)Unmarried:
50.0% (14)
Women who did not give birth in the past 12 months Now married:
35.9% (439)Unmarried:
64.1% (785)
Ancestries in Mineral Wells
936 12.4% English921 12.2% American789 10.4% Irish292 3.9% German118 1.6% Scotch-Irish108 1.4% European40 0.5% Norwegian31 0.4% Italian28 0.4% Scottish18 0.2% Welsh10 0.1% African8 0.1% British8 0.1% Dutch7 0.09% French Canadian7 0.09% Northern European5 0.07% Austrian5 0.07% Dutch West Indian2 0.03% French2 0.03% Swedish1 0.01% Polish
Geographical mobility in Mineral Wells Same house 1 year ago 7,947 84.5% White (Caucasian)710 92.9% Black or African American33 11.2% American Indian / Alaska Native326 95.8% Asian1,164 97.4% Other race2,007 94.7% Two or more races7,760 85.5% White alone, not Hispanic / Latino3,677 85.2% Hispanic or LatinoMoved within same county 888 9.4% White / Caucasian12 1.5% Black or African American210 71.0% American Indian / Alaska Native30 2.5% Other race65 3.1% Two or more races798 8.8% White alone, not Hispanic / Latino513 11.9% Hispanic or LatinoMoved within same state 387 4.1% White / Caucasian3 0.4% Black or African American5 1.7% American Indian / Alaska Native13 3.8% Asian28 1.3% Two or more races363 4.0% White alone, not Hispanic / Latino65 1.5% Hispanic or LatinoMoved from different state 114 1.2% White / Caucasian54 7.1% Black or African American118 1.3% White alone, not Hispanic / LatinoMoved from abroad 15 0.2% White27 1.3% Two or more races6 0.1% White alone, not Hispanic / Latino36 0.8% Hispanic or Latino
Children Nativity (place of birth) in Mineral Wells
Children under 6 years - Living with two parents Both parents native 552 100.0% NativeBoth parents foreign-born 58 100.0% NativeOne native, one foreign-born parent 48 100.0% NativeChildren under 6 years - Living with one parent Native parent 530 100.0% NativeForeign-born parent 26 100.0% NativeChildren 6 to 17 years - Living with two parents Both parents native 1,300 100.0% NativeBoth parents foreign-born 157 100.0% NativeChildren 6 to 17 years - Living with one parent Native parent 650 100.0% NativeForeign-born parent 223 50.5% Native219 49.5% Foreign-born
Grandparents responsible for own grandchildren in Mineral Wells
Grandparents (30 to 59 years) White / Caucasian 20 69.8% Responsible for grandchildren9 30.2% Not responsible for grandchildrenOther race 32 42.7% Responsible for grandchildren43 57.3% Not responsible for grandchildrenTwo or more races 40 100.0% Not responsible for grandchildrenWhite alone, not Hispanic / Latino 27 65.9% Responsible for grandchildren14 34.1% Not responsible for grandchildrenHispanic or Latino 26 31.5% Responsible for grandchildren56 68.5% Not responsible for grandchildrenGrandparents (60 years and over) White / Caucasian 27 34.6% Responsible for grandchildren51 65.4% Not responsible for grandchildrenTwo or more races 7 100.0% Responsible for grandchildrenWhite alone, not Hispanic / Latino 20 37.2% Responsible for grandchildren34 62.8% Not responsible for grandchildrenHispanic or Latino 13 26.5% Responsible for grandchildren37 73.5% Not responsible for grandchildren