Races in Miami Beach, Florida (FL) Detailed Stats
Data:
Races - White alone (%)
Races - White alone (% change since 2000)
Races - Black alone (%)
Races - Black alone (% change since 2000)
Races - American Indian alone (%)
Races - American Indian alone (% change since 2000)
Races - Asian alone (%)
Races - Asian alone (% change since 2000)
Races - Hispanic (%)
Races - Hispanic (% change since 2000)
Races - Native Hawaiian and Other Pacific Islander alone (%)
Races - Native Hawaiian and Other Pacific Islander alone (% change since 2000)
Races - Two or more races(%)
Races - Two or more races(% change since 2000)
Races - Other race alone (%)
Races - Other race alone (% change since 2000)
Racial diversity
Place of birth - Born in state of residence (%)
Place of birth - Born in state of residence (%) - White
Place of birth - Born in state of residence (%) - Black or African American
Place of birth - Born in state of residence (%) - Asian
Place of birth - Born in state of residence (%) - Hispanic or Latino
Place of birth - Born in state of residence (%) - American Indian and Alaska Native
Place of birth - Born in state of residence (%) - Multirace
Place of birth - Born in state of residence (%) - Other Race
Place of birth - Born in other state (%)
Place of birth - Born in other state (%) - White
Place of birth - Born in other state (%) - Black or African American
Place of birth - Born in other state (%) - Asian
Place of birth - Born in other state (%) - Hispanic or Latino
Place of birth - Born in other state (%) - American Indian and Alaska Native
Place of birth - Born in other state (%) - Multirace
Place of birth - Born in other state (%) - Other Race
Place of birth - Native, outside of US (%)
Place of birth - Native, outside of US (%) - White
Place of birth - Native, outside of US (%) - Black or African American
Place of birth - Native, outside of US (%) - Asian
Place of birth - Native, outside of US (%) - Hispanic or Latino
Place of birth - Native, outside of US (%) - American Indian and Alaska Native
Place of birth - Native, outside of US (%) - Multirace
Place of birth - Native, outside of US (%) - Other Race
Place of birth - Foreign born (%)
Place of birth - Foreign born (%) - White
Place of birth - Foreign born (%) - Black or African American
Place of birth - Foreign born (%) - Asian
Place of birth - Foreign born (%) - Hispanic or Latino
Place of birth - Foreign born (%) - American Indian and Alaska Native
Place of birth - Foreign born (%) - Multirace
Place of birth - Foreign born (%) - Other Race
Residents speaking English at home (%)
Residents speaking English at home - Born in the United States (%)
Residents speaking English at home - Native, born elsewhere (%)
Residents speaking English at home - Foreign born (%)
Residents speaking Spanish at home (%)
Residents speaking Spanish at home - Born in the United States (%)
Residents speaking Spanish at home - Native, born elsewhere (%)
Residents speaking Spanish at home - Foreign born (%)
Residents speaking other language at home (%)
Residents speaking other language at home - Born in the United States (%)
Residents speaking other language at home - Native, born elsewhere (%)
Residents speaking other language at home - Foreign born (%)
Marital status - Never married (%)
Marital status - Now married (%)
Marital status - Separated (%)
Marital status - Widowed (%)
Marital status - Divorced (%)
Ancestries Reported - Arab (%)
Ancestries Reported - Czech (%)
Ancestries Reported - Danish (%)
Ancestries Reported - Dutch (%)
Ancestries Reported - English (%)
Ancestries Reported - French (%)
Ancestries Reported - French Canadian (%)
Ancestries Reported - German (%)
Ancestries Reported - Greek (%)
Ancestries Reported - Hungarian (%)
Ancestries Reported - Irish (%)
Ancestries Reported - Italian (%)
Ancestries Reported - Lithuanian (%)
Ancestries Reported - Norwegian (%)
Ancestries Reported - Polish (%)
Ancestries Reported - Portuguese (%)
Ancestries Reported - Russian (%)
Ancestries Reported - Scotch-Irish (%)
Ancestries Reported - Scottish (%)
Ancestries Reported - Slovak (%)
Ancestries Reported - Subsaharan African (%)
Ancestries Reported - Swedish (%)
Ancestries Reported - Swiss (%)
Ancestries Reported - Ukrainian (%)
Ancestries Reported - United States (%)
Ancestries Reported - Welsh (%)
Ancestries Reported - West Indian (%)
Ancestries Reported - Other (%)
Geographical mobility - Same house 1 year ago (%)
Geographical mobility - Same house 1 year ago (%) - White
Geographical mobility - Same house 1 year ago (%) - Black or African American
Geographical mobility - Same house 1 year ago (%) - Asian
Geographical mobility - Same house 1 year ago (%) - Hispanic or Latino
Geographical mobility - Same house 1 year ago (%) - American Indian and Alaska Native
Geographical mobility - Same house 1 year ago (%) - Multirace
Geographical mobility - Same house 1 year ago (%) - Other Race
Geographical mobility - Moved within same county (%)
Geographical mobility - Moved within same county (%) - White
Geographical mobility - Moved within same county (%) - Black or African American
Geographical mobility - Moved within same county (%) - Asian
Geographical mobility - Moved within same county (%) - Hispanic or Latino
Geographical mobility - Moved within same county (%) - American Indian and Alaska Native
Geographical mobility - Moved within same county (%) - Multirace
Geographical mobility - Moved within same county (%) - Other Race
Geographical mobility - Moved from different county within same state (%)
Geographical mobility - Moved from different county within same state (%) - White
Geographical mobility - Moved from different county within same state (%) - Black or African American
Geographical mobility - Moved from different county within same state (%) - Asian
Geographical mobility - Moved from different county within same state (%) - Hispanic or Latino
Geographical mobility - Moved from different county within same state (%) - American Indian and Alaska Native
Geographical mobility - Moved from different county within same state (%) - Multirace
Geographical mobility - Moved from different county within same state (%) - Other Race
Geographical mobility - Moved from different state (%)
Geographical mobility - Moved from different state (%) - White
Geographical mobility - Moved from different state (%) - Black or African American
Geographical mobility - Moved from different state (%) - Asian
Geographical mobility - Moved from different state (%) - Hispanic or Latino
Geographical mobility - Moved from different state (%) - American Indian and Alaska Native
Geographical mobility - Moved from different state (%) - Multirace
Geographical mobility - Moved from different state (%) - Other Race
Geographical mobility - Moved from abroad (%)
Geographical mobility - Moved from abroad (%) - White
Geographical mobility - Moved from abroad (%) - Black or African American
Geographical mobility - Moved from abroad (%) - Asian
Geographical mobility - Moved from abroad (%) - Hispanic or Latino
Geographical mobility - Moved from abroad (%) - American Indian and Alaska Native
Geographical mobility - Moved from abroad (%) - Multirace
Geographical mobility - Moved from abroad (%) - Other Race
Place of birth for the foreign-born population - Ireland (%)
Place of birth for the foreign-born population - Denmark (%)
Place of birth for the foreign-born population - Norway (%)
Place of birth for the foreign-born population - Sweden (%)
Place of birth for the foreign-born population - United Kingdom (%)
Place of birth for the foreign-born population - England (%)
Place of birth for the foreign-born population - Scotland (%)
Place of birth for the foreign-born population - Other Northern Europe (%)
Place of birth for the foreign-born population - Austria (%)
Place of birth for the foreign-born population - Belgium (%)
Place of birth for the foreign-born population - France (%)
Place of birth for the foreign-born population - Germany (%)
Place of birth for the foreign-born population - Netherlands (%)
Place of birth for the foreign-born population - Switzerland (%)
Place of birth for the foreign-born population - Other Western Europe (%)
Place of birth for the foreign-born population - Greece (%)
Place of birth for the foreign-born population - Italy (%)
Place of birth for the foreign-born population - Portugal (%)
Place of birth for the foreign-born population - Spain (%)
Place of birth for the foreign-born population - Other Southern Europe (%)
Place of birth for the foreign-born population - Albania (%)
Place of birth for the foreign-born population - Belarus (%)
Place of birth for the foreign-born population - Bosnia and Herzegovina (%)
Place of birth for the foreign-born population - Bulgaria (%)
Place of birth for the foreign-born population - Croatia (%)
Place of birth for the foreign-born population - Czechoslovakia (%)
Place of birth for the foreign-born population - Hungary (%)
Place of birth for the foreign-born population - Latvia (%)
Place of birth for the foreign-born population - Lithuania (%)
Place of birth for the foreign-born population - North Macedonia (Macedonia) (%)
Place of birth for the foreign-born population - Moldova (%)
Place of birth for the foreign-born population - Poland (%)
Place of birth for the foreign-born population - Romania (%)
Place of birth for the foreign-born population - Russia (%)
Place of birth for the foreign-born population - Serbia (%)
Place of birth for the foreign-born population - Ukraine (%)
Place of birth for the foreign-born population - Other Eastern Europe (%)
Place of birth for the foreign-born population - China (%)
Place of birth for the foreign-born population - Hong Kong (%)
Place of birth for the foreign-born population - Taiwan (%)
Place of birth for the foreign-born population - Japan (%)
Place of birth for the foreign-born population - Korea (%)
Place of birth for the foreign-born population - Other Eastern Asia (%)
Place of birth for the foreign-born population - Afghanistan (%)
Place of birth for the foreign-born population - Bangladesh (%)
Place of birth for the foreign-born population - India (%)
Place of birth for the foreign-born population - Iran (%)
Place of birth for the foreign-born population - Kazakhstan (%)
Place of birth for the foreign-born population - Nepal (%)
Place of birth for the foreign-born population - Pakistan (%)
Place of birth for the foreign-born population - Sri Lanka (%)
Place of birth for the foreign-born population - Uzbekistan (%)
Place of birth for the foreign-born population - Other South Central Asia (%)
Place of birth for the foreign-born population - Burma (%)
Place of birth for the foreign-born population - Cambodia (%)
Place of birth for the foreign-born population - Indonesia (%)
Place of birth for the foreign-born population - Laos (%)
Place of birth for the foreign-born population - Malaysia (%)
Place of birth for the foreign-born population - Philippines (%)
Place of birth for the foreign-born population - Singapore (%)
Place of birth for the foreign-born population - Thailand (%)
Place of birth for the foreign-born population - Vietnam (%)
Place of birth for the foreign-born population - Other South Eastern Asia (%)
Place of birth for the foreign-born population - Armenia (%)
Place of birth for the foreign-born population - Iraq (%)
Place of birth for the foreign-born population - Israel (%)
Place of birth for the foreign-born population - Jordan (%)
Place of birth for the foreign-born population - Kuwait (%)
Place of birth for the foreign-born population - Lebanon (%)
Place of birth for the foreign-born population - Saudi Arabia (%)
Place of birth for the foreign-born population - Syria (%)
Place of birth for the foreign-born population - Turkey (%)
Place of birth for the foreign-born population - Yemen (%)
Place of birth for the foreign-born population - Other Western Asia (%)
Place of birth for the foreign-born population - Eritrea (%)
Place of birth for the foreign-born population - Ethiopia (%)
Place of birth for the foreign-born population - Kenya (%)
Place of birth for the foreign-born population - Somalia (%)
Place of birth for the foreign-born population - Uganda (%)
Place of birth for the foreign-born population - Zimbabwe (%)
Place of birth for the foreign-born population - Other Eastern Africa (%)
Place of birth for the foreign-born population - Cameroon (%)
Place of birth for the foreign-born population - Congo (%)
Place of birth for the foreign-born population - Democratic Republic of Congo (Zaire) (%)
Place of birth for the foreign-born population - Other Middle Africa (%)
Place of birth for the foreign-born population - Egypt (%)
Place of birth for the foreign-born population - Morocco (%)
Place of birth for the foreign-born population - Sudan (%)
Place of birth for the foreign-born population - Other Northern Africa (%)
Place of birth for the foreign-born population - South Africa (%)
Place of birth for the foreign-born population - Other Southern Africa (%)
Place of birth for the foreign-born population - Cabo Verde (%)
Place of birth for the foreign-born population - Ghana (%)
Place of birth for the foreign-born population - Liberia (%)
Place of birth for the foreign-born population - Nigeria (%)
Place of birth for the foreign-born population - Senegal (%)
Place of birth for the foreign-born population - Sierra Leone (%)
Place of birth for the foreign-born population - Other Western Africa (%)
Place of birth for the foreign-born population - Australia (%)
Place of birth for the foreign-born population - New Zealand (%)
Place of birth for the foreign-born population - Fiji (%)
Place of birth for the foreign-born population - Micronesia (%)
Place of birth for the foreign-born population - Bahamas (%)
Place of birth for the foreign-born population - Barbados (%)
Place of birth for the foreign-born population - Cuba (%)
Place of birth for the foreign-born population - Dominica (%)
Place of birth for the foreign-born population - Dominican Republic (%)
Place of birth for the foreign-born population - Grenada (%)
Place of birth for the foreign-born population - Haiti (%)
Place of birth for the foreign-born population - Jamaica (%)
Place of birth for the foreign-born population - St. Vincent and the Grenadines (%)
Place of birth for the foreign-born population - Trinidad and Tobago (%)
Place of birth for the foreign-born population - West Indies (%)
Place of birth for the foreign-born population - Other Caribbean (%)
Place of birth for the foreign-born population - Belize (%)
Place of birth for the foreign-born population - Costa Rica (%)
Place of birth for the foreign-born population - El Salvador (%)
Place of birth for the foreign-born population - Guatemala (%)
Place of birth for the foreign-born population - Honduras (%)
Place of birth for the foreign-born population - Mexico (%)
Place of birth for the foreign-born population - Nicaragua (%)
Place of birth for the foreign-born population - Panama (%)
Place of birth for the foreign-born population - Other Central America (%)
Place of birth for the foreign-born population - Argentina (%)
Place of birth for the foreign-born population - Bolivia (%)
Place of birth for the foreign-born population - Brazil (%)
Place of birth for the foreign-born population - Chile (%)
Place of birth for the foreign-born population - Colombia (%)
Place of birth for the foreign-born population - Ecuador (%)
Place of birth for the foreign-born population - Guyana (%)
Place of birth for the foreign-born population - Peru (%)
Place of birth for the foreign-born population - Uruguay (%)
Place of birth for the foreign-born population - Venezuela (%)
Place of birth for the foreign-born population - Other South America (%)
Place of birth for the foreign-born population - Canada (%)
Place of birth for the foreign-born population - Other Northern America (%)
Place of birth for the foreign-born population - Other (%)
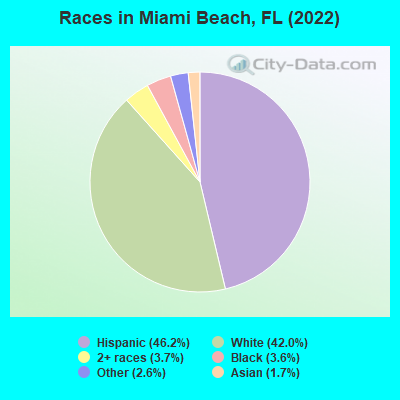
According to 2022 data, the most numerous races in Miami Beach, FL are White alone (33,603 residents), Hispanic (36,994 residents), and Black alone (2,905 residents). 40.2% of Miami Beach residents speak English at home. 55.4% of Miami Beach, FL residents are foreign-born (42.3% born in Latin America, 8.6% born in Europe), which is 62.1% greater than the foreign-born rate of 21.0% across the entire state of Florida.
Race distribution in Miami Beach
2000 2022
47,000 53.4% Hispanic 35,959 40.9% White alone 2,491 2.8% Black alone 1,148 1.3% Asian alone 1,009 1.1% Two or more races 227 0.3% Other race alone 72 0.08% American Indian alone 27 0.03% Native Hawaiian and Other
36,994 46.2% Hispanic 33,603 42.0% White alone 2,994 3.7% Two or more races 2,905 3.6% Black alone 2,096 2.6% Other race alone 1,365 1.7% Asian alone 70 0.09% Native Hawaiian and Other
2000 2022
10,458,509 65.4% White alone 2,682,715 16.8% Hispanic 2,264,268 14.2% Black alone 261,693 1.6% Asian alone 236,954 1.5% Two or more races 42,358 0.3% American Indian alone 28,994 0.2% Other race alone 6,887 0.04% Native Hawaiian and Other
11,309,403 50.8% White alone 6,025,039 27.1% Hispanic 3,241,015 14.6% Black alone 861,630 3.9% Two or more races 623,692 2.8% Asian alone 152,054 0.7% Other race alone 22,504 0.1% American Indian alone 9,486 0.04% Native Hawaiian and Other
Income and house value in Miami Beach Median household income in 2022 $100,958 White non-Hispanic householders$43,270 Black householders$89,386 Asian householders$53,395 Some other race householders$59,217 Two or more races householders$52,418 Hispanic or Latino race householdersMedian 2022 house value over $1,000,000 White Non-Hispanic householdersover $1,000,000 Black or African American householders$436,459 American Indian or Alaska Native householders over $1,000,000 Asian householders$802,572 Some other race householdersover $1,000,000 Two or more races householdersover $1,000,000 Hispanic or Latino householders
Median age by race in Miami Beach
41.3 Median age for White residents42.2 38.7 41.1 Median age for Black or African American residents41.1 31.9 48.4 Median age for American Indian / Alaska Native residents-666,666,666.0 -666,666,666.0 42.6 Median age for Asian residents60.3 36.6 -666,666,666.0 Median age for Native Hawaiian / Pacific Islander residents-666,666,666.0 -666,666,666.0 41.8 Median age for Other race residents40.8 48.6 45.4 Median age for Two or more races residents45.7 43.7 38.8 Median age for White alone residents41.5 37.4 45.1 Median age for Hispanic or Latino residents43.7 47.3
Owner/renter occupied households by race in Miami Beach
House owners and renters - White residents 10,974 44.1% Owner occupied13,886 55.9% Renter occupiedHouse owners and renters - Black or African American residents 151 7.7% Owner occupied1,807 92.3% Renter occupiedHouse owners and renters - American Indian / Alaska Native residents 17 49.5% Owner occupied17 50.5% Renter occupiedHouse owners and renters - Asian residents 253 39.3% Owner occupied391 60.7% Renter occupiedHouse owners and renters - Native Hawaiian / Pacific Islander residents 14 100.0% Renter occupiedHouse owners and renters - Other race residents 932 26.9% Owner occupied2,535 73.1% Renter occupiedHouse owners and renters - Two or more races residents 4,165 39.3% Owner occupied6,433 60.7% Renter occupiedHouse owners and renters - White alone residents 8,939 50.6% Owner occupied8,744 49.4% Renter occupiedHouse owners and renters - Hispanic or Latino residents 6,192 32.5% Owner occupied12,833 67.5% Renter occupied
Language usage in Miami Beach
English speakers - Total 40.2% of residents of Miami Beach speak English at home.
48.1% of residents speak Spanish at home 21,607 58.8% Speak English very well15,152 41.2% Speak English less than very well11.6% of residents speak other language at home 6,928 77.9% Speak English very well1,961 22.1% Speak English less than very well
English speakers - Born in the United States 77.9% of residents of Miami Beach speak English at home.
15.0% of residents speak Spanish at home 2,353 78.7% Speak English very well638 21.3% Speak English less than very well7.1% of residents speak other language at home 1,158 81.7% Speak English very well259 18.3% Speak English less than very well
English speakers - Native, born elsewhere 26.5% of residents of Miami Beach speak English at home.
61.0% of residents speak Spanish at home 1,205 84.9% Speak English very well214 15.1% Speak English less than very well12.5% of residents speak other language at home 292 100.0% Speak English very well
English speakers - Foreign-born 16.8% of residents of Miami Beach speak English at home.
66.9% of residents speak Spanish at home 11,747 45.6% Speak English very well14,001 54.4% Speak English less than very well16.3% of residents speak other language at home 4,586 72.9% Speak English very well1,702 27.1% Speak English less than very well
White (Caucasian) - Speak only English Native:
73.8% (19,497)Foreign-born:
25.7% (4,458)
White (Caucasian) - Speak another language Native:
26.2% (6,911)Foreign-born:
74.3% (12,860)
Black or African American - Speak only English Native:
85.8% (1,751)Foreign-born:
32.3% (408)
Black or African American - Speak another language Native:
14.2% (291)Foreign-born:
68.1% (859)
American Indian / Alaska Native - Speak another language Native:
11.4% (14)Foreign-born:
98.3% (44)
Asian - Speak only English Native:
59.2% (377)Foreign-born:
37.2% (444)
Asian - Speak another language Native:
40.9% (261)Foreign-born:
59.2% (706)
Other race - Speak only English Native:
16.7% (381)Foreign-born:
1.4% (72)
Other race - Speak another language Native:
83.3% (1,903)Foreign-born:
98.6% (5,261)
Two or more races - Speak only English Native:
42.2% (2,724)Foreign-born:
7.9% (1,117)
Two or more races - Speak another language Native:
57.8% (3,730)Foreign-born:
92.1% (12,983)
White alone - Speak only English Native:
83.4% (19,266)Foreign-born:
46.3% (3,738)
White alone - Speak another language Native:
16.6% (3,821)Foreign-born:
53.7% (4,340)
Hispanic or Latino - Speak only English Native:
22.0% (2,072)Foreign-born:
6.1% (1,616)
Hispanic or Latino - Speak another language Native:
78.0% (7,362)Foreign-born:
93.9% (25,042)
Foreign-born residents in Miami Beach 45,409 residents are foreign born (42.3% Latin America , 8.6% Europe ).
This city:
55.4%Florida:
21.1%
Marital status for residents in Miami Beach Marital status - White (Caucasian) population 15 years and over
Males 42.0% Never married37.5% Now married1.7% Separated2.1% Widowed16.7% DivorcedFemales 31.5% Never married42.5% Now married3.9% Separated7.5% Widowed14.6% DivorcedWomen who gave birth in the past 12 months Now married:
38.4% (336)Unmarried:
61.6% (540)
Women who did not give birth in the past 12 months Now married:
38.9% (3,281)Unmarried:
61.1% (5,158)
Marital status - Black or African American population 15 years and over
Males 53.1% Never married22.6% Now married8.9% Separated0.9% Widowed14.5% DivorcedFemales 36.3% Never married36.8% Now married9.1% Separated3.8% Widowed13.9% DivorcedWomen who gave birth in the past 12 months Now married:
13.3% (6)Unmarried:
86.7% (36)
Women who did not give birth in the past 12 months Now married:
46.9% (278)Unmarried:
53.1% (315)
Marital status - American Indian / Alaska Native population 15 years and over
Males 41.7% Never married58.3% Now married0.0% Separated0.0% Widowed0.0% DivorcedFemales 0.0% Never married37.6% Now married0.0% Separated0.0% Widowed62.4% DivorcedWomen who did not give birth in the past 12 months Now married:
100.0% (13)Unmarried:
0.0% (0)
Marital status - Asian population 15 years and over
Males 40.0% Never married48.0% Now married7.1% Separated0.0% Widowed4.9% DivorcedFemales 47.4% Never married41.9% Now married3.3% Separated0.0% Widowed7.4% DivorcedWomen who gave birth in the past 12 months Now married:
0.0% (0)Unmarried:
100.0% (4)
Women who did not give birth in the past 12 months Now married:
40.1% (260)Unmarried:
59.9% (388)
Marital status - Other race population 15 years and over
Males 47.3% Never married28.7% Now married1.5% Separated0.8% Widowed21.7% DivorcedFemales 42.2% Never married42.4% Now married2.4% Separated2.4% Widowed10.6% DivorcedWomen who gave birth in the past 12 months Now married:
100.0% (25)Unmarried:
0.0% (0)
Women who did not give birth in the past 12 months Now married:
39.2% (1,361)Unmarried:
60.8% (2,111)
Marital status - Two or more races population 15 years and over
Males 40.4% Never married35.4% Now married6.9% Separated5.0% Widowed12.3% DivorcedFemales 35.3% Never married36.7% Now married3.8% Separated7.4% Widowed16.7% DivorcedWomen who gave birth in the past 12 months Now married:
53.8% (78)Unmarried:
46.2% (67)
Women who did not give birth in the past 12 months Now married:
36.5% (2,306)Unmarried:
63.5% (4,008)
Marital status - White alone, not Hispanic / Latino population 15 years and over
Males 39.3% Never married44.0% Now married1.4% Separated1.5% Widowed13.9% DivorcedFemales 29.9% Never married49.3% Now married1.1% Separated8.0% Widowed11.7% DivorcedWomen who gave birth in the past 12 months Now married:
64.6% (336)Unmarried:
35.4% (184)
Women who did not give birth in the past 12 months Now married:
42.4% (2,585)Unmarried:
57.6% (3,512)
Marital status - Hispanic or Latino population 15 years and over
Males 44.6% Never married29.7% Now married4.7% Separated4.0% Widowed17.0% DivorcedFemales 32.2% Never married36.1% Now married5.9% Separated7.3% Widowed18.4% DivorcedWomen who gave birth in the past 12 months Now married:
15.8% (67)Unmarried:
84.2% (356)
Women who did not give birth in the past 12 months Now married:
35.6% (2,694)Unmarried:
64.4% (4,864)
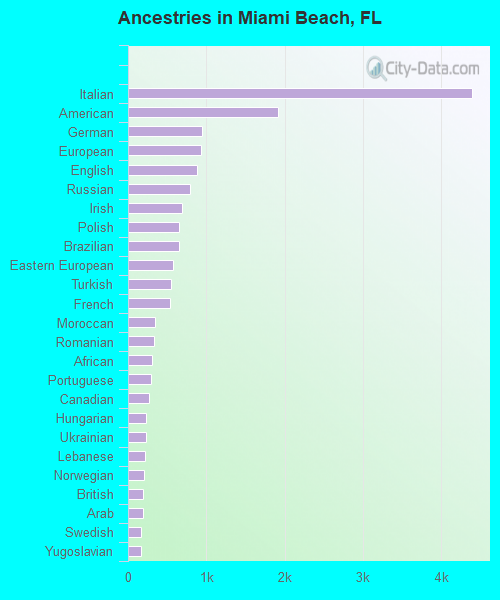
Ancestries in Miami Beach
4,390 9.3% Italian1,912 4.1% American944 2.0% German935 2.0% European881 1.9% English786 1.7% Russian684 1.5% Irish649 1.4% Polish647 1.4% Brazilian575 1.2% Eastern European545 1.2% Turkish537 1.1% French349 0.7% Moroccan333 0.7% Romanian307 0.7% African290 0.6% Portuguese262 0.6% Canadian235 0.5% Hungarian224 0.5% Ukrainian211 0.4% Lebanese202 0.4% Norwegian189 0.4% British189 0.4% Arab169 0.4% Swedish168 0.4% Yugoslavian160 0.3% Egyptian156 0.3% Danish154 0.3% Croatian141 0.3% Haitian138 0.3% Iranian131 0.3% Bulgarian130 0.3% Scottish129 0.3% Austrian120 0.3% Czech117 0.2% Israeli117 0.2% Jamaican116 0.2% French Canadian112 0.2% Kenyan78 0.2% Greek72 0.2% Finnish67 0.1% Swiss56 0.1% Slovak49 0.1% Serbian46 0.10% West Indian45 0.10% Scotch-Irish42 0.09% Basque41 0.09% Albanian41 0.09% Lithuanian40 0.09% Dutch33 0.07% Northern European28 0.06% Estonian25 0.05% Trinidadian and Tobagonian22 0.05% Welsh20 0.04% Ghanaian13 0.03% Syrian13 0.03% Czechoslovakian12 0.03% Macedonian12 0.03% Maltese12 0.03% Armenian9 0.02% Assyrian7 0.01% Australian5 0.01% Luxembourger4 0.01% U.S. Virgin Islander3 0.01% Belgian
Geographical mobility in Miami Beach Same house 1 year ago 36,486 79.7% White (Caucasian)2,199 65.8% Black or African American166 90.4% American Indian / Alaska Native1,418 74.6% Asian13 100.0% Native Hawaiian / Pacific Islander6,627 87.0% Other race18,123 85.9% Two or more races25,590 77.0% White alone, not Hispanic / Latino31,325 85.8% Hispanic or LatinoMoved within same county 5,054 11.0% White / Caucasian362 10.8% Black or African American18 9.7% American Indian / Alaska Native73 3.8% Asian553 7.3% Other race2,200 10.4% Two or more races3,767 11.3% White alone, not Hispanic / Latino3,859 10.6% Hispanic or LatinoMoved within same state 648 1.4% White / Caucasian16 0.5% Black or African American66 3.5% Asian83 0.4% Two or more races648 2.0% White alone, not Hispanic / Latino83 0.2% Hispanic or LatinoMoved from different state 3,094 6.8% White / Caucasian817 24.4% Black or African American201 10.6% Asian299 1.4% Two or more races2,788 8.4% White alone, not Hispanic / Latino605 1.7% Hispanic or LatinoMoved from abroad 509 1.1% White129 3.9% Black or African American213 11.2% Asian437 5.7% Other race399 1.9% Two or more races437 1.3% White alone, not Hispanic / Latino634 1.7% Hispanic or Latino
Children Nativity (place of birth) in Miami Beach
Children under 6 years - Living with two parents Both parents native 432 100.0% Native0 0.0% Foreign-bornBoth parents foreign-born 1,047 78.2% Native291 21.8% Foreign-bornOne native, one foreign-born parent 1,213 98.2% Native22 1.8% Foreign-bornChildren under 6 years - Living with one parent Native parent 444 98.9% Native5 1.1% Foreign-bornForeign-born parent 500 82.1% Native109 17.9% Foreign-bornChildren 6 to 17 years - Living with two parents Both parents native 1,212 98.1% Native24 1.9% Foreign-bornBoth parents foreign-born 1,440 60.6% Native934 39.4% Foreign-bornOne native, one foreign-born parent 886 96.6% Native31 3.4% Foreign-bornChildren 6 to 17 years - Living with one parent Native parent 279 100.0% NativeForeign-born parent 1,905 57.7% Native1,397 42.3% Foreign-born
Place of birth for residents in Miami Beach 35,352 Americas34,829 Latin America15,982 South America13,933 Caribbean7,044 Europe4,913 Central America2,493 Southern Europe2,370 Asia1,986 Eastern Europe1,780 Western Europe939 Western Asia784 Northern Europe581 South Central Asia522 Northern America506 South Eastern Asia497 Africa370 Northern Africa342 Eastern Asia172 China144 Oceania144 Australia and New Zealand Subregion42 Western Africa26 Middle Africa22 Southern Africa21 Eastern Africa12,732 Cuba3,749 Argentina3,736 Colombia2,875 Venezuela1,812 Brazil1,760 Honduras1,536 Italy1,362 Guatemala1,337 Peru1,043 France906 Spain843 Chile698 Russia679 Ecuador644 Dominican Republic643 Uruguay584 Nicaragua522 Canada513 Mexico441 Germany314 El Salvador305 United Kingdom282 Haiti269 Turkey261 Israel261 Romania251 Costa Rica251 Philippines220 India198 England178 Ukraine161 Morocco157 Thailand150 Iran146 Jamaica144 Australia143 Bolivia138 China137 Sweden134 Japan131 Croatia122 Switzerland114 Hungary104 Panama99 Austria95 United Arab Emirates94 Egypt93 Czechoslovakia89 Uzbekistan85 Bulgaria83 Azerbaijan69 Trinidad and Tobago59 Jordan59 Syria59 Poland52 Kazakhstan49 Vietnam45 Serbia45 Lithuania39 Lebanon39 Belarus36 Saudi Arabia36 Belgium36 Greece34 Sri Lanka34 Korea30 Netherlands30 Iraq30 Algeria26 Moldova24 Ireland24 Hong Kong22 South Africa19 Ghana19 Scotland19 Belize17 Guyana16 Bangladesh16 Democratic Republic of Congo (Zaire)16 Bahamas14 Norway13 Nigeria13 Laos13 Malaysia12 Portugal12 Kenya10 Indonesia9 Afghanistan8 North Macedonia (Macedonia)8 Liberia8 Latvia8 Bosnia and Herzegovina8 Taiwan5 Albania4 Pakistan1 Uganda
Grandparents responsible for own grandchildren in Miami Beach
Grandparents (30 to 59 years) White / Caucasian 52 100.0% Not responsible for grandchildrenBlack or African American 2 100.0% Not responsible for grandchildrenOther race 21 100.0% Not responsible for grandchildrenHispanic or Latino 93 100.0% Not responsible for grandchildrenGrandparents (60 years and over) White / Caucasian 9 13.1% Responsible for grandchildren57 86.9% Not responsible for grandchildrenOther race 49 100.0% Not responsible for grandchildrenHispanic or Latino 31 7.5% Responsible for grandchildren381 92.5% Not responsible for grandchildren