Races in Mentor, Ohio (OH) Detailed Stats
Data:
Races - White alone (%)
Races - White alone (% change since 2000)
Races - Black alone (%)
Races - Black alone (% change since 2000)
Races - American Indian alone (%)
Races - American Indian alone (% change since 2000)
Races - Asian alone (%)
Races - Asian alone (% change since 2000)
Races - Hispanic (%)
Races - Hispanic (% change since 2000)
Races - Native Hawaiian and Other Pacific Islander alone (%)
Races - Native Hawaiian and Other Pacific Islander alone (% change since 2000)
Races - Two or more races(%)
Races - Two or more races(% change since 2000)
Races - Other race alone (%)
Races - Other race alone (% change since 2000)
Racial diversity
Place of birth - Born in state of residence (%)
Place of birth - Born in state of residence (%) - White
Place of birth - Born in state of residence (%) - Black or African American
Place of birth - Born in state of residence (%) - Asian
Place of birth - Born in state of residence (%) - Hispanic or Latino
Place of birth - Born in state of residence (%) - American Indian and Alaska Native
Place of birth - Born in state of residence (%) - Multirace
Place of birth - Born in state of residence (%) - Other Race
Place of birth - Born in other state (%)
Place of birth - Born in other state (%) - White
Place of birth - Born in other state (%) - Black or African American
Place of birth - Born in other state (%) - Asian
Place of birth - Born in other state (%) - Hispanic or Latino
Place of birth - Born in other state (%) - American Indian and Alaska Native
Place of birth - Born in other state (%) - Multirace
Place of birth - Born in other state (%) - Other Race
Place of birth - Native, outside of US (%)
Place of birth - Native, outside of US (%) - White
Place of birth - Native, outside of US (%) - Black or African American
Place of birth - Native, outside of US (%) - Asian
Place of birth - Native, outside of US (%) - Hispanic or Latino
Place of birth - Native, outside of US (%) - American Indian and Alaska Native
Place of birth - Native, outside of US (%) - Multirace
Place of birth - Native, outside of US (%) - Other Race
Place of birth - Foreign born (%)
Place of birth - Foreign born (%) - White
Place of birth - Foreign born (%) - Black or African American
Place of birth - Foreign born (%) - Asian
Place of birth - Foreign born (%) - Hispanic or Latino
Place of birth - Foreign born (%) - American Indian and Alaska Native
Place of birth - Foreign born (%) - Multirace
Place of birth - Foreign born (%) - Other Race
Residents speaking English at home (%)
Residents speaking English at home - Born in the United States (%)
Residents speaking English at home - Native, born elsewhere (%)
Residents speaking English at home - Foreign born (%)
Residents speaking Spanish at home (%)
Residents speaking Spanish at home - Born in the United States (%)
Residents speaking Spanish at home - Native, born elsewhere (%)
Residents speaking Spanish at home - Foreign born (%)
Residents speaking other language at home (%)
Residents speaking other language at home - Born in the United States (%)
Residents speaking other language at home - Native, born elsewhere (%)
Residents speaking other language at home - Foreign born (%)
Marital status - Never married (%)
Marital status - Now married (%)
Marital status - Separated (%)
Marital status - Widowed (%)
Marital status - Divorced (%)
Ancestries Reported - Arab (%)
Ancestries Reported - Czech (%)
Ancestries Reported - Danish (%)
Ancestries Reported - Dutch (%)
Ancestries Reported - English (%)
Ancestries Reported - French (%)
Ancestries Reported - French Canadian (%)
Ancestries Reported - German (%)
Ancestries Reported - Greek (%)
Ancestries Reported - Hungarian (%)
Ancestries Reported - Irish (%)
Ancestries Reported - Italian (%)
Ancestries Reported - Lithuanian (%)
Ancestries Reported - Norwegian (%)
Ancestries Reported - Polish (%)
Ancestries Reported - Portuguese (%)
Ancestries Reported - Russian (%)
Ancestries Reported - Scotch-Irish (%)
Ancestries Reported - Scottish (%)
Ancestries Reported - Slovak (%)
Ancestries Reported - Subsaharan African (%)
Ancestries Reported - Swedish (%)
Ancestries Reported - Swiss (%)
Ancestries Reported - Ukrainian (%)
Ancestries Reported - United States (%)
Ancestries Reported - Welsh (%)
Ancestries Reported - West Indian (%)
Ancestries Reported - Other (%)
Geographical mobility - Same house 1 year ago (%)
Geographical mobility - Same house 1 year ago (%) - White
Geographical mobility - Same house 1 year ago (%) - Black or African American
Geographical mobility - Same house 1 year ago (%) - Asian
Geographical mobility - Same house 1 year ago (%) - Hispanic or Latino
Geographical mobility - Same house 1 year ago (%) - American Indian and Alaska Native
Geographical mobility - Same house 1 year ago (%) - Multirace
Geographical mobility - Same house 1 year ago (%) - Other Race
Geographical mobility - Moved within same county (%)
Geographical mobility - Moved within same county (%) - White
Geographical mobility - Moved within same county (%) - Black or African American
Geographical mobility - Moved within same county (%) - Asian
Geographical mobility - Moved within same county (%) - Hispanic or Latino
Geographical mobility - Moved within same county (%) - American Indian and Alaska Native
Geographical mobility - Moved within same county (%) - Multirace
Geographical mobility - Moved within same county (%) - Other Race
Geographical mobility - Moved from different county within same state (%)
Geographical mobility - Moved from different county within same state (%) - White
Geographical mobility - Moved from different county within same state (%) - Black or African American
Geographical mobility - Moved from different county within same state (%) - Asian
Geographical mobility - Moved from different county within same state (%) - Hispanic or Latino
Geographical mobility - Moved from different county within same state (%) - American Indian and Alaska Native
Geographical mobility - Moved from different county within same state (%) - Multirace
Geographical mobility - Moved from different county within same state (%) - Other Race
Geographical mobility - Moved from different state (%)
Geographical mobility - Moved from different state (%) - White
Geographical mobility - Moved from different state (%) - Black or African American
Geographical mobility - Moved from different state (%) - Asian
Geographical mobility - Moved from different state (%) - Hispanic or Latino
Geographical mobility - Moved from different state (%) - American Indian and Alaska Native
Geographical mobility - Moved from different state (%) - Multirace
Geographical mobility - Moved from different state (%) - Other Race
Geographical mobility - Moved from abroad (%)
Geographical mobility - Moved from abroad (%) - White
Geographical mobility - Moved from abroad (%) - Black or African American
Geographical mobility - Moved from abroad (%) - Asian
Geographical mobility - Moved from abroad (%) - Hispanic or Latino
Geographical mobility - Moved from abroad (%) - American Indian and Alaska Native
Geographical mobility - Moved from abroad (%) - Multirace
Geographical mobility - Moved from abroad (%) - Other Race
Place of birth for the foreign-born population - Ireland (%)
Place of birth for the foreign-born population - Denmark (%)
Place of birth for the foreign-born population - Norway (%)
Place of birth for the foreign-born population - Sweden (%)
Place of birth for the foreign-born population - United Kingdom (%)
Place of birth for the foreign-born population - England (%)
Place of birth for the foreign-born population - Scotland (%)
Place of birth for the foreign-born population - Other Northern Europe (%)
Place of birth for the foreign-born population - Austria (%)
Place of birth for the foreign-born population - Belgium (%)
Place of birth for the foreign-born population - France (%)
Place of birth for the foreign-born population - Germany (%)
Place of birth for the foreign-born population - Netherlands (%)
Place of birth for the foreign-born population - Switzerland (%)
Place of birth for the foreign-born population - Other Western Europe (%)
Place of birth for the foreign-born population - Greece (%)
Place of birth for the foreign-born population - Italy (%)
Place of birth for the foreign-born population - Portugal (%)
Place of birth for the foreign-born population - Spain (%)
Place of birth for the foreign-born population - Other Southern Europe (%)
Place of birth for the foreign-born population - Albania (%)
Place of birth for the foreign-born population - Belarus (%)
Place of birth for the foreign-born population - Bosnia and Herzegovina (%)
Place of birth for the foreign-born population - Bulgaria (%)
Place of birth for the foreign-born population - Croatia (%)
Place of birth for the foreign-born population - Czechoslovakia (%)
Place of birth for the foreign-born population - Hungary (%)
Place of birth for the foreign-born population - Latvia (%)
Place of birth for the foreign-born population - Lithuania (%)
Place of birth for the foreign-born population - North Macedonia (Macedonia) (%)
Place of birth for the foreign-born population - Moldova (%)
Place of birth for the foreign-born population - Poland (%)
Place of birth for the foreign-born population - Romania (%)
Place of birth for the foreign-born population - Russia (%)
Place of birth for the foreign-born population - Serbia (%)
Place of birth for the foreign-born population - Ukraine (%)
Place of birth for the foreign-born population - Other Eastern Europe (%)
Place of birth for the foreign-born population - China (%)
Place of birth for the foreign-born population - Hong Kong (%)
Place of birth for the foreign-born population - Taiwan (%)
Place of birth for the foreign-born population - Japan (%)
Place of birth for the foreign-born population - Korea (%)
Place of birth for the foreign-born population - Other Eastern Asia (%)
Place of birth for the foreign-born population - Afghanistan (%)
Place of birth for the foreign-born population - Bangladesh (%)
Place of birth for the foreign-born population - India (%)
Place of birth for the foreign-born population - Iran (%)
Place of birth for the foreign-born population - Kazakhstan (%)
Place of birth for the foreign-born population - Nepal (%)
Place of birth for the foreign-born population - Pakistan (%)
Place of birth for the foreign-born population - Sri Lanka (%)
Place of birth for the foreign-born population - Uzbekistan (%)
Place of birth for the foreign-born population - Other South Central Asia (%)
Place of birth for the foreign-born population - Burma (%)
Place of birth for the foreign-born population - Cambodia (%)
Place of birth for the foreign-born population - Indonesia (%)
Place of birth for the foreign-born population - Laos (%)
Place of birth for the foreign-born population - Malaysia (%)
Place of birth for the foreign-born population - Philippines (%)
Place of birth for the foreign-born population - Singapore (%)
Place of birth for the foreign-born population - Thailand (%)
Place of birth for the foreign-born population - Vietnam (%)
Place of birth for the foreign-born population - Other South Eastern Asia (%)
Place of birth for the foreign-born population - Armenia (%)
Place of birth for the foreign-born population - Iraq (%)
Place of birth for the foreign-born population - Israel (%)
Place of birth for the foreign-born population - Jordan (%)
Place of birth for the foreign-born population - Kuwait (%)
Place of birth for the foreign-born population - Lebanon (%)
Place of birth for the foreign-born population - Saudi Arabia (%)
Place of birth for the foreign-born population - Syria (%)
Place of birth for the foreign-born population - Turkey (%)
Place of birth for the foreign-born population - Yemen (%)
Place of birth for the foreign-born population - Other Western Asia (%)
Place of birth for the foreign-born population - Eritrea (%)
Place of birth for the foreign-born population - Ethiopia (%)
Place of birth for the foreign-born population - Kenya (%)
Place of birth for the foreign-born population - Somalia (%)
Place of birth for the foreign-born population - Uganda (%)
Place of birth for the foreign-born population - Zimbabwe (%)
Place of birth for the foreign-born population - Other Eastern Africa (%)
Place of birth for the foreign-born population - Cameroon (%)
Place of birth for the foreign-born population - Congo (%)
Place of birth for the foreign-born population - Democratic Republic of Congo (Zaire) (%)
Place of birth for the foreign-born population - Other Middle Africa (%)
Place of birth for the foreign-born population - Egypt (%)
Place of birth for the foreign-born population - Morocco (%)
Place of birth for the foreign-born population - Sudan (%)
Place of birth for the foreign-born population - Other Northern Africa (%)
Place of birth for the foreign-born population - South Africa (%)
Place of birth for the foreign-born population - Other Southern Africa (%)
Place of birth for the foreign-born population - Cabo Verde (%)
Place of birth for the foreign-born population - Ghana (%)
Place of birth for the foreign-born population - Liberia (%)
Place of birth for the foreign-born population - Nigeria (%)
Place of birth for the foreign-born population - Senegal (%)
Place of birth for the foreign-born population - Sierra Leone (%)
Place of birth for the foreign-born population - Other Western Africa (%)
Place of birth for the foreign-born population - Australia (%)
Place of birth for the foreign-born population - New Zealand (%)
Place of birth for the foreign-born population - Fiji (%)
Place of birth for the foreign-born population - Micronesia (%)
Place of birth for the foreign-born population - Bahamas (%)
Place of birth for the foreign-born population - Barbados (%)
Place of birth for the foreign-born population - Cuba (%)
Place of birth for the foreign-born population - Dominica (%)
Place of birth for the foreign-born population - Dominican Republic (%)
Place of birth for the foreign-born population - Grenada (%)
Place of birth for the foreign-born population - Haiti (%)
Place of birth for the foreign-born population - Jamaica (%)
Place of birth for the foreign-born population - St. Vincent and the Grenadines (%)
Place of birth for the foreign-born population - Trinidad and Tobago (%)
Place of birth for the foreign-born population - West Indies (%)
Place of birth for the foreign-born population - Other Caribbean (%)
Place of birth for the foreign-born population - Belize (%)
Place of birth for the foreign-born population - Costa Rica (%)
Place of birth for the foreign-born population - El Salvador (%)
Place of birth for the foreign-born population - Guatemala (%)
Place of birth for the foreign-born population - Honduras (%)
Place of birth for the foreign-born population - Mexico (%)
Place of birth for the foreign-born population - Nicaragua (%)
Place of birth for the foreign-born population - Panama (%)
Place of birth for the foreign-born population - Other Central America (%)
Place of birth for the foreign-born population - Argentina (%)
Place of birth for the foreign-born population - Bolivia (%)
Place of birth for the foreign-born population - Brazil (%)
Place of birth for the foreign-born population - Chile (%)
Place of birth for the foreign-born population - Colombia (%)
Place of birth for the foreign-born population - Ecuador (%)
Place of birth for the foreign-born population - Guyana (%)
Place of birth for the foreign-born population - Peru (%)
Place of birth for the foreign-born population - Uruguay (%)
Place of birth for the foreign-born population - Venezuela (%)
Place of birth for the foreign-born population - Other South America (%)
Place of birth for the foreign-born population - Canada (%)
Place of birth for the foreign-born population - Other Northern America (%)
Place of birth for the foreign-born population - Other (%)
Latest news about races in Mentor, OH collected exclusively by city-data.com from local newspapers, TV, and radio stations
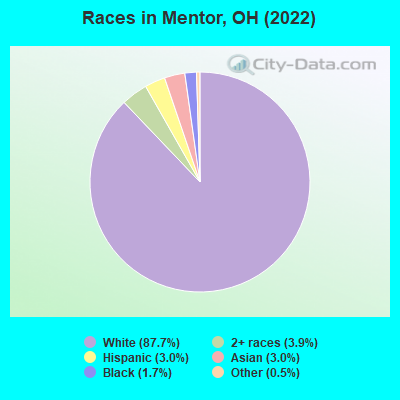
According to 2022 data, the most numerous races in Mentor, OH are White alone (41,431 residents), Black alone (781 residents), and Two or more races (1,842 residents). 92.3% of Mentor residents speak English at home. 6.4% of Mentor, OH residents are foreign-born (2.8% born in Europe, 2.3% born in Asia, 1.0% born in Latin America), which is 37.7% greater than the foreign-born rate of 4.0% across the entire state of Ohio.
Race distribution in Mentor
2000 2022
9,538,111 84.0% White alone 1,290,662 11.4% Black alone 217,123 1.9% Hispanic 137,770 1.2% Two or more races 131,670 1.2% Asian alone 21,985 0.2% American Indian alone 13,483 0.1% Other race alone 2,336 0.02% Native Hawaiian and Other
8,948,793 76.1% White alone 1,401,403 11.9% Black alone 529,291 4.5% Two or more races 517,232 4.4% Hispanic 293,387 2.5% Asian alone 52,805 0.4% Other race alone 9,785 0.08% American Indian alone 3,362 0.03% Native Hawaiian and Other
Income and house value in Mentor Median household income in 2022 $83,593 White non-Hispanic householders$90,709 Black householders$78,265 Asian householders$97,935 Two or more races householders$105,920 Hispanic or Latino race householdersMedian 2022 house value $241,982 White Non-Hispanic householders$259,102 Black or African American householders$123,460 American Indian or Alaska Native householders $338,611 Asian householders$390,958 Some other race householders$262,395 Two or more races householders$205,767 Hispanic or Latino householders
Median age by race in Mentor
48.2 Median age for White residents46.6 50.3 41.8 Median age for Black or African American residents44.7 26.6 -676,818,950.3 Median age for American Indian / Alaska Native residents-685,185,184.5 -658,163,264.6 40.2 Median age for Asian residents38.5 40.3 38.8 Median age for Native Hawaiian / Pacific Islander residents-750,242,953.6 -805,394,989.6 16.0 Median age for Other race residents10.5 34.9 32.3 Median age for Two or more races residents30.9 42.7 48.3 Median age for White alone residents46.5 50.9 18.4 Median age for Hispanic or Latino residents17.6 17.7
Owner/renter occupied households by race in Mentor
House owners and renters - White residents 16,180 87.0% Owner occupied2,415 13.0% Renter occupiedHouse owners and renters - Black or African American residents 131 49.4% Owner occupied134 50.6% Renter occupiedHouse owners and renters - American Indian / Alaska Native residents 12 100.0% Owner occupiedHouse owners and renters - Asian residents 263 69.5% Owner occupied116 30.5% Renter occupiedHouse owners and renters - Native Hawaiian / Pacific Islander residents 5 100.0% Renter occupiedHouse owners and renters - Other race residents 40 53.3% Owner occupied35 46.7% Renter occupiedHouse owners and renters - Two or more races residents 834 94.9% Owner occupied45 5.1% Renter occupiedHouse owners and renters - White alone residents 16,201 86.9% Owner occupied2,435 13.1% Renter occupiedHouse owners and renters - Hispanic or Latino residents 172 80.5% Owner occupied42 19.5% Renter occupied
Language usage in Mentor
English speakers - Total 92.3% of residents of Mentor speak English at home.
1.7% of residents speak Spanish at home 648 84.2% Speak English very well122 15.8% Speak English less than very well5.8% of residents speak other language at home 1,448 55.6% Speak English very well1,157 44.4% Speak English less than very well
English speakers - Born in the United States 96.8% of residents of Mentor speak English at home.
1.2% of residents speak Spanish at home 100 100.0% Speak English very well2.0% of residents speak other language at home 153 93.9% Speak English very well10 6.1% Speak English less than very well
English speakers - Native, born elsewhere 68.0% of residents of Mentor speak English at home.
39.1% of residents speak Spanish at home 126 100.0% Speak English very well2.2% of residents speak other language at home 7 100.0% Speak English very well
English speakers - Foreign-born 21.2% of residents of Mentor speak English at home.
7.6% of residents speak Spanish at home 124 68.5% Speak English very well57 31.5% Speak English less than very well72.8% of residents speak other language at home 704 40.7% Speak English very well1,025 59.3% Speak English less than very well
White (Caucasian) - Speak only English Native:
98.5% (38,159)Foreign-born:
36.8% (319)
White (Caucasian) - Speak another language Native:
1.5% (594)Foreign-born:
64.9% (562)
Black or African American - Speak only English Native:
92.7% (693)Foreign-born:
61.5% (43)
Black or African American - Speak another language Native:
7.6% (57)Foreign-born:
41.9% (29)
Asian - Speak only English Native:
92.2% (224)Foreign-born:
6.9% (72)
Asian - Speak another language Native:
63.6% (154)Foreign-born:
94.0% (978)
Other race - Speak only English Native:
52.1% (191)Foreign-born:
44.0% (25)
Other race - Speak another language Native:
41.3% (152)Foreign-born:
63.2% (36)
Two or more races - Speak another language Native:
18.2% (390)Foreign-born:
90.5% (470)
White alone - Speak only English Native:
98.2% (37,835)Foreign-born:
31.3% (306)
White alone - Speak another language Native:
1.7% (654)Foreign-born:
68.6% (670)
Hispanic or Latino - Speak only English Native:
56.8% (677)Foreign-born:
28.8% (50)
Hispanic or Latino - Speak another language Native:
36.4% (433)Foreign-born:
79.9% (137)
Foreign-born residents in Mentor 3,031 residents are foreign born (2.8% Europe , 2.3% Asia , 1.0% Latin America ).
Marital status for residents in Mentor Marital status - White (Caucasian) population 15 years and over
Males 31.4% Never married56.3% Now married0.5% Separated2.8% Widowed9.1% DivorcedFemales 21.3% Never married54.4% Now married0.7% Separated10.5% Widowed13.0% DivorcedWomen who gave birth in the past 12 months Now married:
82.8% (296)Unmarried:
17.2% (61)
Women who did not give birth in the past 12 months Now married:
49.2% (3,459)Unmarried:
50.8% (3,578)
Marital status - Black or African American population 15 years and over
Males 25.9% Never married54.9% Now married0.0% Separated0.0% Widowed19.2% DivorcedFemales 51.1% Never married27.6% Now married5.2% Separated1.7% Widowed14.5% DivorcedWomen who did not give birth in the past 12 months Now married:
27.5% (96)Unmarried:
72.5% (253)
Marital status - American Indian / Alaska Native population 15 years and over
Males 0.0% Never married100.0% Now married0.0% Separated0.0% Widowed0.0% DivorcedFemales 100.0% Never married0.0% Now married0.0% Separated0.0% Widowed0.0% DivorcedWomen who did not give birth in the past 12 months Now married:
0.0% (0)Unmarried:
100.0% (4)
Marital status - Asian population 15 years and over
Males 23.5% Never married60.8% Now married0.0% Separated0.0% Widowed15.8% DivorcedFemales 26.3% Never married66.9% Now married0.0% Separated4.5% Widowed2.3% DivorcedWomen who gave birth in the past 12 months Now married:
100.0% (65)Unmarried:
0.0% (0)
Women who did not give birth in the past 12 months Now married:
51.8% (173)Unmarried:
48.2% (162)
Marital status - Native Hawaiian / Pacific Islander population 15 years and over
Males 0.0% Never married100.0% Now married0.0% Separated0.0% Widowed0.0% DivorcedFemales 0.0% Never married100.0% Now married0.0% Separated0.0% Widowed0.0% DivorcedWomen who did not give birth in the past 12 months Now married:
100.0% (4)Unmarried:
0.0% (0)
Marital status - Other race population 15 years and over
Males 53.6% Never married46.4% Now married0.0% Separated0.0% Widowed0.0% DivorcedFemales 51.0% Never married32.7% Now married16.3% Separated0.0% Widowed0.0% DivorcedWomen who did not give birth in the past 12 months Now married:
0.0% (0)Unmarried:
100.0% (33)
Marital status - Two or more races population 15 years and over
Males 27.9% Never married71.3% Now married0.0% Separated0.0% Widowed0.8% DivorcedFemales 42.0% Never married49.8% Now married2.5% Separated1.9% Widowed3.9% DivorcedWomen who did not give birth in the past 12 months Now married:
44.3% (323)Unmarried:
55.7% (406)
Marital status - White alone, not Hispanic / Latino population 15 years and over
Males 31.0% Never married56.5% Now married0.5% Separated2.8% Widowed9.2% DivorcedFemales 21.3% Never married54.3% Now married0.8% Separated10.6% Widowed13.1% DivorcedWomen who gave birth in the past 12 months Now married:
82.8% (301)Unmarried:
17.2% (62)
Women who did not give birth in the past 12 months Now married:
48.9% (3,454)Unmarried:
51.1% (3,603)
Marital status - Hispanic or Latino population 15 years and over
Males 43.6% Never married56.4% Now married0.0% Separated0.0% Widowed0.0% DivorcedFemales 24.6% Never married68.5% Now married6.9% Separated0.0% Widowed0.0% DivorcedWomen who did not give birth in the past 12 months Now married:
67.9% (229)Unmarried:
32.1% (108)
Ancestries in Mentor
2,125 11.4% German2,014 10.8% Irish2,005 10.8% Italian1,314 7.1% English1,300 7.0% American977 5.2% Polish890 4.8% European810 4.3% Croatian733 3.9% Slovene465 2.5% Hungarian425 2.3% Slovak392 2.1% Ukrainian277 1.5% Portuguese271 1.5% Scottish208 1.1% Albanian180 1.0% Scotch-Irish120 0.6% Greek116 0.6% French103 0.6% Finnish82 0.4% Swedish63 0.3% Russian62 0.3% Czech56 0.3% Austrian55 0.3% Lithuanian53 0.3% French Canadian53 0.3% Eastern European51 0.3% Iranian51 0.3% Yugoslavian40 0.2% Dutch37 0.2% British28 0.2% Scandinavian28 0.2% Serbian25 0.1% Czechoslovakian25 0.1% Swiss24 0.1% African22 0.1% Bulgarian20 0.1% Pennsylvania German18 0.10% Lebanese18 0.10% Welsh16 0.09% Armenian12 0.06% Slavic11 0.06% Romanian10 0.05% Norwegian8 0.04% Danish7 0.04% Macedonian6 0.03% Canadian4 0.02% Latvian3 0.02% Jordanian3 0.02% Palestinian3 0.02% South African
Geographical mobility in Mentor Same house 1 year ago 38,059 92.4% White (Caucasian)723 88.7% Black or African American14 100.0% American Indian / Alaska Native1,207 86.2% Asian19 82.7% Native Hawaiian / Pacific Islander370 87.4% Other race2,771 92.9% Two or more races37,953 92.3% White alone, not Hispanic / Latino1,382 98.1% Hispanic or LatinoMoved within same county 2,160 5.2% White / Caucasian17 2.1% Black or African American50 3.6% Asian3 0.8% Other race161 5.4% Two or more races2,179 5.3% White alone, not Hispanic / Latino32 2.3% Hispanic or LatinoMoved within same state 643 1.6% White / Caucasian90 11.0% Black or African American163 11.6% Asian4 19.1% Native Hawaiian / Pacific Islander59 13.9% Other race59 2.0% Two or more races640 1.6% White alone, not Hispanic / Latino26 1.9% Hispanic or LatinoMoved from different state 204 0.5% White / Caucasian11 0.8% Asian211 0.5% White alone, not Hispanic / LatinoMoved from abroad 22 0.1% White22 0.1% White alone, not Hispanic / Latino
Children Nativity (place of birth) in Mentor
Children under 6 years - Living with two parents Both parents native 1,892 100.0% NativeBoth parents foreign-born 236 100.0% NativeOne native, one foreign-born parent 409 100.0% NativeChildren under 6 years - Living with one parent Native parent 315 100.0% NativeChildren 6 to 17 years - Living with two parents Both parents native 4,197 99.9% Native5 0.1% Foreign-bornBoth parents foreign-born 220 82.4% Native47 17.6% Foreign-bornOne native, one foreign-born parent 232 95.1% Native12 4.9% Foreign-bornChildren 6 to 17 years - Living with one parent Native parent 1,044 100.0% NativeForeign-born parent 213 76.2% Native66 23.8% Foreign-born
Grandparents responsible for own grandchildren in Mentor
Grandparents (30 to 59 years) White / Caucasian 30 19.0% Responsible for grandchildren126 81.0% Not responsible for grandchildrenBlack or African American 6 100.0% Not responsible for grandchildrenAsian 26 100.0% Not responsible for grandchildrenWhite alone, not Hispanic / Latino 29 18.7% Responsible for grandchildren128 81.3% Not responsible for grandchildrenGrandparents (60 years and over) White / Caucasian 70 34.6% Responsible for grandchildren133 65.4% Not responsible for grandchildrenAsian 42 100.0% Not responsible for grandchildrenWhite alone, not Hispanic / Latino 70 34.4% Responsible for grandchildren134 65.6% Not responsible for grandchildren