Races in Melissa, Texas (TX) Detailed Stats
Data:
Races - White alone (%)
Races - White alone (% change since 2000)
Races - Black alone (%)
Races - Black alone (% change since 2000)
Races - American Indian alone (%)
Races - American Indian alone (% change since 2000)
Races - Asian alone (%)
Races - Asian alone (% change since 2000)
Races - Hispanic (%)
Races - Hispanic (% change since 2000)
Races - Native Hawaiian and Other Pacific Islander alone (%)
Races - Native Hawaiian and Other Pacific Islander alone (% change since 2000)
Races - Two or more races(%)
Races - Two or more races(% change since 2000)
Races - Other race alone (%)
Races - Other race alone (% change since 2000)
Racial diversity
Place of birth - Born in state of residence (%)
Place of birth - Born in state of residence (%) - White
Place of birth - Born in state of residence (%) - Black or African American
Place of birth - Born in state of residence (%) - Asian
Place of birth - Born in state of residence (%) - Hispanic or Latino
Place of birth - Born in state of residence (%) - American Indian and Alaska Native
Place of birth - Born in state of residence (%) - Multirace
Place of birth - Born in state of residence (%) - Other Race
Place of birth - Born in other state (%)
Place of birth - Born in other state (%) - White
Place of birth - Born in other state (%) - Black or African American
Place of birth - Born in other state (%) - Asian
Place of birth - Born in other state (%) - Hispanic or Latino
Place of birth - Born in other state (%) - American Indian and Alaska Native
Place of birth - Born in other state (%) - Multirace
Place of birth - Born in other state (%) - Other Race
Place of birth - Native, outside of US (%)
Place of birth - Native, outside of US (%) - White
Place of birth - Native, outside of US (%) - Black or African American
Place of birth - Native, outside of US (%) - Asian
Place of birth - Native, outside of US (%) - Hispanic or Latino
Place of birth - Native, outside of US (%) - American Indian and Alaska Native
Place of birth - Native, outside of US (%) - Multirace
Place of birth - Native, outside of US (%) - Other Race
Place of birth - Foreign born (%)
Place of birth - Foreign born (%) - White
Place of birth - Foreign born (%) - Black or African American
Place of birth - Foreign born (%) - Asian
Place of birth - Foreign born (%) - Hispanic or Latino
Place of birth - Foreign born (%) - American Indian and Alaska Native
Place of birth - Foreign born (%) - Multirace
Place of birth - Foreign born (%) - Other Race
Residents speaking English at home (%)
Residents speaking English at home - Born in the United States (%)
Residents speaking English at home - Native, born elsewhere (%)
Residents speaking English at home - Foreign born (%)
Residents speaking Spanish at home (%)
Residents speaking Spanish at home - Born in the United States (%)
Residents speaking Spanish at home - Native, born elsewhere (%)
Residents speaking Spanish at home - Foreign born (%)
Residents speaking other language at home (%)
Residents speaking other language at home - Born in the United States (%)
Residents speaking other language at home - Native, born elsewhere (%)
Residents speaking other language at home - Foreign born (%)
Marital status - Never married (%)
Marital status - Now married (%)
Marital status - Separated (%)
Marital status - Widowed (%)
Marital status - Divorced (%)
Ancestries Reported - Arab (%)
Ancestries Reported - Czech (%)
Ancestries Reported - Danish (%)
Ancestries Reported - Dutch (%)
Ancestries Reported - English (%)
Ancestries Reported - French (%)
Ancestries Reported - French Canadian (%)
Ancestries Reported - German (%)
Ancestries Reported - Greek (%)
Ancestries Reported - Hungarian (%)
Ancestries Reported - Irish (%)
Ancestries Reported - Italian (%)
Ancestries Reported - Lithuanian (%)
Ancestries Reported - Norwegian (%)
Ancestries Reported - Polish (%)
Ancestries Reported - Portuguese (%)
Ancestries Reported - Russian (%)
Ancestries Reported - Scotch-Irish (%)
Ancestries Reported - Scottish (%)
Ancestries Reported - Slovak (%)
Ancestries Reported - Subsaharan African (%)
Ancestries Reported - Swedish (%)
Ancestries Reported - Swiss (%)
Ancestries Reported - Ukrainian (%)
Ancestries Reported - United States (%)
Ancestries Reported - Welsh (%)
Ancestries Reported - West Indian (%)
Ancestries Reported - Other (%)
Geographical mobility - Same house 1 year ago (%)
Geographical mobility - Same house 1 year ago (%) - White
Geographical mobility - Same house 1 year ago (%) - Black or African American
Geographical mobility - Same house 1 year ago (%) - Asian
Geographical mobility - Same house 1 year ago (%) - Hispanic or Latino
Geographical mobility - Same house 1 year ago (%) - American Indian and Alaska Native
Geographical mobility - Same house 1 year ago (%) - Multirace
Geographical mobility - Same house 1 year ago (%) - Other Race
Geographical mobility - Moved within same county (%)
Geographical mobility - Moved within same county (%) - White
Geographical mobility - Moved within same county (%) - Black or African American
Geographical mobility - Moved within same county (%) - Asian
Geographical mobility - Moved within same county (%) - Hispanic or Latino
Geographical mobility - Moved within same county (%) - American Indian and Alaska Native
Geographical mobility - Moved within same county (%) - Multirace
Geographical mobility - Moved within same county (%) - Other Race
Geographical mobility - Moved from different county within same state (%)
Geographical mobility - Moved from different county within same state (%) - White
Geographical mobility - Moved from different county within same state (%) - Black or African American
Geographical mobility - Moved from different county within same state (%) - Asian
Geographical mobility - Moved from different county within same state (%) - Hispanic or Latino
Geographical mobility - Moved from different county within same state (%) - American Indian and Alaska Native
Geographical mobility - Moved from different county within same state (%) - Multirace
Geographical mobility - Moved from different county within same state (%) - Other Race
Geographical mobility - Moved from different state (%)
Geographical mobility - Moved from different state (%) - White
Geographical mobility - Moved from different state (%) - Black or African American
Geographical mobility - Moved from different state (%) - Asian
Geographical mobility - Moved from different state (%) - Hispanic or Latino
Geographical mobility - Moved from different state (%) - American Indian and Alaska Native
Geographical mobility - Moved from different state (%) - Multirace
Geographical mobility - Moved from different state (%) - Other Race
Geographical mobility - Moved from abroad (%)
Geographical mobility - Moved from abroad (%) - White
Geographical mobility - Moved from abroad (%) - Black or African American
Geographical mobility - Moved from abroad (%) - Asian
Geographical mobility - Moved from abroad (%) - Hispanic or Latino
Geographical mobility - Moved from abroad (%) - American Indian and Alaska Native
Geographical mobility - Moved from abroad (%) - Multirace
Geographical mobility - Moved from abroad (%) - Other Race
Place of birth for the foreign-born population - Ireland (%)
Place of birth for the foreign-born population - Denmark (%)
Place of birth for the foreign-born population - Norway (%)
Place of birth for the foreign-born population - Sweden (%)
Place of birth for the foreign-born population - United Kingdom (%)
Place of birth for the foreign-born population - England (%)
Place of birth for the foreign-born population - Scotland (%)
Place of birth for the foreign-born population - Other Northern Europe (%)
Place of birth for the foreign-born population - Austria (%)
Place of birth for the foreign-born population - Belgium (%)
Place of birth for the foreign-born population - France (%)
Place of birth for the foreign-born population - Germany (%)
Place of birth for the foreign-born population - Netherlands (%)
Place of birth for the foreign-born population - Switzerland (%)
Place of birth for the foreign-born population - Other Western Europe (%)
Place of birth for the foreign-born population - Greece (%)
Place of birth for the foreign-born population - Italy (%)
Place of birth for the foreign-born population - Portugal (%)
Place of birth for the foreign-born population - Spain (%)
Place of birth for the foreign-born population - Other Southern Europe (%)
Place of birth for the foreign-born population - Albania (%)
Place of birth for the foreign-born population - Belarus (%)
Place of birth for the foreign-born population - Bosnia and Herzegovina (%)
Place of birth for the foreign-born population - Bulgaria (%)
Place of birth for the foreign-born population - Croatia (%)
Place of birth for the foreign-born population - Czechoslovakia (%)
Place of birth for the foreign-born population - Hungary (%)
Place of birth for the foreign-born population - Latvia (%)
Place of birth for the foreign-born population - Lithuania (%)
Place of birth for the foreign-born population - North Macedonia (Macedonia) (%)
Place of birth for the foreign-born population - Moldova (%)
Place of birth for the foreign-born population - Poland (%)
Place of birth for the foreign-born population - Romania (%)
Place of birth for the foreign-born population - Russia (%)
Place of birth for the foreign-born population - Serbia (%)
Place of birth for the foreign-born population - Ukraine (%)
Place of birth for the foreign-born population - Other Eastern Europe (%)
Place of birth for the foreign-born population - China (%)
Place of birth for the foreign-born population - Hong Kong (%)
Place of birth for the foreign-born population - Taiwan (%)
Place of birth for the foreign-born population - Japan (%)
Place of birth for the foreign-born population - Korea (%)
Place of birth for the foreign-born population - Other Eastern Asia (%)
Place of birth for the foreign-born population - Afghanistan (%)
Place of birth for the foreign-born population - Bangladesh (%)
Place of birth for the foreign-born population - India (%)
Place of birth for the foreign-born population - Iran (%)
Place of birth for the foreign-born population - Kazakhstan (%)
Place of birth for the foreign-born population - Nepal (%)
Place of birth for the foreign-born population - Pakistan (%)
Place of birth for the foreign-born population - Sri Lanka (%)
Place of birth for the foreign-born population - Uzbekistan (%)
Place of birth for the foreign-born population - Other South Central Asia (%)
Place of birth for the foreign-born population - Burma (%)
Place of birth for the foreign-born population - Cambodia (%)
Place of birth for the foreign-born population - Indonesia (%)
Place of birth for the foreign-born population - Laos (%)
Place of birth for the foreign-born population - Malaysia (%)
Place of birth for the foreign-born population - Philippines (%)
Place of birth for the foreign-born population - Singapore (%)
Place of birth for the foreign-born population - Thailand (%)
Place of birth for the foreign-born population - Vietnam (%)
Place of birth for the foreign-born population - Other South Eastern Asia (%)
Place of birth for the foreign-born population - Armenia (%)
Place of birth for the foreign-born population - Iraq (%)
Place of birth for the foreign-born population - Israel (%)
Place of birth for the foreign-born population - Jordan (%)
Place of birth for the foreign-born population - Kuwait (%)
Place of birth for the foreign-born population - Lebanon (%)
Place of birth for the foreign-born population - Saudi Arabia (%)
Place of birth for the foreign-born population - Syria (%)
Place of birth for the foreign-born population - Turkey (%)
Place of birth for the foreign-born population - Yemen (%)
Place of birth for the foreign-born population - Other Western Asia (%)
Place of birth for the foreign-born population - Eritrea (%)
Place of birth for the foreign-born population - Ethiopia (%)
Place of birth for the foreign-born population - Kenya (%)
Place of birth for the foreign-born population - Somalia (%)
Place of birth for the foreign-born population - Uganda (%)
Place of birth for the foreign-born population - Zimbabwe (%)
Place of birth for the foreign-born population - Other Eastern Africa (%)
Place of birth for the foreign-born population - Cameroon (%)
Place of birth for the foreign-born population - Congo (%)
Place of birth for the foreign-born population - Democratic Republic of Congo (Zaire) (%)
Place of birth for the foreign-born population - Other Middle Africa (%)
Place of birth for the foreign-born population - Egypt (%)
Place of birth for the foreign-born population - Morocco (%)
Place of birth for the foreign-born population - Sudan (%)
Place of birth for the foreign-born population - Other Northern Africa (%)
Place of birth for the foreign-born population - South Africa (%)
Place of birth for the foreign-born population - Other Southern Africa (%)
Place of birth for the foreign-born population - Cabo Verde (%)
Place of birth for the foreign-born population - Ghana (%)
Place of birth for the foreign-born population - Liberia (%)
Place of birth for the foreign-born population - Nigeria (%)
Place of birth for the foreign-born population - Senegal (%)
Place of birth for the foreign-born population - Sierra Leone (%)
Place of birth for the foreign-born population - Other Western Africa (%)
Place of birth for the foreign-born population - Australia (%)
Place of birth for the foreign-born population - New Zealand (%)
Place of birth for the foreign-born population - Fiji (%)
Place of birth for the foreign-born population - Micronesia (%)
Place of birth for the foreign-born population - Bahamas (%)
Place of birth for the foreign-born population - Barbados (%)
Place of birth for the foreign-born population - Cuba (%)
Place of birth for the foreign-born population - Dominica (%)
Place of birth for the foreign-born population - Dominican Republic (%)
Place of birth for the foreign-born population - Grenada (%)
Place of birth for the foreign-born population - Haiti (%)
Place of birth for the foreign-born population - Jamaica (%)
Place of birth for the foreign-born population - St. Vincent and the Grenadines (%)
Place of birth for the foreign-born population - Trinidad and Tobago (%)
Place of birth for the foreign-born population - West Indies (%)
Place of birth for the foreign-born population - Other Caribbean (%)
Place of birth for the foreign-born population - Belize (%)
Place of birth for the foreign-born population - Costa Rica (%)
Place of birth for the foreign-born population - El Salvador (%)
Place of birth for the foreign-born population - Guatemala (%)
Place of birth for the foreign-born population - Honduras (%)
Place of birth for the foreign-born population - Mexico (%)
Place of birth for the foreign-born population - Nicaragua (%)
Place of birth for the foreign-born population - Panama (%)
Place of birth for the foreign-born population - Other Central America (%)
Place of birth for the foreign-born population - Argentina (%)
Place of birth for the foreign-born population - Bolivia (%)
Place of birth for the foreign-born population - Brazil (%)
Place of birth for the foreign-born population - Chile (%)
Place of birth for the foreign-born population - Colombia (%)
Place of birth for the foreign-born population - Ecuador (%)
Place of birth for the foreign-born population - Guyana (%)
Place of birth for the foreign-born population - Peru (%)
Place of birth for the foreign-born population - Uruguay (%)
Place of birth for the foreign-born population - Venezuela (%)
Place of birth for the foreign-born population - Other South America (%)
Place of birth for the foreign-born population - Canada (%)
Place of birth for the foreign-born population - Other Northern America (%)
Place of birth for the foreign-born population - Other (%)
Latest news about races in Melissa, TX collected exclusively by city-data.com from local newspapers, TV, and radio stations
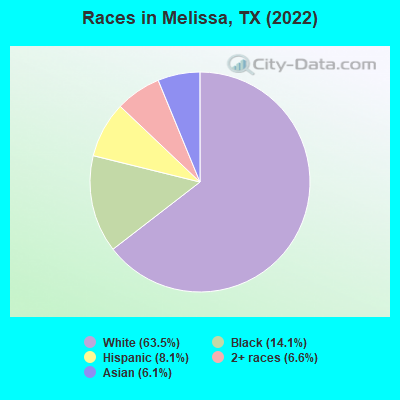
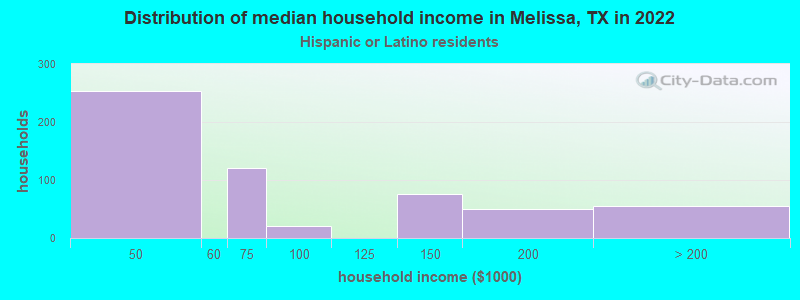
According to 2022 data, the most numerous races in Melissa, TX are Hispanic (1,320 residents), White alone (10,386 residents), and Black alone (2,312 residents). 83.2% of Melissa residents speak English at home. 10.5% of Melissa, TX residents are foreign-born (5.4% born in Asia, 2.6% born in Latin America, 2.0% born in Africa), which is 61.2% less than the foreign-born rate of 17.0% across the entire state of Texas.
Race distribution in Melissa
2000 2022
10,933,313 52.4% White alone 6,669,666 32.0% Hispanic 2,364,255 11.3% Black alone 554,445 2.7% Asian alone 230,567 1.1% Two or more races 68,859 0.3% American Indian alone 19,958 0.10% Other race alone 10,757 0.05% Native Hawaiian and Other
12,070,642 40.2% Hispanic 11,683,430 38.9% White alone 3,508,706 11.7% Black alone 1,608,173 5.4% Asian alone 956,560 3.2% Two or more races 125,763 0.4% Other race alone 47,023 0.2% American Indian alone 29,275 0.10% Native Hawaiian and Other
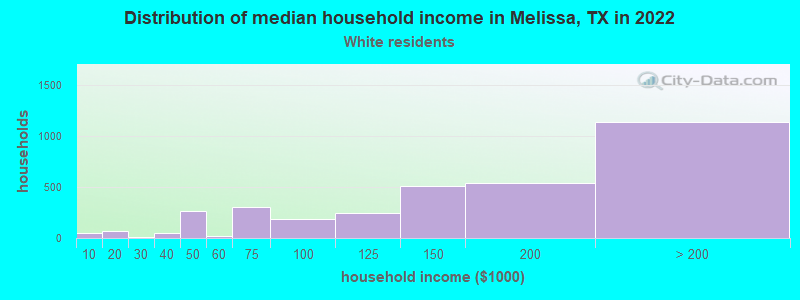
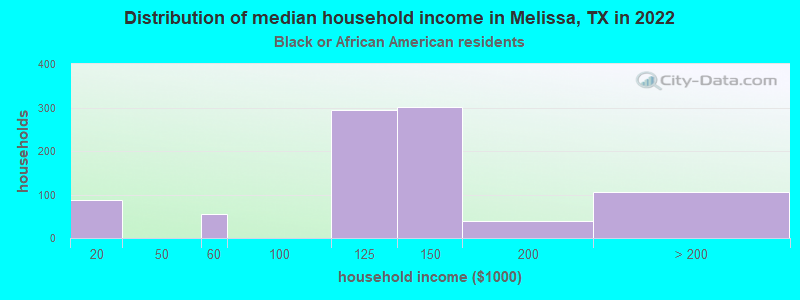
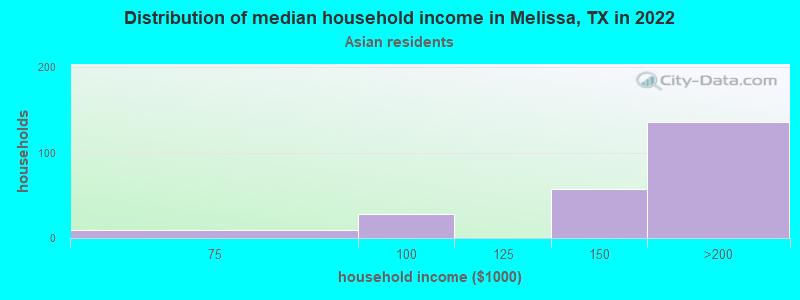
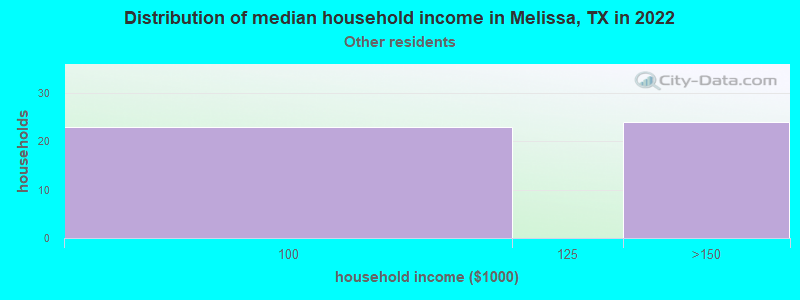
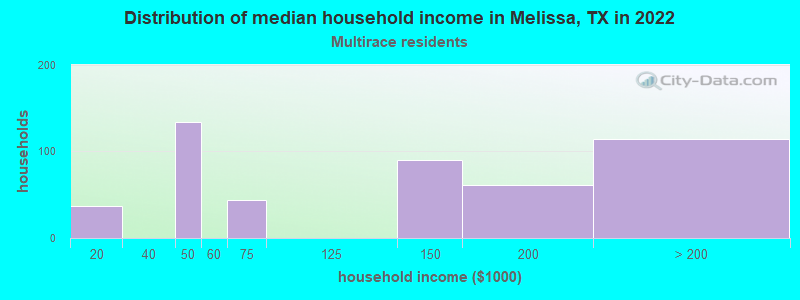
Income and house value in Melissa Median household income in 2022 $148,460 White non-Hispanic householders$132,408 Black householders$166,736 Asian householders$52,312 Hispanic or Latino race householdersMedian 2022 house value $802,533 White Non-Hispanic householders$383,538 American Indian or Alaska Native householders $232,850 Asian householders$81,139 Some other race householdersover $1,000,000 Two or more races householders$230,123 Hispanic or Latino householders
Median age by race in Melissa
36.9 Median age for White residents37.7 34.2 29.3 Median age for Black or African American residents14.5 34.3 -825,102,879.8 Median age for American Indian / Alaska Native residents-724,137,930.3 -737,899,542.6 41.7 Median age for Asian residents42.8 41.0 -819,226,749.4 Median age for Native Hawaiian / Pacific Islander residents-770,894,787.8 -577,777,777.2 21.8 Median age for Other race residents46.3 14.0 34.0 Median age for Two or more races residents53.2 9.0 36.0 Median age for White alone residents38.2 33.6 37.6 Median age for Hispanic or Latino residents38.1 20.9
Owner/renter occupied households by race in Melissa
House owners and renters - White residents 3,090 88.6% Owner occupied397 11.4% Renter occupiedHouse owners and renters - Black or African American residents 752 89.9% Owner occupied84 10.1% Renter occupiedHouse owners and renters - American Indian / Alaska Native residents 3 100.0% Owner occupiedHouse owners and renters - Asian residents 217 100.0% Owner occupiedHouse owners and renters - Other race residents 43 100.0% Owner occupiedHouse owners and renters - Two or more races residents 633 98.0% Owner occupied13 2.0% Renter occupiedHouse owners and renters - White alone residents 2,938 87.9% Owner occupied403 12.1% Renter occupiedHouse owners and renters - Hispanic or Latino residents 619 100.0% Owner occupied
Language usage in Melissa
English speakers - Total 83.2% of residents of Melissa speak English at home.
6.2% of residents speak Spanish at home 702 76.4% Speak English very well217 23.6% Speak English less than very well10.6% of residents speak other language at home 1,294 82.0% Speak English very well285 18.0% Speak English less than very well
English speakers - Born in the United States 93.1% of residents of Melissa speak English at home.
4.5% of residents speak Spanish at home 204 74.7% Speak English very well69 25.3% Speak English less than very well2.1% of residents speak other language at home 126 100.0% Speak English very well
English speakers - Native, born elsewhere 59.3% of residents of Melissa speak English at home.
28.8% of residents speak other language at home 85 100.0% Speak English very well
English speakers - Foreign-born 14.5% of residents of Melissa speak English at home.
21.6% of residents speak Spanish at home 257 64.7% Speak English very well140 35.3% Speak English less than very well65.2% of residents speak other language at home 914 76.4% Speak English very well283 23.6% Speak English less than very well
White (Caucasian) - Speak only English Native:
95.9% (9,165)Foreign-born:
41.5% (57)
White (Caucasian) - Speak another language Native:
4.5% (431)Foreign-born:
61.5% (85)
Black or African American - Speak another language Native:
8.1% (142)Foreign-born:
100.0% (313)
Asian - Speak another language Native:
100.0% (122)Foreign-born:
85.1% (725)
Other race - Speak another language Native:
15.1% (20)Foreign-born:
100.0% (59)
Two or more races - Speak only English Native:
90.3% (1,158)Foreign-born:
19.1% (120)
Two or more races - Speak another language Native:
8.8% (113)Foreign-born:
80.5% (505)
White alone - Speak only English Native:
97.1% (9,158)Foreign-born:
45.4% (55)
White alone - Speak another language Native:
2.9% (274)Foreign-born:
52.7% (64)
Hispanic or Latino - Speak another language Native:
44.8% (345)Foreign-born:
98.9% (417)
Foreign-born residents in Melissa 1,726 residents are foreign born (5.4% Asia , 2.6% Latin America , 2.0% Africa ).
This city:
10.5%Texas:
17.1%
Marital status for residents in Melissa Marital status - White (Caucasian) population 15 years and over
Males 18.4% Never married76.2% Now married0.0% Separated3.8% Widowed1.6% DivorcedFemales 25.4% Never married69.2% Now married0.0% Separated2.6% Widowed2.8% DivorcedWomen who gave birth in the past 12 months Now married:
100.0% (109)Unmarried:
0.0% (0)
Women who did not give birth in the past 12 months Now married:
65.4% (1,925)Unmarried:
34.6% (1,017)
Marital status - Black or African American population 15 years and over
Males 7.0% Never married93.0% Now married0.0% Separated0.0% Widowed0.0% DivorcedFemales 20.2% Never married59.1% Now married0.0% Separated0.0% Widowed20.8% DivorcedWomen who gave birth in the past 12 months Now married:
100.0% (15)Unmarried:
0.0% (0)
Women who did not give birth in the past 12 months Now married:
61.0% (560)Unmarried:
39.0% (358)
Marital status - American Indian / Alaska Native population 15 years and over
Males 0.0% Never married100.0% Now married0.0% Separated0.0% Widowed0.0% DivorcedFemales 0.0% Never married100.0% Now married0.0% Separated0.0% Widowed0.0% DivorcedMarital status - Asian population 15 years and over
Males 0.0% Never married69.6% Now married0.0% Separated30.4% Widowed0.0% DivorcedFemales 0.0% Never married68.1% Now married0.0% Separated17.3% Widowed14.6% DivorcedWomen who did not give birth in the past 12 months Now married:
100.0% (261)Unmarried:
0.0% (0)
Marital status - Other race population 15 years and over
Males 26.9% Never married57.7% Now married0.0% Separated0.0% Widowed15.4% DivorcedFemales 0.0% Never married100.0% Now married0.0% Separated0.0% Widowed0.0% DivorcedWomen who did not give birth in the past 12 months Now married:
100.0% (47)Unmarried:
0.0% (0)
Marital status - Two or more races population 15 years and over
Males 22.4% Never married46.0% Now married0.0% Separated20.6% Widowed11.1% DivorcedFemales 41.4% Never married54.4% Now married0.0% Separated0.0% Widowed4.2% DivorcedWomen who did not give birth in the past 12 months Now married:
56.8% (115)Unmarried:
43.2% (87)
Marital status - White alone, not Hispanic / Latino population 15 years and over
Males 19.1% Never married75.0% Now married0.0% Separated4.2% Widowed1.8% DivorcedFemales 24.6% Never married70.0% Now married0.0% Separated2.6% Widowed2.8% DivorcedWomen who gave birth in the past 12 months Now married:
100.0% (114)Unmarried:
0.0% (0)
Women who did not give birth in the past 12 months Now married:
66.3% (1,979)Unmarried:
33.7% (1,004)
Marital status - Hispanic or Latino population 15 years and over
Males 17.8% Never married60.5% Now married0.0% Separated21.7% Widowed0.0% DivorcedFemales 53.3% Never married46.7% Now married0.0% Separated0.0% Widowed0.0% DivorcedWomen who did not give birth in the past 12 months Now married:
42.4% (94)Unmarried:
57.6% (128)
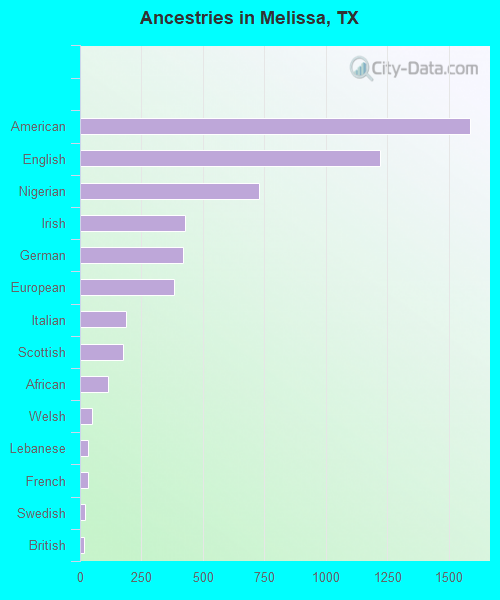
Ancestries in Melissa
1,585 19.3% American1,222 14.9% English728 8.9% Nigerian428 5.2% Irish421 5.1% German382 4.6% European188 2.3% Italian176 2.1% Scottish114 1.4% African48 0.6% Welsh31 0.4% Lebanese31 0.4% French21 0.3% Swedish17 0.2% British
Geographical mobility in Melissa Same house 1 year ago 8,510 83.4% White (Caucasian)1,922 79.7% Black or African American20 100.0% American Indian / Alaska Native437 43.8% Asian147 76.2% Other race1,754 83.3% Two or more races8,434 82.6% White alone, not Hispanic / Latino1,185 93.7% Hispanic or LatinoMoved within same county 1,240 12.1% White / Caucasian106 4.4% Black or African American479 48.0% Asian38 19.8% Other race258 12.2% Two or more races1,331 13.0% White alone, not Hispanic / Latino50 3.9% Hispanic or LatinoMoved within same state 126 1.2% White / Caucasian57 2.4% Black or African American52 5.2% Asian22 1.0% Two or more races129 1.3% White alone, not Hispanic / Latino16 1.3% Hispanic or LatinoMoved from different state 194 1.9% White / Caucasian405 16.8% Black or African American199 1.9% White alone, not Hispanic / Latino
Children Nativity (place of birth) in Melissa
Children under 6 years - Living with two parents Both parents native 1,579 100.0% NativeBoth parents foreign-born 23 100.0% NativeOne native, one foreign-born parent 12 100.0% NativeChildren under 6 years - Living with one parent Native parent 64 100.0% NativeForeign-born parent 250 100.0% NativeChildren 6 to 17 years - Living with two parents Both parents native 2,282 100.0% NativeBoth parents foreign-born 99 40.7% Native144 59.3% Foreign-bornOne native, one foreign-born parent 106 89.8% Native12 10.2% Foreign-bornChildren 6 to 17 years - Living with one parent Native parent 282 100.0% NativeForeign-born parent 244 47.2% Native274 52.8% Foreign-born
Grandparents responsible for own grandchildren in Melissa
Grandparents (30 to 59 years) White / Caucasian 26 35.4% Responsible for grandchildren47 64.6% Not responsible for grandchildrenBlack or African American 46 100.0% Not responsible for grandchildrenAmerican Indian / Alaska Native 13 100.0% Responsible for grandchildrenWhite alone, not Hispanic / Latino 25 35.3% Responsible for grandchildren46 64.7% Not responsible for grandchildrenHispanic or Latino 5 100.0% Responsible for grandchildren
Grandparents (60 years and over) White / Caucasian 6 100.0% Responsible for grandchildrenBlack or African American 50 100.0% Not responsible for grandchildrenWhite alone, not Hispanic / Latino 5 100.0% Responsible for grandchildren