Races in Manor, Texas (TX) Detailed Stats
Data:
Races - White alone (%)
Races - White alone (% change since 2000)
Races - Black alone (%)
Races - Black alone (% change since 2000)
Races - American Indian alone (%)
Races - American Indian alone (% change since 2000)
Races - Asian alone (%)
Races - Asian alone (% change since 2000)
Races - Hispanic (%)
Races - Hispanic (% change since 2000)
Races - Native Hawaiian and Other Pacific Islander alone (%)
Races - Native Hawaiian and Other Pacific Islander alone (% change since 2000)
Races - Two or more races(%)
Races - Two or more races(% change since 2000)
Races - Other race alone (%)
Races - Other race alone (% change since 2000)
Racial diversity
Place of birth - Born in state of residence (%)
Place of birth - Born in state of residence (%) - White
Place of birth - Born in state of residence (%) - Black or African American
Place of birth - Born in state of residence (%) - Asian
Place of birth - Born in state of residence (%) - Hispanic or Latino
Place of birth - Born in state of residence (%) - American Indian and Alaska Native
Place of birth - Born in state of residence (%) - Multirace
Place of birth - Born in state of residence (%) - Other Race
Place of birth - Born in other state (%)
Place of birth - Born in other state (%) - White
Place of birth - Born in other state (%) - Black or African American
Place of birth - Born in other state (%) - Asian
Place of birth - Born in other state (%) - Hispanic or Latino
Place of birth - Born in other state (%) - American Indian and Alaska Native
Place of birth - Born in other state (%) - Multirace
Place of birth - Born in other state (%) - Other Race
Place of birth - Native, outside of US (%)
Place of birth - Native, outside of US (%) - White
Place of birth - Native, outside of US (%) - Black or African American
Place of birth - Native, outside of US (%) - Asian
Place of birth - Native, outside of US (%) - Hispanic or Latino
Place of birth - Native, outside of US (%) - American Indian and Alaska Native
Place of birth - Native, outside of US (%) - Multirace
Place of birth - Native, outside of US (%) - Other Race
Place of birth - Foreign born (%)
Place of birth - Foreign born (%) - White
Place of birth - Foreign born (%) - Black or African American
Place of birth - Foreign born (%) - Asian
Place of birth - Foreign born (%) - Hispanic or Latino
Place of birth - Foreign born (%) - American Indian and Alaska Native
Place of birth - Foreign born (%) - Multirace
Place of birth - Foreign born (%) - Other Race
Residents speaking English at home (%)
Residents speaking English at home - Born in the United States (%)
Residents speaking English at home - Native, born elsewhere (%)
Residents speaking English at home - Foreign born (%)
Residents speaking Spanish at home (%)
Residents speaking Spanish at home - Born in the United States (%)
Residents speaking Spanish at home - Native, born elsewhere (%)
Residents speaking Spanish at home - Foreign born (%)
Residents speaking other language at home (%)
Residents speaking other language at home - Born in the United States (%)
Residents speaking other language at home - Native, born elsewhere (%)
Residents speaking other language at home - Foreign born (%)
Marital status - Never married (%)
Marital status - Now married (%)
Marital status - Separated (%)
Marital status - Widowed (%)
Marital status - Divorced (%)
Ancestries Reported - Arab (%)
Ancestries Reported - Czech (%)
Ancestries Reported - Danish (%)
Ancestries Reported - Dutch (%)
Ancestries Reported - English (%)
Ancestries Reported - French (%)
Ancestries Reported - French Canadian (%)
Ancestries Reported - German (%)
Ancestries Reported - Greek (%)
Ancestries Reported - Hungarian (%)
Ancestries Reported - Irish (%)
Ancestries Reported - Italian (%)
Ancestries Reported - Lithuanian (%)
Ancestries Reported - Norwegian (%)
Ancestries Reported - Polish (%)
Ancestries Reported - Portuguese (%)
Ancestries Reported - Russian (%)
Ancestries Reported - Scotch-Irish (%)
Ancestries Reported - Scottish (%)
Ancestries Reported - Slovak (%)
Ancestries Reported - Subsaharan African (%)
Ancestries Reported - Swedish (%)
Ancestries Reported - Swiss (%)
Ancestries Reported - Ukrainian (%)
Ancestries Reported - United States (%)
Ancestries Reported - Welsh (%)
Ancestries Reported - West Indian (%)
Ancestries Reported - Other (%)
Geographical mobility - Same house 1 year ago (%)
Geographical mobility - Same house 1 year ago (%) - White
Geographical mobility - Same house 1 year ago (%) - Black or African American
Geographical mobility - Same house 1 year ago (%) - Asian
Geographical mobility - Same house 1 year ago (%) - Hispanic or Latino
Geographical mobility - Same house 1 year ago (%) - American Indian and Alaska Native
Geographical mobility - Same house 1 year ago (%) - Multirace
Geographical mobility - Same house 1 year ago (%) - Other Race
Geographical mobility - Moved within same county (%)
Geographical mobility - Moved within same county (%) - White
Geographical mobility - Moved within same county (%) - Black or African American
Geographical mobility - Moved within same county (%) - Asian
Geographical mobility - Moved within same county (%) - Hispanic or Latino
Geographical mobility - Moved within same county (%) - American Indian and Alaska Native
Geographical mobility - Moved within same county (%) - Multirace
Geographical mobility - Moved within same county (%) - Other Race
Geographical mobility - Moved from different county within same state (%)
Geographical mobility - Moved from different county within same state (%) - White
Geographical mobility - Moved from different county within same state (%) - Black or African American
Geographical mobility - Moved from different county within same state (%) - Asian
Geographical mobility - Moved from different county within same state (%) - Hispanic or Latino
Geographical mobility - Moved from different county within same state (%) - American Indian and Alaska Native
Geographical mobility - Moved from different county within same state (%) - Multirace
Geographical mobility - Moved from different county within same state (%) - Other Race
Geographical mobility - Moved from different state (%)
Geographical mobility - Moved from different state (%) - White
Geographical mobility - Moved from different state (%) - Black or African American
Geographical mobility - Moved from different state (%) - Asian
Geographical mobility - Moved from different state (%) - Hispanic or Latino
Geographical mobility - Moved from different state (%) - American Indian and Alaska Native
Geographical mobility - Moved from different state (%) - Multirace
Geographical mobility - Moved from different state (%) - Other Race
Geographical mobility - Moved from abroad (%)
Geographical mobility - Moved from abroad (%) - White
Geographical mobility - Moved from abroad (%) - Black or African American
Geographical mobility - Moved from abroad (%) - Asian
Geographical mobility - Moved from abroad (%) - Hispanic or Latino
Geographical mobility - Moved from abroad (%) - American Indian and Alaska Native
Geographical mobility - Moved from abroad (%) - Multirace
Geographical mobility - Moved from abroad (%) - Other Race
Place of birth for the foreign-born population - Ireland (%)
Place of birth for the foreign-born population - Denmark (%)
Place of birth for the foreign-born population - Norway (%)
Place of birth for the foreign-born population - Sweden (%)
Place of birth for the foreign-born population - United Kingdom (%)
Place of birth for the foreign-born population - England (%)
Place of birth for the foreign-born population - Scotland (%)
Place of birth for the foreign-born population - Other Northern Europe (%)
Place of birth for the foreign-born population - Austria (%)
Place of birth for the foreign-born population - Belgium (%)
Place of birth for the foreign-born population - France (%)
Place of birth for the foreign-born population - Germany (%)
Place of birth for the foreign-born population - Netherlands (%)
Place of birth for the foreign-born population - Switzerland (%)
Place of birth for the foreign-born population - Other Western Europe (%)
Place of birth for the foreign-born population - Greece (%)
Place of birth for the foreign-born population - Italy (%)
Place of birth for the foreign-born population - Portugal (%)
Place of birth for the foreign-born population - Spain (%)
Place of birth for the foreign-born population - Other Southern Europe (%)
Place of birth for the foreign-born population - Albania (%)
Place of birth for the foreign-born population - Belarus (%)
Place of birth for the foreign-born population - Bosnia and Herzegovina (%)
Place of birth for the foreign-born population - Bulgaria (%)
Place of birth for the foreign-born population - Croatia (%)
Place of birth for the foreign-born population - Czechoslovakia (%)
Place of birth for the foreign-born population - Hungary (%)
Place of birth for the foreign-born population - Latvia (%)
Place of birth for the foreign-born population - Lithuania (%)
Place of birth for the foreign-born population - North Macedonia (Macedonia) (%)
Place of birth for the foreign-born population - Moldova (%)
Place of birth for the foreign-born population - Poland (%)
Place of birth for the foreign-born population - Romania (%)
Place of birth for the foreign-born population - Russia (%)
Place of birth for the foreign-born population - Serbia (%)
Place of birth for the foreign-born population - Ukraine (%)
Place of birth for the foreign-born population - Other Eastern Europe (%)
Place of birth for the foreign-born population - China (%)
Place of birth for the foreign-born population - Hong Kong (%)
Place of birth for the foreign-born population - Taiwan (%)
Place of birth for the foreign-born population - Japan (%)
Place of birth for the foreign-born population - Korea (%)
Place of birth for the foreign-born population - Other Eastern Asia (%)
Place of birth for the foreign-born population - Afghanistan (%)
Place of birth for the foreign-born population - Bangladesh (%)
Place of birth for the foreign-born population - India (%)
Place of birth for the foreign-born population - Iran (%)
Place of birth for the foreign-born population - Kazakhstan (%)
Place of birth for the foreign-born population - Nepal (%)
Place of birth for the foreign-born population - Pakistan (%)
Place of birth for the foreign-born population - Sri Lanka (%)
Place of birth for the foreign-born population - Uzbekistan (%)
Place of birth for the foreign-born population - Other South Central Asia (%)
Place of birth for the foreign-born population - Burma (%)
Place of birth for the foreign-born population - Cambodia (%)
Place of birth for the foreign-born population - Indonesia (%)
Place of birth for the foreign-born population - Laos (%)
Place of birth for the foreign-born population - Malaysia (%)
Place of birth for the foreign-born population - Philippines (%)
Place of birth for the foreign-born population - Singapore (%)
Place of birth for the foreign-born population - Thailand (%)
Place of birth for the foreign-born population - Vietnam (%)
Place of birth for the foreign-born population - Other South Eastern Asia (%)
Place of birth for the foreign-born population - Armenia (%)
Place of birth for the foreign-born population - Iraq (%)
Place of birth for the foreign-born population - Israel (%)
Place of birth for the foreign-born population - Jordan (%)
Place of birth for the foreign-born population - Kuwait (%)
Place of birth for the foreign-born population - Lebanon (%)
Place of birth for the foreign-born population - Saudi Arabia (%)
Place of birth for the foreign-born population - Syria (%)
Place of birth for the foreign-born population - Turkey (%)
Place of birth for the foreign-born population - Yemen (%)
Place of birth for the foreign-born population - Other Western Asia (%)
Place of birth for the foreign-born population - Eritrea (%)
Place of birth for the foreign-born population - Ethiopia (%)
Place of birth for the foreign-born population - Kenya (%)
Place of birth for the foreign-born population - Somalia (%)
Place of birth for the foreign-born population - Uganda (%)
Place of birth for the foreign-born population - Zimbabwe (%)
Place of birth for the foreign-born population - Other Eastern Africa (%)
Place of birth for the foreign-born population - Cameroon (%)
Place of birth for the foreign-born population - Congo (%)
Place of birth for the foreign-born population - Democratic Republic of Congo (Zaire) (%)
Place of birth for the foreign-born population - Other Middle Africa (%)
Place of birth for the foreign-born population - Egypt (%)
Place of birth for the foreign-born population - Morocco (%)
Place of birth for the foreign-born population - Sudan (%)
Place of birth for the foreign-born population - Other Northern Africa (%)
Place of birth for the foreign-born population - South Africa (%)
Place of birth for the foreign-born population - Other Southern Africa (%)
Place of birth for the foreign-born population - Cabo Verde (%)
Place of birth for the foreign-born population - Ghana (%)
Place of birth for the foreign-born population - Liberia (%)
Place of birth for the foreign-born population - Nigeria (%)
Place of birth for the foreign-born population - Senegal (%)
Place of birth for the foreign-born population - Sierra Leone (%)
Place of birth for the foreign-born population - Other Western Africa (%)
Place of birth for the foreign-born population - Australia (%)
Place of birth for the foreign-born population - New Zealand (%)
Place of birth for the foreign-born population - Fiji (%)
Place of birth for the foreign-born population - Micronesia (%)
Place of birth for the foreign-born population - Bahamas (%)
Place of birth for the foreign-born population - Barbados (%)
Place of birth for the foreign-born population - Cuba (%)
Place of birth for the foreign-born population - Dominica (%)
Place of birth for the foreign-born population - Dominican Republic (%)
Place of birth for the foreign-born population - Grenada (%)
Place of birth for the foreign-born population - Haiti (%)
Place of birth for the foreign-born population - Jamaica (%)
Place of birth for the foreign-born population - St. Vincent and the Grenadines (%)
Place of birth for the foreign-born population - Trinidad and Tobago (%)
Place of birth for the foreign-born population - West Indies (%)
Place of birth for the foreign-born population - Other Caribbean (%)
Place of birth for the foreign-born population - Belize (%)
Place of birth for the foreign-born population - Costa Rica (%)
Place of birth for the foreign-born population - El Salvador (%)
Place of birth for the foreign-born population - Guatemala (%)
Place of birth for the foreign-born population - Honduras (%)
Place of birth for the foreign-born population - Mexico (%)
Place of birth for the foreign-born population - Nicaragua (%)
Place of birth for the foreign-born population - Panama (%)
Place of birth for the foreign-born population - Other Central America (%)
Place of birth for the foreign-born population - Argentina (%)
Place of birth for the foreign-born population - Bolivia (%)
Place of birth for the foreign-born population - Brazil (%)
Place of birth for the foreign-born population - Chile (%)
Place of birth for the foreign-born population - Colombia (%)
Place of birth for the foreign-born population - Ecuador (%)
Place of birth for the foreign-born population - Guyana (%)
Place of birth for the foreign-born population - Peru (%)
Place of birth for the foreign-born population - Uruguay (%)
Place of birth for the foreign-born population - Venezuela (%)
Place of birth for the foreign-born population - Other South America (%)
Place of birth for the foreign-born population - Canada (%)
Place of birth for the foreign-born population - Other Northern America (%)
Place of birth for the foreign-born population - Other (%)
Latest news about races in Manor, TX collected exclusively by city-data.com from local newspapers, TV, and radio stations
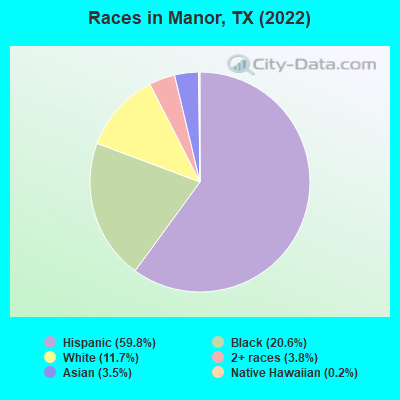
According to 2022 data, the most numerous races in Manor, TX are Hispanic (9,447 residents), White alone (1,843 residents), and Black alone (3,258 residents). 43.3% of Manor residents speak English at home. 21.9% of Manor, TX residents are foreign-born (16.3% born in Latin America, 2.4% born in Africa), which is 22.4% greater than the foreign-born rate of 17.0% across the entire state of Texas.
Race distribution in Manor
2000 2022
10,933,313 52.4% White alone 6,669,666 32.0% Hispanic 2,364,255 11.3% Black alone 554,445 2.7% Asian alone 230,567 1.1% Two or more races 68,859 0.3% American Indian alone 19,958 0.10% Other race alone 10,757 0.05% Native Hawaiian and Other
12,070,642 40.2% Hispanic 11,683,430 38.9% White alone 3,508,706 11.7% Black alone 1,608,173 5.4% Asian alone 956,560 3.2% Two or more races 125,763 0.4% Other race alone 47,023 0.2% American Indian alone 29,275 0.10% Native Hawaiian and Other
Income and house value in Manor Median household income in 2022 $99,977 White non-Hispanic householders$108,670 Black householders$154,435 Asian householders$62,192 Some other race householders$80,023 Two or more races householders$91,118 Hispanic or Latino race householdersMedian 2022 house value $476,416 White Non-Hispanic householders$356,568 Black or African American householders$167,490 American Indian or Alaska Native householders$437,708 Some other race householders$204,710 Two or more races householders$437,708 Hispanic or Latino householders
Median age by race in Manor
31.2 Median age for White residents34.4 29.4 31.2 Median age for Black or African American residents26.2 30.8 -779,116,465.1 Median age for American Indian / Alaska Native residents-793,749,999.2 -794,946,549.3 31.0 Median age for Asian residents28.1 35.8 -749,403,340.5 Median age for Native Hawaiian / Pacific Islander residents-751,851,851.1 -643,584,520.7 29.3 Median age for Other race residents28.6 29.0 32.1 Median age for Two or more races residents22.8 32.6 33.4 Median age for White alone residents33.6 33.3 29.5 Median age for Hispanic or Latino residents30.5 28.6
Owner/renter occupied households by race in Manor
House owners and renters - White residents 1,621 85.6% Owner occupied272 14.4% Renter occupiedHouse owners and renters - Black or African American residents 1,059 87.7% Owner occupied148 12.3% Renter occupiedHouse owners and renters - American Indian / Alaska Native residents 15 100.0% Owner occupiedHouse owners and renters - Asian residents 172 100.0% Owner occupiedHouse owners and renters - Other race residents 558 68.2% Owner occupied260 31.8% Renter occupiedHouse owners and renters - Two or more races residents 1,174 95.5% Owner occupied55 4.5% Renter occupiedHouse owners and renters - White alone residents 663 77.8% Owner occupied189 22.2% Renter occupiedHouse owners and renters - Hispanic or Latino residents 2,326 85.5% Owner occupied396 14.5% Renter occupied
Language usage in Manor
English speakers - Total 43.3% of residents of Manor speak English at home.
49.2% of residents speak Spanish at home 4,663 68.6% Speak English very well2,136 31.4% Speak English less than very well6.4% of residents speak other language at home 796 90.1% Speak English very well87 9.9% Speak English less than very well
English speakers - Born in the United States 64.8% of residents of Manor speak English at home.
31.8% of residents speak Spanish at home 851 97.6% Speak English very well21 2.4% Speak English less than very well1.6% of residents speak other language at home 45 100.0% Speak English very well
English speakers - Native, born elsewhere 26.2% of residents of Manor speak English at home.
58.1% of residents speak Spanish at home 88 48.4% Speak English very well94 51.6% Speak English less than very well
English speakers - Foreign-born 7.3% of residents of Manor speak English at home.
71.7% of residents speak Spanish at home 911 36.9% Speak English very well1,555 63.1% Speak English less than very well20.4% of residents speak other language at home 614 87.7% Speak English very well86 12.3% Speak English less than very well
White (Caucasian) - Speak only English Native:
53.8% (2,138)Foreign-born:
9.4% (45)
White (Caucasian) - Speak another language Native:
29.8% (1,182)Foreign-born:
82.6% (398)
Black or African American - Speak only English Native:
93.4% (2,321)Foreign-born:
32.6% (114)
Black or African American - Speak another language Native:
6.6% (163)Foreign-born:
66.2% (232)
Asian - Speak only English Native:
44.0% (110)Foreign-born:
12.4% (39)
Asian - Speak another language Native:
59.6% (149)Foreign-born:
87.4% (273)
Other race - Speak only English Native:
31.0% (567)Foreign-born:
2.0% (24)
Other race - Speak another language Native:
66.3% (1,214)Foreign-born:
97.4% (1,175)
Two or more races - Speak another language Native:
83.4% (1,844)Foreign-born:
100.0% (1,532)
White alone - Speak only English Native:
97.7% (1,459)Foreign-born:
56.0% (53)
White alone - Speak another language Native:
2.4% (36)Foreign-born:
42.5% (40)
Hispanic or Latino - Speak only English Native:
26.0% (1,510)Foreign-born:
0.8% (20)
Hispanic or Latino - Speak another language Native:
72.9% (4,236)Foreign-born:
99.1% (2,445)
Foreign-born residents in Manor 3,460 residents are foreign born (16.3% Latin America , 2.4% Africa ).
This city:
21.9%Texas:
17.1%
Marital status for residents in Manor Marital status - White (Caucasian) population 15 years and over
Males 34.2% Never married62.8% Now married0.0% Separated0.0% Widowed3.0% DivorcedFemales 21.6% Never married67.3% Now married0.6% Separated1.5% Widowed9.0% DivorcedWomen who gave birth in the past 12 months Now married:
100.0% (36)Unmarried:
0.0% (0)
Women who did not give birth in the past 12 months Now married:
64.9% (854)Unmarried:
35.1% (461)
Marital status - Black or African American population 15 years and over
Males 38.8% Never married55.7% Now married0.0% Separated0.0% Widowed5.5% DivorcedFemales 37.2% Never married43.4% Now married2.7% Separated8.3% Widowed8.3% DivorcedWomen who gave birth in the past 12 months Now married:
0.0% (0)Unmarried:
100.0% (24)
Women who did not give birth in the past 12 months Now married:
52.6% (495)Unmarried:
47.4% (447)
Marital status - American Indian / Alaska Native population 15 years and over
Males 0.0% Never married100.0% Now married0.0% Separated0.0% Widowed0.0% DivorcedFemales 0.0% Never married100.0% Now married0.0% Separated0.0% Widowed0.0% DivorcedWomen who did not give birth in the past 12 months Now married:
100.0% (30)Unmarried:
0.0% (0)
Marital status - Asian population 15 years and over
Males 43.5% Never married56.5% Now married0.0% Separated0.0% Widowed0.0% DivorcedFemales 0.0% Never married100.0% Now married0.0% Separated0.0% Widowed0.0% DivorcedWomen who gave birth in the past 12 months Now married:
100.0% (20)Unmarried:
0.0% (0)
Women who did not give birth in the past 12 months Now married:
100.0% (98)Unmarried:
0.0% (0)
Marital status - Other race population 15 years and over
Males 38.1% Never married57.2% Now married0.0% Separated0.0% Widowed4.7% DivorcedFemales 54.1% Never married41.4% Now married0.0% Separated0.0% Widowed4.4% DivorcedWomen who did not give birth in the past 12 months Now married:
38.4% (338)Unmarried:
61.6% (543)
Marital status - Two or more races population 15 years and over
Males 42.9% Never married49.7% Now married0.0% Separated0.0% Widowed7.4% DivorcedFemales 43.3% Never married40.8% Now married2.7% Separated7.1% Widowed6.0% DivorcedWomen who gave birth in the past 12 months Now married:
30.4% (35)Unmarried:
69.6% (81)
Women who did not give birth in the past 12 months Now married:
45.5% (608)Unmarried:
54.5% (727)
Marital status - White alone, not Hispanic / Latino population 15 years and over
Males 24.0% Never married76.0% Now married0.0% Separated0.0% Widowed0.0% DivorcedFemales 8.2% Never married73.2% Now married1.4% Separated0.0% Widowed17.2% DivorcedWomen who gave birth in the past 12 months Now married:
100.0% (29)Unmarried:
0.0% (0)
Women who did not give birth in the past 12 months Now married:
77.2% (488)Unmarried:
22.8% (144)
Marital status - Hispanic or Latino population 15 years and over
Males 38.5% Never married56.5% Now married0.0% Separated0.0% Widowed5.0% DivorcedFemales 42.9% Never married48.0% Now married1.0% Separated3.4% Widowed4.7% DivorcedWomen who gave birth in the past 12 months Now married:
40.7% (34)Unmarried:
59.3% (49)
Women who did not give birth in the past 12 months Now married:
49.1% (1,157)Unmarried:
50.9% (1,201)
Ancestries in Manor
350 3.6% Nigerian122 1.3% European108 1.1% English106 1.1% African103 1.1% American103 1.1% Portuguese61 0.6% German53 0.5% Ethiopian47 0.5% Scottish22 0.2% Welsh20 0.2% British16 0.2% Irish8 0.08% Dutch7 0.07% Turkish5 0.05% Eastern European4 0.04% Polish3 0.03% Sierra Leonean
Geographical mobility in Manor Same house 1 year ago 4,728 87.4% White (Caucasian)3,163 96.8% Black or African American63 100.0% American Indian / Alaska Native465 82.8% Asian2,559 78.7% Other race3,437 88.4% Two or more races1,229 68.0% White alone, not Hispanic / Latino8,371 89.7% Hispanic or LatinoMoved within same county 81 1.5% White / Caucasian69 2.1% Black or African American45 8.0% Asian538 16.6% Other race33 0.9% Two or more races52 2.9% White alone, not Hispanic / Latino446 4.8% Hispanic or LatinoMoved within same state 547 10.1% White / Caucasian167 5.1% Black or African American29 5.2% Asian44 100.0% Native Hawaiian / Pacific Islander107 3.3% Other race107 2.8% Two or more races521 28.8% White alone, not Hispanic / Latino207 2.2% Hispanic or LatinoMoved from different state 40 0.7% White / Caucasian24 4.2% Asian230 5.9% Two or more races26 1.5% White alone, not Hispanic / Latino182 2.0% Hispanic or LatinoMoved from abroad 80 1.5% White86 2.2% Two or more races153 1.6% Hispanic or Latino
Children Nativity (place of birth) in Manor
Children under 6 years - Living with two parents Both parents native 876 100.0% NativeBoth parents foreign-born 298 100.0% NativeOne native, one foreign-born parent 599 100.0% NativeChildren under 6 years - Living with one parent Native parent 247 100.0% NativeForeign-born parent 58 100.0% NativeChildren 6 to 17 years - Living with two parents Both parents native 628 100.0% NativeBoth parents foreign-born 764 83.4% Native152 16.6% Foreign-bornOne native, one foreign-born parent 778 100.0% NativeChildren 6 to 17 years - Living with one parent Native parent 648 100.0% NativeForeign-born parent 271 56.0% Native213 44.0% Foreign-born
Grandparents responsible for own grandchildren in Manor
Grandparents (30 to 59 years) White / Caucasian 5 100.0% Responsible for grandchildrenBlack or African American 35 47.7% Responsible for grandchildren39 52.3% Not responsible for grandchildrenTwo or more races 183 100.0% Not responsible for grandchildrenHispanic or Latino 8 9.4% Responsible for grandchildren73 90.6% Not responsible for grandchildrenGrandparents (60 years and over) White / Caucasian 5 39.5% Responsible for grandchildren7 60.5% Not responsible for grandchildrenBlack or African American 30 100.0% Responsible for grandchildrenTwo or more races 44 51.5% Responsible for grandchildren41 48.5% Not responsible for grandchildrenHispanic or Latino 54 22.7% Responsible for grandchildren183 77.3% Not responsible for grandchildren