Races in Lovington, New Mexico (NM) Detailed Stats
Data:
Races - White alone (%)
Races - White alone (% change since 2000)
Races - Black alone (%)
Races - Black alone (% change since 2000)
Races - American Indian alone (%)
Races - American Indian alone (% change since 2000)
Races - Asian alone (%)
Races - Asian alone (% change since 2000)
Races - Hispanic (%)
Races - Hispanic (% change since 2000)
Races - Native Hawaiian and Other Pacific Islander alone (%)
Races - Native Hawaiian and Other Pacific Islander alone (% change since 2000)
Races - Two or more races(%)
Races - Two or more races(% change since 2000)
Races - Other race alone (%)
Races - Other race alone (% change since 2000)
Racial diversity
Place of birth - Born in state of residence (%)
Place of birth - Born in state of residence (%) - White
Place of birth - Born in state of residence (%) - Black or African American
Place of birth - Born in state of residence (%) - Asian
Place of birth - Born in state of residence (%) - Hispanic or Latino
Place of birth - Born in state of residence (%) - American Indian and Alaska Native
Place of birth - Born in state of residence (%) - Multirace
Place of birth - Born in state of residence (%) - Other Race
Place of birth - Born in other state (%)
Place of birth - Born in other state (%) - White
Place of birth - Born in other state (%) - Black or African American
Place of birth - Born in other state (%) - Asian
Place of birth - Born in other state (%) - Hispanic or Latino
Place of birth - Born in other state (%) - American Indian and Alaska Native
Place of birth - Born in other state (%) - Multirace
Place of birth - Born in other state (%) - Other Race
Place of birth - Native, outside of US (%)
Place of birth - Native, outside of US (%) - White
Place of birth - Native, outside of US (%) - Black or African American
Place of birth - Native, outside of US (%) - Asian
Place of birth - Native, outside of US (%) - Hispanic or Latino
Place of birth - Native, outside of US (%) - American Indian and Alaska Native
Place of birth - Native, outside of US (%) - Multirace
Place of birth - Native, outside of US (%) - Other Race
Place of birth - Foreign born (%)
Place of birth - Foreign born (%) - White
Place of birth - Foreign born (%) - Black or African American
Place of birth - Foreign born (%) - Asian
Place of birth - Foreign born (%) - Hispanic or Latino
Place of birth - Foreign born (%) - American Indian and Alaska Native
Place of birth - Foreign born (%) - Multirace
Place of birth - Foreign born (%) - Other Race
Residents speaking English at home (%)
Residents speaking English at home - Born in the United States (%)
Residents speaking English at home - Native, born elsewhere (%)
Residents speaking English at home - Foreign born (%)
Residents speaking Spanish at home (%)
Residents speaking Spanish at home - Born in the United States (%)
Residents speaking Spanish at home - Native, born elsewhere (%)
Residents speaking Spanish at home - Foreign born (%)
Residents speaking other language at home (%)
Residents speaking other language at home - Born in the United States (%)
Residents speaking other language at home - Native, born elsewhere (%)
Residents speaking other language at home - Foreign born (%)
Marital status - Never married (%)
Marital status - Now married (%)
Marital status - Separated (%)
Marital status - Widowed (%)
Marital status - Divorced (%)
Ancestries Reported - Arab (%)
Ancestries Reported - Czech (%)
Ancestries Reported - Danish (%)
Ancestries Reported - Dutch (%)
Ancestries Reported - English (%)
Ancestries Reported - French (%)
Ancestries Reported - French Canadian (%)
Ancestries Reported - German (%)
Ancestries Reported - Greek (%)
Ancestries Reported - Hungarian (%)
Ancestries Reported - Irish (%)
Ancestries Reported - Italian (%)
Ancestries Reported - Lithuanian (%)
Ancestries Reported - Norwegian (%)
Ancestries Reported - Polish (%)
Ancestries Reported - Portuguese (%)
Ancestries Reported - Russian (%)
Ancestries Reported - Scotch-Irish (%)
Ancestries Reported - Scottish (%)
Ancestries Reported - Slovak (%)
Ancestries Reported - Subsaharan African (%)
Ancestries Reported - Swedish (%)
Ancestries Reported - Swiss (%)
Ancestries Reported - Ukrainian (%)
Ancestries Reported - United States (%)
Ancestries Reported - Welsh (%)
Ancestries Reported - West Indian (%)
Ancestries Reported - Other (%)
Geographical mobility - Same house 1 year ago (%)
Geographical mobility - Same house 1 year ago (%) - White
Geographical mobility - Same house 1 year ago (%) - Black or African American
Geographical mobility - Same house 1 year ago (%) - Asian
Geographical mobility - Same house 1 year ago (%) - Hispanic or Latino
Geographical mobility - Same house 1 year ago (%) - American Indian and Alaska Native
Geographical mobility - Same house 1 year ago (%) - Multirace
Geographical mobility - Same house 1 year ago (%) - Other Race
Geographical mobility - Moved within same county (%)
Geographical mobility - Moved within same county (%) - White
Geographical mobility - Moved within same county (%) - Black or African American
Geographical mobility - Moved within same county (%) - Asian
Geographical mobility - Moved within same county (%) - Hispanic or Latino
Geographical mobility - Moved within same county (%) - American Indian and Alaska Native
Geographical mobility - Moved within same county (%) - Multirace
Geographical mobility - Moved within same county (%) - Other Race
Geographical mobility - Moved from different county within same state (%)
Geographical mobility - Moved from different county within same state (%) - White
Geographical mobility - Moved from different county within same state (%) - Black or African American
Geographical mobility - Moved from different county within same state (%) - Asian
Geographical mobility - Moved from different county within same state (%) - Hispanic or Latino
Geographical mobility - Moved from different county within same state (%) - American Indian and Alaska Native
Geographical mobility - Moved from different county within same state (%) - Multirace
Geographical mobility - Moved from different county within same state (%) - Other Race
Geographical mobility - Moved from different state (%)
Geographical mobility - Moved from different state (%) - White
Geographical mobility - Moved from different state (%) - Black or African American
Geographical mobility - Moved from different state (%) - Asian
Geographical mobility - Moved from different state (%) - Hispanic or Latino
Geographical mobility - Moved from different state (%) - American Indian and Alaska Native
Geographical mobility - Moved from different state (%) - Multirace
Geographical mobility - Moved from different state (%) - Other Race
Geographical mobility - Moved from abroad (%)
Geographical mobility - Moved from abroad (%) - White
Geographical mobility - Moved from abroad (%) - Black or African American
Geographical mobility - Moved from abroad (%) - Asian
Geographical mobility - Moved from abroad (%) - Hispanic or Latino
Geographical mobility - Moved from abroad (%) - American Indian and Alaska Native
Geographical mobility - Moved from abroad (%) - Multirace
Geographical mobility - Moved from abroad (%) - Other Race
Place of birth for the foreign-born population - Ireland (%)
Place of birth for the foreign-born population - Denmark (%)
Place of birth for the foreign-born population - Norway (%)
Place of birth for the foreign-born population - Sweden (%)
Place of birth for the foreign-born population - United Kingdom (%)
Place of birth for the foreign-born population - England (%)
Place of birth for the foreign-born population - Scotland (%)
Place of birth for the foreign-born population - Other Northern Europe (%)
Place of birth for the foreign-born population - Austria (%)
Place of birth for the foreign-born population - Belgium (%)
Place of birth for the foreign-born population - France (%)
Place of birth for the foreign-born population - Germany (%)
Place of birth for the foreign-born population - Netherlands (%)
Place of birth for the foreign-born population - Switzerland (%)
Place of birth for the foreign-born population - Other Western Europe (%)
Place of birth for the foreign-born population - Greece (%)
Place of birth for the foreign-born population - Italy (%)
Place of birth for the foreign-born population - Portugal (%)
Place of birth for the foreign-born population - Spain (%)
Place of birth for the foreign-born population - Other Southern Europe (%)
Place of birth for the foreign-born population - Albania (%)
Place of birth for the foreign-born population - Belarus (%)
Place of birth for the foreign-born population - Bosnia and Herzegovina (%)
Place of birth for the foreign-born population - Bulgaria (%)
Place of birth for the foreign-born population - Croatia (%)
Place of birth for the foreign-born population - Czechoslovakia (%)
Place of birth for the foreign-born population - Hungary (%)
Place of birth for the foreign-born population - Latvia (%)
Place of birth for the foreign-born population - Lithuania (%)
Place of birth for the foreign-born population - North Macedonia (Macedonia) (%)
Place of birth for the foreign-born population - Moldova (%)
Place of birth for the foreign-born population - Poland (%)
Place of birth for the foreign-born population - Romania (%)
Place of birth for the foreign-born population - Russia (%)
Place of birth for the foreign-born population - Serbia (%)
Place of birth for the foreign-born population - Ukraine (%)
Place of birth for the foreign-born population - Other Eastern Europe (%)
Place of birth for the foreign-born population - China (%)
Place of birth for the foreign-born population - Hong Kong (%)
Place of birth for the foreign-born population - Taiwan (%)
Place of birth for the foreign-born population - Japan (%)
Place of birth for the foreign-born population - Korea (%)
Place of birth for the foreign-born population - Other Eastern Asia (%)
Place of birth for the foreign-born population - Afghanistan (%)
Place of birth for the foreign-born population - Bangladesh (%)
Place of birth for the foreign-born population - India (%)
Place of birth for the foreign-born population - Iran (%)
Place of birth for the foreign-born population - Kazakhstan (%)
Place of birth for the foreign-born population - Nepal (%)
Place of birth for the foreign-born population - Pakistan (%)
Place of birth for the foreign-born population - Sri Lanka (%)
Place of birth for the foreign-born population - Uzbekistan (%)
Place of birth for the foreign-born population - Other South Central Asia (%)
Place of birth for the foreign-born population - Burma (%)
Place of birth for the foreign-born population - Cambodia (%)
Place of birth for the foreign-born population - Indonesia (%)
Place of birth for the foreign-born population - Laos (%)
Place of birth for the foreign-born population - Malaysia (%)
Place of birth for the foreign-born population - Philippines (%)
Place of birth for the foreign-born population - Singapore (%)
Place of birth for the foreign-born population - Thailand (%)
Place of birth for the foreign-born population - Vietnam (%)
Place of birth for the foreign-born population - Other South Eastern Asia (%)
Place of birth for the foreign-born population - Armenia (%)
Place of birth for the foreign-born population - Iraq (%)
Place of birth for the foreign-born population - Israel (%)
Place of birth for the foreign-born population - Jordan (%)
Place of birth for the foreign-born population - Kuwait (%)
Place of birth for the foreign-born population - Lebanon (%)
Place of birth for the foreign-born population - Saudi Arabia (%)
Place of birth for the foreign-born population - Syria (%)
Place of birth for the foreign-born population - Turkey (%)
Place of birth for the foreign-born population - Yemen (%)
Place of birth for the foreign-born population - Other Western Asia (%)
Place of birth for the foreign-born population - Eritrea (%)
Place of birth for the foreign-born population - Ethiopia (%)
Place of birth for the foreign-born population - Kenya (%)
Place of birth for the foreign-born population - Somalia (%)
Place of birth for the foreign-born population - Uganda (%)
Place of birth for the foreign-born population - Zimbabwe (%)
Place of birth for the foreign-born population - Other Eastern Africa (%)
Place of birth for the foreign-born population - Cameroon (%)
Place of birth for the foreign-born population - Congo (%)
Place of birth for the foreign-born population - Democratic Republic of Congo (Zaire) (%)
Place of birth for the foreign-born population - Other Middle Africa (%)
Place of birth for the foreign-born population - Egypt (%)
Place of birth for the foreign-born population - Morocco (%)
Place of birth for the foreign-born population - Sudan (%)
Place of birth for the foreign-born population - Other Northern Africa (%)
Place of birth for the foreign-born population - South Africa (%)
Place of birth for the foreign-born population - Other Southern Africa (%)
Place of birth for the foreign-born population - Cabo Verde (%)
Place of birth for the foreign-born population - Ghana (%)
Place of birth for the foreign-born population - Liberia (%)
Place of birth for the foreign-born population - Nigeria (%)
Place of birth for the foreign-born population - Senegal (%)
Place of birth for the foreign-born population - Sierra Leone (%)
Place of birth for the foreign-born population - Other Western Africa (%)
Place of birth for the foreign-born population - Australia (%)
Place of birth for the foreign-born population - New Zealand (%)
Place of birth for the foreign-born population - Fiji (%)
Place of birth for the foreign-born population - Micronesia (%)
Place of birth for the foreign-born population - Bahamas (%)
Place of birth for the foreign-born population - Barbados (%)
Place of birth for the foreign-born population - Cuba (%)
Place of birth for the foreign-born population - Dominica (%)
Place of birth for the foreign-born population - Dominican Republic (%)
Place of birth for the foreign-born population - Grenada (%)
Place of birth for the foreign-born population - Haiti (%)
Place of birth for the foreign-born population - Jamaica (%)
Place of birth for the foreign-born population - St. Vincent and the Grenadines (%)
Place of birth for the foreign-born population - Trinidad and Tobago (%)
Place of birth for the foreign-born population - West Indies (%)
Place of birth for the foreign-born population - Other Caribbean (%)
Place of birth for the foreign-born population - Belize (%)
Place of birth for the foreign-born population - Costa Rica (%)
Place of birth for the foreign-born population - El Salvador (%)
Place of birth for the foreign-born population - Guatemala (%)
Place of birth for the foreign-born population - Honduras (%)
Place of birth for the foreign-born population - Mexico (%)
Place of birth for the foreign-born population - Nicaragua (%)
Place of birth for the foreign-born population - Panama (%)
Place of birth for the foreign-born population - Other Central America (%)
Place of birth for the foreign-born population - Argentina (%)
Place of birth for the foreign-born population - Bolivia (%)
Place of birth for the foreign-born population - Brazil (%)
Place of birth for the foreign-born population - Chile (%)
Place of birth for the foreign-born population - Colombia (%)
Place of birth for the foreign-born population - Ecuador (%)
Place of birth for the foreign-born population - Guyana (%)
Place of birth for the foreign-born population - Peru (%)
Place of birth for the foreign-born population - Uruguay (%)
Place of birth for the foreign-born population - Venezuela (%)
Place of birth for the foreign-born population - Other South America (%)
Place of birth for the foreign-born population - Canada (%)
Place of birth for the foreign-born population - Other Northern America (%)
Place of birth for the foreign-born population - Other (%)
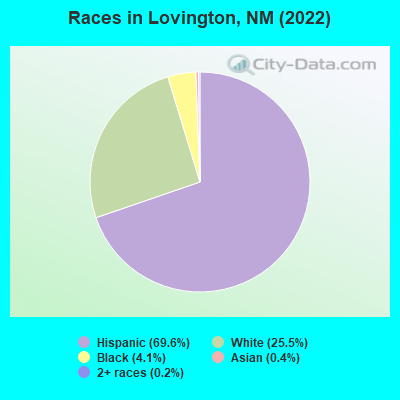
According to 2022 data, the most numerous races in Lovington, NM are Hispanic (7,999 residents), White alone (2,928 residents), and American Indian alone (5 residents). 43.6% of Lovington residents speak English at home. 19.3% of Lovington, NM residents are foreign-born (18.5% born in Latin America), which is 53.4% greater than the foreign-born rate of 9.0% across the entire state of New Mexico.
Race distribution in Lovington
2000 2022
813,495 44.7% White alone 765,386 42.1% Hispanic 161,460 8.9% American Indian alone 30,654 1.7% Black alone 25,793 1.4% Two or more races 18,257 1.0% Asian alone 3,009 0.2% Other race alone 992 0.05% Native Hawaiian and Other
1,059,867 50.2% Hispanic 735,478 34.8% White alone 171,808 8.1% American Indian alone 65,084 3.1% Two or more races 36,870 1.7% Black alone 35,870 1.7% Asian alone 7,582 0.4% Other race alone 785 0.04% Native Hawaiian and Other
Income and house value in Lovington Median household income in 2022 $88,086 White non-Hispanic householders$92,366 Black householders$43,787 Some other race householders$59,711 Two or more races householders$55,499 Hispanic or Latino race householdersMedian 2022 house value $198,589 White Non-Hispanic householders$179,818 Black or African American householders$129,139 American Indian or Alaska Native householders $206,472 Asian householders$140,776 Some other race householders$210,226 Two or more races householders$141,903 Hispanic or Latino householders
Median age by race in Lovington
38.7 Median age for White residents38.3 41.0 42.5 Median age for Black or African American residents40.9 58.3 -590,673,574.5 Median age for American Indian / Alaska Native residents-546,318,289.2 -676,413,254.7 11.9 Median age for Asian residents17.1 11.4 -666,666,666.0 Median age for Native Hawaiian / Pacific Islander residents-666,666,666.0 -666,666,666.0 24.1 Median age for Other race residents21.5 39.0 27.1 Median age for Two or more races residents30.4 25.2 40.0 Median age for White alone residents37.5 41.4 27.1 Median age for Hispanic or Latino residents26.4 27.5
Owner/renter occupied households by race in Lovington
House owners and renters - White residents 1,617 80.5% Owner occupied393 19.5% Renter occupiedHouse owners and renters - Black or African American residents 54 85.7% Owner occupied9 14.3% Renter occupiedHouse owners and renters - Asian residents 6 69.9% Owner occupied3 30.1% Renter occupiedHouse owners and renters - Other race residents 398 68.5% Owner occupied183 31.5% Renter occupiedHouse owners and renters - Two or more races residents 726 68.8% Owner occupied329 31.2% Renter occupiedHouse owners and renters - White alone residents 1,140 85.7% Owner occupied190 14.3% Renter occupiedHouse owners and renters - Hispanic or Latino residents 1,652 70.2% Owner occupied703 29.8% Renter occupied
Language usage in Lovington
English speakers - Total 43.6% of residents of Lovington speak English at home.
56.3% of residents speak Spanish at home 3,727 63.6% Speak English very well2,137 36.4% Speak English less than very well1.3% of residents speak other language at home 127 94.8% Speak English very well7 5.2% Speak English less than very well
English speakers - Born in the United States 47.1% of residents of Lovington speak English at home.
58.4% of residents speak Spanish at home 1,175 76.6% Speak English very well358 23.4% Speak English less than very well1.9% of residents speak other language at home 50 100.0% Speak English very well
English speakers - Native, born elsewhere 0.0% of residents of Lovington speak English at home.
173.7% of residents speak Spanish at home 2 6.1% Speak English very well31 93.9% Speak English less than very well
English speakers - Foreign-born 4.1% of residents of Lovington speak English at home.
87.5% of residents speak Spanish at home 567 28.0% Speak English very well1,456 72.0% Speak English less than very well0.9% of residents speak other language at home 14 66.7% Speak English very well7 33.3% Speak English less than very well
White (Caucasian) - Speak only English Native:
72.0% (3,057)Foreign-born:
20.6% (82)
White (Caucasian) - Speak another language Native:
23.5% (999)Foreign-born:
100.0% (400)
Asian - Speak another language Native:
97.7% (25)Foreign-born:
98.1% (20)
Other race - Speak only English Native:
30.4% (316)Foreign-born:
6.8% (20)
Other race - Speak another language Native:
66.5% (693)Foreign-born:
90.3% (260)
Two or more races - Speak another language Native:
66.5% (1,558)Foreign-born:
98.0% (1,556)
White alone - Speak only English Native:
97.0% (2,684)Foreign-born:
97.9% (14)
White alone - Speak another language Native:
3.1% (85)Foreign-born:
6.8% (1)
Hispanic or Latino - Speak only English Native:
29.7% (1,531)Foreign-born:
4.5% (97)
Hispanic or Latino - Speak another language Native:
73.3% (3,786)Foreign-born:
95.6% (2,075)
Foreign-born residents in Lovington 2,199 residents are foreign born (18.5% Latin America ).
This city:
19.3%New Mexico:
9.2%
Marital status for residents in Lovington Marital status - White (Caucasian) population 15 years and over
Males 41.6% Never married48.4% Now married1.7% Separated2.4% Widowed5.9% DivorcedFemales 27.6% Never married48.1% Now married5.5% Separated9.3% Widowed9.5% DivorcedWomen who gave birth in the past 12 months Now married:
82.9% (43)Unmarried:
17.1% (9)
Women who did not give birth in the past 12 months Now married:
51.4% (564)Unmarried:
48.6% (534)
Marital status - Black or African American population 15 years and over
Males 20.3% Never married63.0% Now married0.0% Separated0.0% Widowed16.7% DivorcedFemales 29.6% Never married44.4% Now married26.0% Separated0.0% Widowed0.0% DivorcedWomen who did not give birth in the past 12 months Now married:
64.8% (91)Unmarried:
35.2% (49)
Marital status - American Indian / Alaska Native population 15 years and over
Males 100.0% Never married0.0% Now married0.0% Separated0.0% Widowed0.0% DivorcedFemales 0.0% Never married100.0% Now married0.0% Separated0.0% Widowed0.0% DivorcedMarital status - Asian population 15 years and over
Males 36.4% Never married63.6% Now married0.0% Separated0.0% Widowed0.0% DivorcedFemales 0.0% Never married100.0% Now married0.0% Separated0.0% Widowed0.0% DivorcedWomen who did not give birth in the past 12 months Now married:
100.0% (6)Unmarried:
0.0% (0)
Marital status - Other race population 15 years and over
Males 50.4% Never married46.3% Now married0.0% Separated0.0% Widowed3.3% DivorcedFemales 19.0% Never married42.4% Now married10.2% Separated5.3% Widowed23.1% DivorcedWomen who gave birth in the past 12 months Now married:
82.8% (35)Unmarried:
17.2% (7)
Women who did not give birth in the past 12 months Now married:
36.7% (116)Unmarried:
63.3% (200)
Marital status - Two or more races population 15 years and over
Males 17.2% Never married62.9% Now married2.1% Separated6.3% Widowed11.5% DivorcedFemales 38.3% Never married30.5% Now married8.6% Separated8.6% Widowed14.1% DivorcedWomen who gave birth in the past 12 months Now married:
35.4% (53)Unmarried:
64.6% (97)
Women who did not give birth in the past 12 months Now married:
41.5% (371)Unmarried:
58.5% (523)
Marital status - White alone, not Hispanic / Latino population 15 years and over
Males 47.1% Never married39.8% Now married0.0% Separated4.7% Widowed8.4% DivorcedFemales 7.6% Never married57.9% Now married2.6% Separated18.1% Widowed13.8% DivorcedWomen who gave birth in the past 12 months Now married:
100.0% (15)Unmarried:
0.0% (0)
Women who did not give birth in the past 12 months Now married:
75.5% (351)Unmarried:
24.5% (113)
Marital status - Hispanic or Latino population 15 years and over
Males 33.9% Never married55.5% Now married2.3% Separated2.2% Widowed6.1% DivorcedFemales 38.0% Never married38.1% Now married8.3% Separated4.8% Widowed10.8% DivorcedWomen who gave birth in the past 12 months Now married:
59.3% (108)Unmarried:
40.7% (74)
Women who did not give birth in the past 12 months Now married:
41.2% (811)Unmarried:
58.8% (1,157)
Ancestries in Lovington
591 6.5% American170 1.9% English122 1.3% Irish62 0.7% British61 0.7% Swiss42 0.5% German28 0.3% Scotch-Irish25 0.3% Swedish16 0.2% African13 0.1% European
Geographical mobility in Lovington Same house 1 year ago 5,134 87.4% White (Caucasian)379 93.6% Black or African American3 33.2% American Indian / Alaska Native43 83.3% Asian1,185 85.4% Other race3,101 73.8% Two or more races2,600 89.1% White alone, not Hispanic / Latino6,351 79.3% Hispanic or LatinoMoved within same county 391 6.6% White / Caucasian17 4.3% Black or African American5 10.3% Asian106 7.6% Other race625 14.9% Two or more races203 7.0% White alone, not Hispanic / Latino1,495 18.7% Hispanic or LatinoMoved within same state 139 2.4% White / Caucasian10 2.4% Black or African American7 80.5% American Indian / Alaska Native71 5.1% Other race16 0.4% Two or more races19 0.6% White alone, not Hispanic / Latino303 3.8% Hispanic or LatinoMoved from different state 168 2.9% White / Caucasian6 1.6% Black or African American5 0.1% Two or more races85 2.9% White alone, not Hispanic / Latino97 1.2% Hispanic or Latino
Children Nativity (place of birth) in Lovington
Children under 6 years - Living with two parents Both parents native 388 100.0% NativeBoth parents foreign-born 93 43.7% Native119 56.3% Foreign-bornOne native, one foreign-born parent 102 100.0% NativeChildren under 6 years - Living with one parent Native parent 385 100.0% NativeForeign-born parent 78 100.0% NativeChildren 6 to 17 years - Living with two parents Both parents native 995 99.9% Native1 0.1% Foreign-bornBoth parents foreign-born 303 82.9% Native62 17.1% Foreign-bornOne native, one foreign-born parent 271 100.0% NativeChildren 6 to 17 years - Living with one parent Native parent 467 100.0% NativeForeign-born parent 269 49.7% Native272 50.3% Foreign-born
Grandparents responsible for own grandchildren in Lovington
Grandparents (30 to 59 years) White / Caucasian 49 72.7% Responsible for grandchildren18 27.3% Not responsible for grandchildrenBlack or African American 77 100.0% Responsible for grandchildrenWhite alone, not Hispanic / Latino 29 100.0% Not responsible for grandchildrenHispanic or Latino 45 100.0% Responsible for grandchildrenGrandparents (60 years and over) White / Caucasian 49 75.7% Responsible for grandchildren16 24.3% Not responsible for grandchildrenWhite alone, not Hispanic / Latino 62 100.0% Responsible for grandchildrenHispanic or Latino 76 56.2% Responsible for grandchildren59 43.8% Not responsible for grandchildren