Races in Libertyville, Illinois (IL) Detailed Stats
Data:
Races - White alone (%)
Races - White alone (% change since 2000)
Races - Black alone (%)
Races - Black alone (% change since 2000)
Races - American Indian alone (%)
Races - American Indian alone (% change since 2000)
Races - Asian alone (%)
Races - Asian alone (% change since 2000)
Races - Hispanic (%)
Races - Hispanic (% change since 2000)
Races - Native Hawaiian and Other Pacific Islander alone (%)
Races - Native Hawaiian and Other Pacific Islander alone (% change since 2000)
Races - Two or more races(%)
Races - Two or more races(% change since 2000)
Races - Other race alone (%)
Races - Other race alone (% change since 2000)
Racial diversity
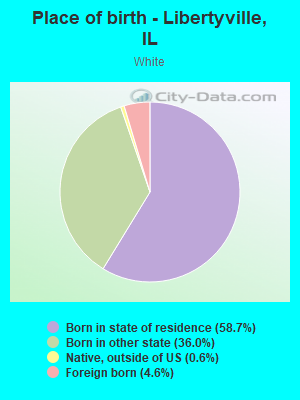
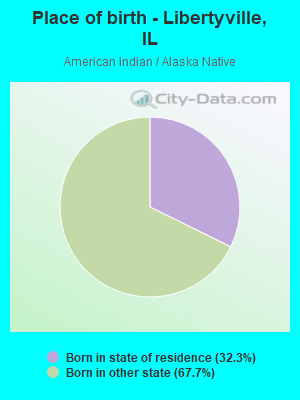
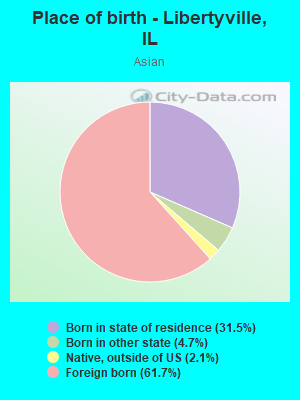
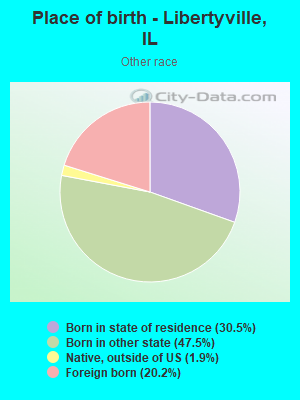
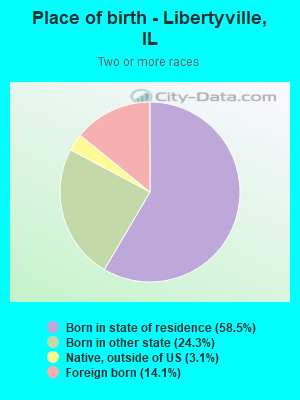
Place of birth - Born in state of residence (%)
Place of birth - Born in state of residence (%) - White
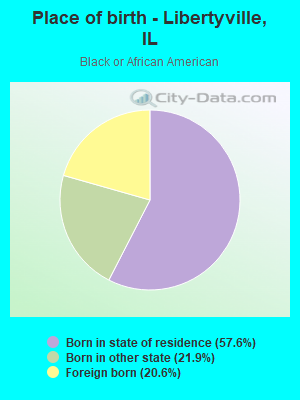
Place of birth - Born in state of residence (%) - Black or African American
Place of birth - Born in state of residence (%) - Asian
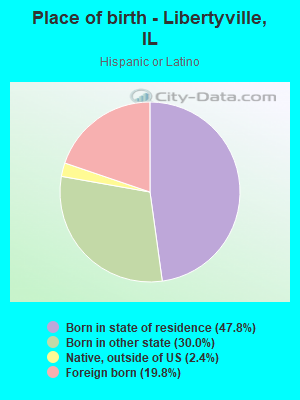
Place of birth - Born in state of residence (%) - Hispanic or Latino
Place of birth - Born in state of residence (%) - American Indian and Alaska Native
Place of birth - Born in state of residence (%) - Multirace
Place of birth - Born in state of residence (%) - Other Race
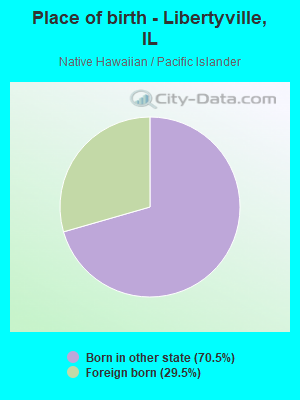
Place of birth - Born in other state (%)
Place of birth - Born in other state (%) - White
Place of birth - Born in other state (%) - Black or African American
Place of birth - Born in other state (%) - Asian
Place of birth - Born in other state (%) - Hispanic or Latino
Place of birth - Born in other state (%) - American Indian and Alaska Native
Place of birth - Born in other state (%) - Multirace
Place of birth - Born in other state (%) - Other Race
Place of birth - Native, outside of US (%)
Place of birth - Native, outside of US (%) - White
Place of birth - Native, outside of US (%) - Black or African American
Place of birth - Native, outside of US (%) - Asian
Place of birth - Native, outside of US (%) - Hispanic or Latino
Place of birth - Native, outside of US (%) - American Indian and Alaska Native
Place of birth - Native, outside of US (%) - Multirace
Place of birth - Native, outside of US (%) - Other Race
Place of birth - Foreign born (%)
Place of birth - Foreign born (%) - White
Place of birth - Foreign born (%) - Black or African American
Place of birth - Foreign born (%) - Asian
Place of birth - Foreign born (%) - Hispanic or Latino
Place of birth - Foreign born (%) - American Indian and Alaska Native
Place of birth - Foreign born (%) - Multirace
Place of birth - Foreign born (%) - Other Race
Residents speaking English at home (%)
Residents speaking English at home - Born in the United States (%)
Residents speaking English at home - Native, born elsewhere (%)
Residents speaking English at home - Foreign born (%)
Residents speaking Spanish at home (%)
Residents speaking Spanish at home - Born in the United States (%)
Residents speaking Spanish at home - Native, born elsewhere (%)
Residents speaking Spanish at home - Foreign born (%)
Residents speaking other language at home (%)
Residents speaking other language at home - Born in the United States (%)
Residents speaking other language at home - Native, born elsewhere (%)
Residents speaking other language at home - Foreign born (%)
Marital status - Never married (%)
Marital status - Now married (%)
Marital status - Separated (%)
Marital status - Widowed (%)
Marital status - Divorced (%)
Ancestries Reported - Arab (%)
Ancestries Reported - Czech (%)
Ancestries Reported - Danish (%)
Ancestries Reported - Dutch (%)
Ancestries Reported - English (%)
Ancestries Reported - French (%)
Ancestries Reported - French Canadian (%)
Ancestries Reported - German (%)
Ancestries Reported - Greek (%)
Ancestries Reported - Hungarian (%)
Ancestries Reported - Irish (%)
Ancestries Reported - Italian (%)
Ancestries Reported - Lithuanian (%)
Ancestries Reported - Norwegian (%)
Ancestries Reported - Polish (%)
Ancestries Reported - Portuguese (%)
Ancestries Reported - Russian (%)
Ancestries Reported - Scotch-Irish (%)
Ancestries Reported - Scottish (%)
Ancestries Reported - Slovak (%)
Ancestries Reported - Subsaharan African (%)
Ancestries Reported - Swedish (%)
Ancestries Reported - Swiss (%)
Ancestries Reported - Ukrainian (%)
Ancestries Reported - United States (%)
Ancestries Reported - Welsh (%)
Ancestries Reported - West Indian (%)
Ancestries Reported - Other (%)
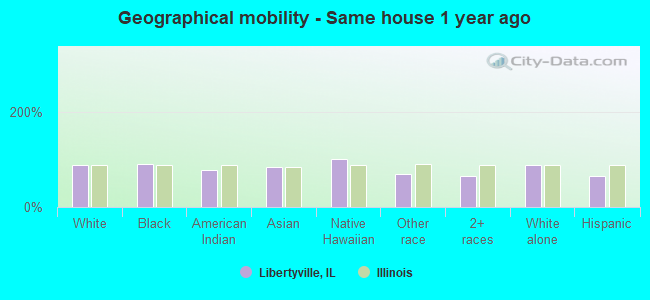
Geographical mobility - Same house 1 year ago (%)
Geographical mobility - Same house 1 year ago (%) - White
Geographical mobility - Same house 1 year ago (%) - Black or African American
Geographical mobility - Same house 1 year ago (%) - Asian
Geographical mobility - Same house 1 year ago (%) - Hispanic or Latino
Geographical mobility - Same house 1 year ago (%) - American Indian and Alaska Native
Geographical mobility - Same house 1 year ago (%) - Multirace
Geographical mobility - Same house 1 year ago (%) - Other Race
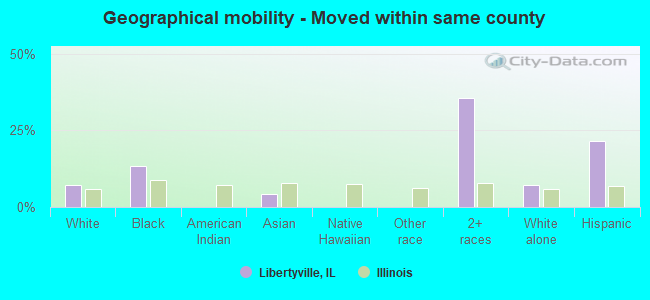
Geographical mobility - Moved within same county (%)
Geographical mobility - Moved within same county (%) - White
Geographical mobility - Moved within same county (%) - Black or African American
Geographical mobility - Moved within same county (%) - Asian
Geographical mobility - Moved within same county (%) - Hispanic or Latino
Geographical mobility - Moved within same county (%) - American Indian and Alaska Native
Geographical mobility - Moved within same county (%) - Multirace
Geographical mobility - Moved within same county (%) - Other Race
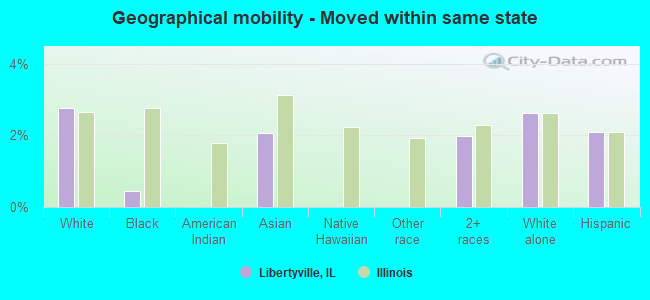
Geographical mobility - Moved from different county within same state (%)
Geographical mobility - Moved from different county within same state (%) - White
Geographical mobility - Moved from different county within same state (%) - Black or African American
Geographical mobility - Moved from different county within same state (%) - Asian
Geographical mobility - Moved from different county within same state (%) - Hispanic or Latino
Geographical mobility - Moved from different county within same state (%) - American Indian and Alaska Native
Geographical mobility - Moved from different county within same state (%) - Multirace
Geographical mobility - Moved from different county within same state (%) - Other Race
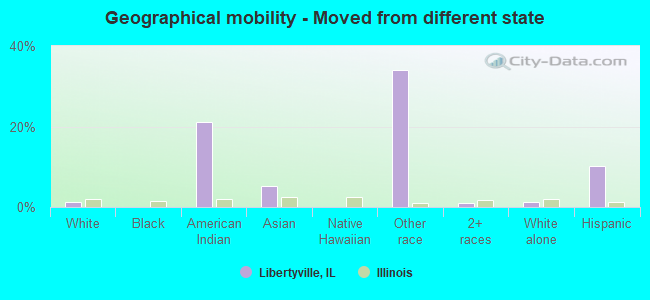
Geographical mobility - Moved from different state (%)
Geographical mobility - Moved from different state (%) - White
Geographical mobility - Moved from different state (%) - Black or African American
Geographical mobility - Moved from different state (%) - Asian
Geographical mobility - Moved from different state (%) - Hispanic or Latino
Geographical mobility - Moved from different state (%) - American Indian and Alaska Native
Geographical mobility - Moved from different state (%) - Multirace
Geographical mobility - Moved from different state (%) - Other Race
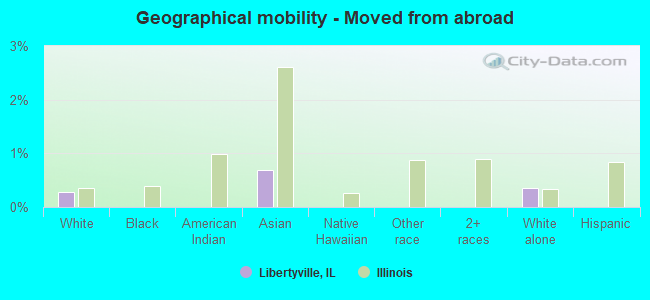
Geographical mobility - Moved from abroad (%)
Geographical mobility - Moved from abroad (%) - White
Geographical mobility - Moved from abroad (%) - Black or African American
Geographical mobility - Moved from abroad (%) - Asian
Geographical mobility - Moved from abroad (%) - Hispanic or Latino
Geographical mobility - Moved from abroad (%) - American Indian and Alaska Native
Geographical mobility - Moved from abroad (%) - Multirace
Geographical mobility - Moved from abroad (%) - Other Race
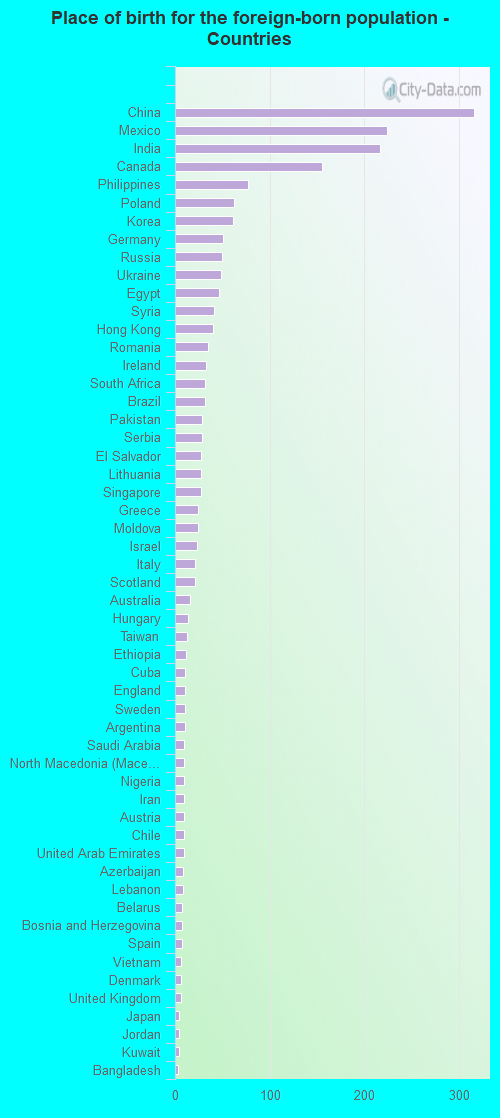
Place of birth for the foreign-born population - Ireland (%)
Place of birth for the foreign-born population - Denmark (%)
Place of birth for the foreign-born population - Norway (%)
Place of birth for the foreign-born population - Sweden (%)
Place of birth for the foreign-born population - United Kingdom (%)
Place of birth for the foreign-born population - England (%)
Place of birth for the foreign-born population - Scotland (%)
Place of birth for the foreign-born population - Other Northern Europe (%)
Place of birth for the foreign-born population - Austria (%)
Place of birth for the foreign-born population - Belgium (%)
Place of birth for the foreign-born population - France (%)
Place of birth for the foreign-born population - Germany (%)
Place of birth for the foreign-born population - Netherlands (%)
Place of birth for the foreign-born population - Switzerland (%)
Place of birth for the foreign-born population - Other Western Europe (%)
Place of birth for the foreign-born population - Greece (%)
Place of birth for the foreign-born population - Italy (%)
Place of birth for the foreign-born population - Portugal (%)
Place of birth for the foreign-born population - Spain (%)
Place of birth for the foreign-born population - Other Southern Europe (%)
Place of birth for the foreign-born population - Albania (%)
Place of birth for the foreign-born population - Belarus (%)
Place of birth for the foreign-born population - Bosnia and Herzegovina (%)
Place of birth for the foreign-born population - Bulgaria (%)
Place of birth for the foreign-born population - Croatia (%)
Place of birth for the foreign-born population - Czechoslovakia (%)
Place of birth for the foreign-born population - Hungary (%)
Place of birth for the foreign-born population - Latvia (%)
Place of birth for the foreign-born population - Lithuania (%)
Place of birth for the foreign-born population - North Macedonia (Macedonia) (%)
Place of birth for the foreign-born population - Moldova (%)
Place of birth for the foreign-born population - Poland (%)
Place of birth for the foreign-born population - Romania (%)
Place of birth for the foreign-born population - Russia (%)
Place of birth for the foreign-born population - Serbia (%)
Place of birth for the foreign-born population - Ukraine (%)
Place of birth for the foreign-born population - Other Eastern Europe (%)
Place of birth for the foreign-born population - China (%)
Place of birth for the foreign-born population - Hong Kong (%)
Place of birth for the foreign-born population - Taiwan (%)
Place of birth for the foreign-born population - Japan (%)
Place of birth for the foreign-born population - Korea (%)
Place of birth for the foreign-born population - Other Eastern Asia (%)
Place of birth for the foreign-born population - Afghanistan (%)
Place of birth for the foreign-born population - Bangladesh (%)
Place of birth for the foreign-born population - India (%)
Place of birth for the foreign-born population - Iran (%)
Place of birth for the foreign-born population - Kazakhstan (%)
Place of birth for the foreign-born population - Nepal (%)
Place of birth for the foreign-born population - Pakistan (%)
Place of birth for the foreign-born population - Sri Lanka (%)
Place of birth for the foreign-born population - Uzbekistan (%)
Place of birth for the foreign-born population - Other South Central Asia (%)
Place of birth for the foreign-born population - Burma (%)
Place of birth for the foreign-born population - Cambodia (%)
Place of birth for the foreign-born population - Indonesia (%)
Place of birth for the foreign-born population - Laos (%)
Place of birth for the foreign-born population - Malaysia (%)
Place of birth for the foreign-born population - Philippines (%)
Place of birth for the foreign-born population - Singapore (%)
Place of birth for the foreign-born population - Thailand (%)
Place of birth for the foreign-born population - Vietnam (%)
Place of birth for the foreign-born population - Other South Eastern Asia (%)
Place of birth for the foreign-born population - Armenia (%)
Place of birth for the foreign-born population - Iraq (%)
Place of birth for the foreign-born population - Israel (%)
Place of birth for the foreign-born population - Jordan (%)
Place of birth for the foreign-born population - Kuwait (%)
Place of birth for the foreign-born population - Lebanon (%)
Place of birth for the foreign-born population - Saudi Arabia (%)
Place of birth for the foreign-born population - Syria (%)
Place of birth for the foreign-born population - Turkey (%)
Place of birth for the foreign-born population - Yemen (%)
Place of birth for the foreign-born population - Other Western Asia (%)
Place of birth for the foreign-born population - Eritrea (%)
Place of birth for the foreign-born population - Ethiopia (%)
Place of birth for the foreign-born population - Kenya (%)
Place of birth for the foreign-born population - Somalia (%)
Place of birth for the foreign-born population - Uganda (%)
Place of birth for the foreign-born population - Zimbabwe (%)
Place of birth for the foreign-born population - Other Eastern Africa (%)
Place of birth for the foreign-born population - Cameroon (%)
Place of birth for the foreign-born population - Congo (%)
Place of birth for the foreign-born population - Democratic Republic of Congo (Zaire) (%)
Place of birth for the foreign-born population - Other Middle Africa (%)
Place of birth for the foreign-born population - Egypt (%)
Place of birth for the foreign-born population - Morocco (%)
Place of birth for the foreign-born population - Sudan (%)
Place of birth for the foreign-born population - Other Northern Africa (%)
Place of birth for the foreign-born population - South Africa (%)
Place of birth for the foreign-born population - Other Southern Africa (%)
Place of birth for the foreign-born population - Cabo Verde (%)
Place of birth for the foreign-born population - Ghana (%)
Place of birth for the foreign-born population - Liberia (%)
Place of birth for the foreign-born population - Nigeria (%)
Place of birth for the foreign-born population - Senegal (%)
Place of birth for the foreign-born population - Sierra Leone (%)
Place of birth for the foreign-born population - Other Western Africa (%)
Place of birth for the foreign-born population - Australia (%)
Place of birth for the foreign-born population - New Zealand (%)
Place of birth for the foreign-born population - Fiji (%)
Place of birth for the foreign-born population - Micronesia (%)
Place of birth for the foreign-born population - Bahamas (%)
Place of birth for the foreign-born population - Barbados (%)
Place of birth for the foreign-born population - Cuba (%)
Place of birth for the foreign-born population - Dominica (%)
Place of birth for the foreign-born population - Dominican Republic (%)
Place of birth for the foreign-born population - Grenada (%)
Place of birth for the foreign-born population - Haiti (%)
Place of birth for the foreign-born population - Jamaica (%)
Place of birth for the foreign-born population - St. Vincent and the Grenadines (%)
Place of birth for the foreign-born population - Trinidad and Tobago (%)
Place of birth for the foreign-born population - West Indies (%)
Place of birth for the foreign-born population - Other Caribbean (%)
Place of birth for the foreign-born population - Belize (%)
Place of birth for the foreign-born population - Costa Rica (%)
Place of birth for the foreign-born population - El Salvador (%)
Place of birth for the foreign-born population - Guatemala (%)
Place of birth for the foreign-born population - Honduras (%)
Place of birth for the foreign-born population - Mexico (%)
Place of birth for the foreign-born population - Nicaragua (%)
Place of birth for the foreign-born population - Panama (%)
Place of birth for the foreign-born population - Other Central America (%)
Place of birth for the foreign-born population - Argentina (%)
Place of birth for the foreign-born population - Bolivia (%)
Place of birth for the foreign-born population - Brazil (%)
Place of birth for the foreign-born population - Chile (%)
Place of birth for the foreign-born population - Colombia (%)
Place of birth for the foreign-born population - Ecuador (%)
Place of birth for the foreign-born population - Guyana (%)
Place of birth for the foreign-born population - Peru (%)
Place of birth for the foreign-born population - Uruguay (%)
Place of birth for the foreign-born population - Venezuela (%)
Place of birth for the foreign-born population - Other South America (%)
Place of birth for the foreign-born population - Canada (%)
Place of birth for the foreign-born population - Other Northern America (%)
Place of birth for the foreign-born population - Other (%)
Latest news about races in Libertyville, IL collected exclusively by city-data.com from local newspapers, TV, and radio stations
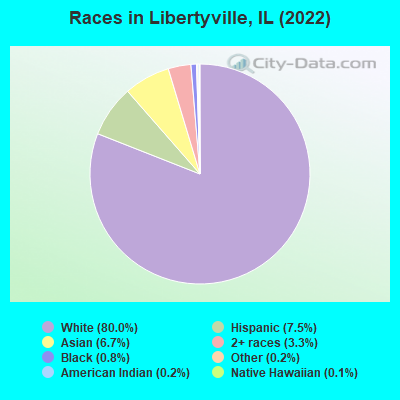
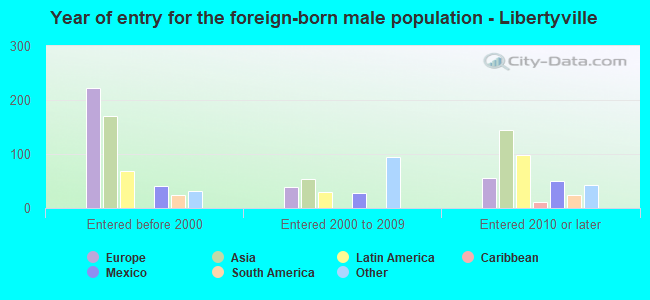
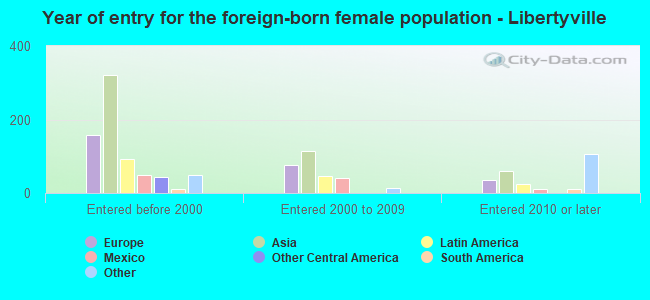
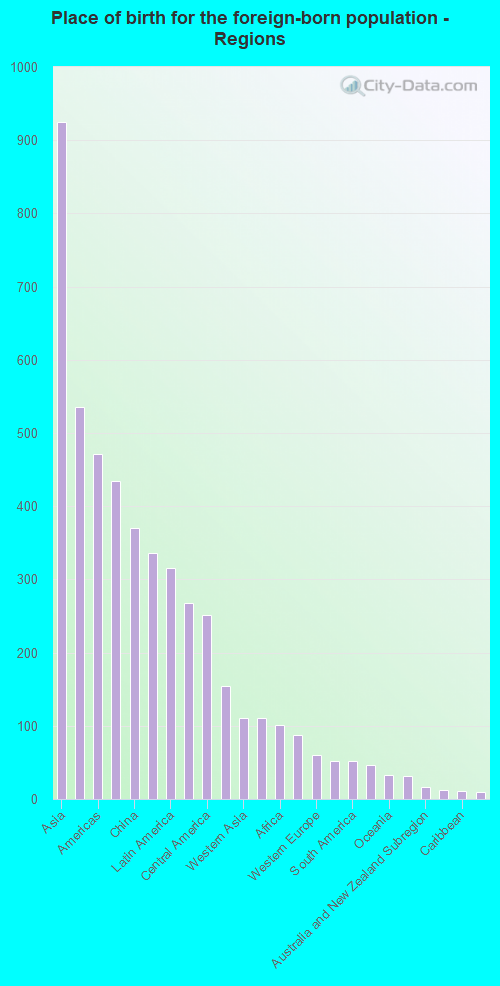
According to 2022 data, the most numerous races in Libertyville, IL are White alone (16,350 residents), Hispanic (1,532 residents), and Black alone (155 residents). 86.7% of Libertyville residents speak English at home. 10.1% of Libertyville, IL residents are foreign-born (4.5% born in Asia, 2.6% born in Europe, 1.5% born in Latin America), which is 38.4% less than the foreign-born rate of 14.0% across the entire state of Illinois.
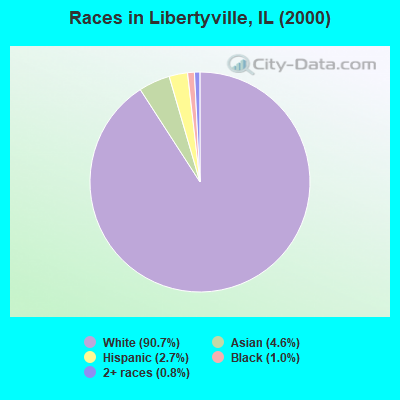
Race distribution in Libertyville
2000 2022
8,424,140 67.8% White alone 1,856,152 14.9% Black alone 1,530,262 12.3% Hispanic 419,916 3.4% Asian alone 153,996 1.2% Two or more races 13,479 0.1% Other race alone 18,232 0.1% American Indian alone 3,116 0.03% Native Hawaiian and Other
7,356,301 58.5% White alone 2,299,726 18.3% Hispanic 1,660,423 13.2% Black alone 747,296 5.9% Asian alone 458,599 3.6% Two or more races 45,386 0.4% Other race alone 10,405 0.08% American Indian alone 3,896 0.03% Native Hawaiian and Other
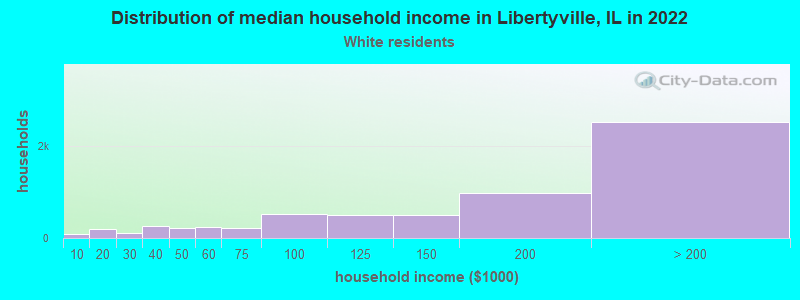
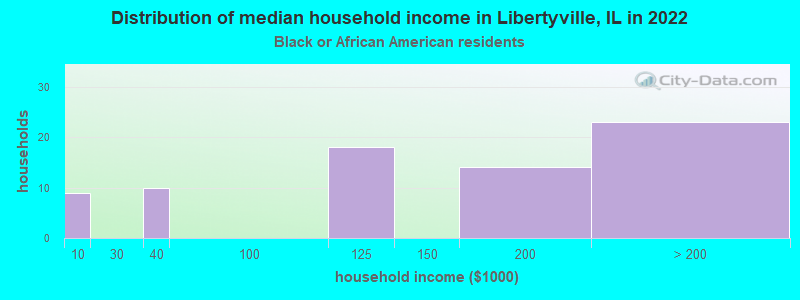
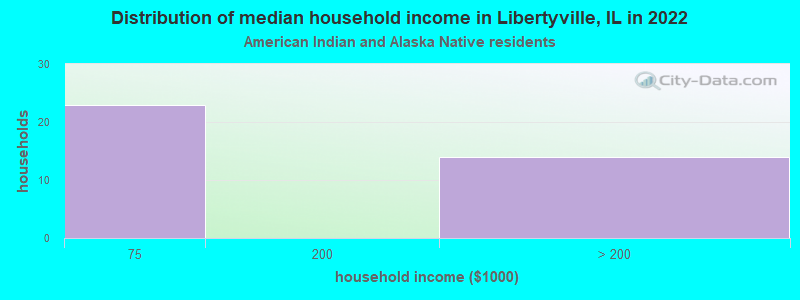
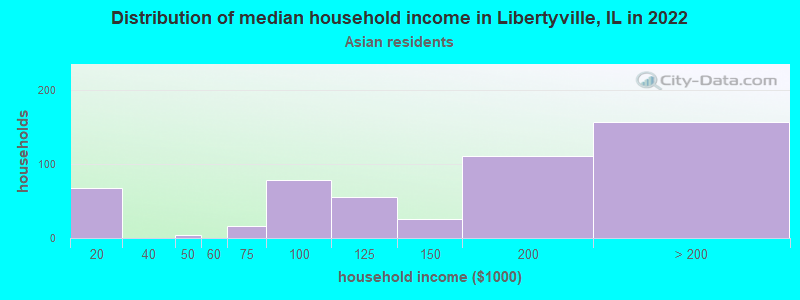
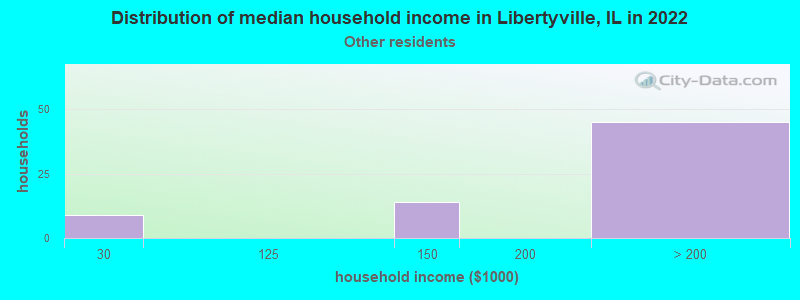
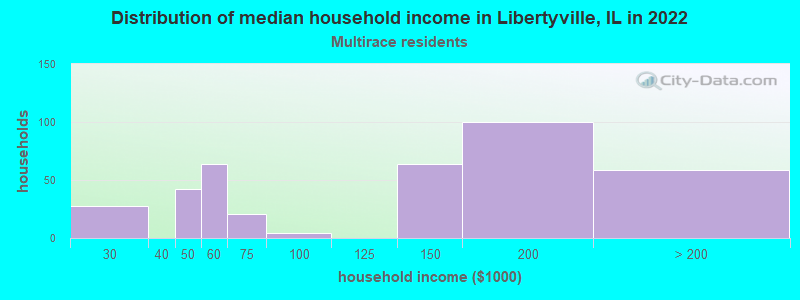
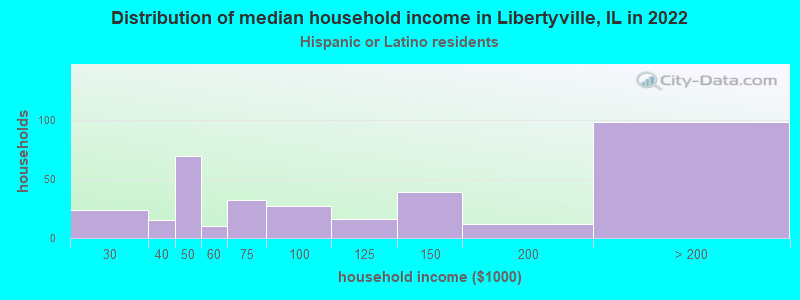
Income and house value in Libertyville Median household income in 2022 $164,022 White non-Hispanic householders$147,551 Black householders$140,024 Asian householders$122,005 Two or more races householders$107,334 Hispanic or Latino race householdersMedian 2022 house value $521,658 White Non-Hispanic householders$222,719 Black or African American householders $544,425 Asian householders$812,679 Some other race householders$538,288 Two or more races householders$420,692 Hispanic or Latino householders
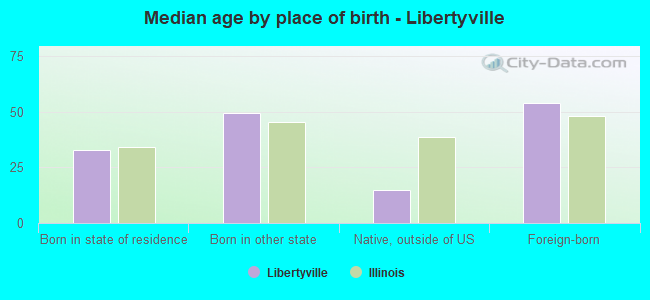
Median age by race in Libertyville
45.9 Median age for White residents47.0 45.2 45.9 Median age for Black or African American residents45.7 39.5 67.3 Median age for American Indian / Alaska Native residents69.0 -638,251,365.5 48.4 Median age for Asian residents37.1 52.3 7.9 Median age for Native Hawaiian / Pacific Islander residents-658,536,584.7 7.3 27.9 Median age for Other race residents27.9 18.7 25.3 Median age for Two or more races residents32.6 8.4 45.1 Median age for White alone residents46.0 44.9 27.4 Median age for Hispanic or Latino residents39.6 16.4
Owner/renter occupied households by race in Libertyville
House owners and renters - White residents 5,308 83.1% Owner occupied1,078 16.9% Renter occupiedHouse owners and renters - Black or African American residents 62 81.1% Owner occupied15 18.9% Renter occupiedHouse owners and renters - American Indian / Alaska Native residents 18 41.7% Owner occupied26 58.3% Renter occupiedHouse owners and renters - Asian residents 419 76.9% Owner occupied126 23.1% Renter occupiedHouse owners and renters - Other race residents 34 46.8% Owner occupied38 53.2% Renter occupiedHouse owners and renters - Two or more races residents 237 60.7% Owner occupied154 39.3% Renter occupiedHouse owners and renters - White alone residents 5,409 83.5% Owner occupied1,069 16.5% Renter occupiedHouse owners and renters - Hispanic or Latino residents 198 56.7% Owner occupied151 43.3% Renter occupied
Language usage in Libertyville
English speakers - Total 86.7% of residents of Libertyville speak English at home.
3.5% of residents speak Spanish at home 416 61.6% Speak English very well259 38.4% Speak English less than very well9.2% of residents speak other language at home 1,295 72.4% Speak English very well494 27.6% Speak English less than very well
English speakers - Born in the United States 95.2% of residents of Libertyville speak English at home.
2.1% of residents speak Spanish at home 123 90.4% Speak English very well13 9.6% Speak English less than very well2.2% of residents speak other language at home 146 100.0% Speak English very well
English speakers - Native, born elsewhere 77.7% of residents of Libertyville speak English at home.
14.0% of residents speak Spanish at home 8 29.6% Speak English very well19 70.4% Speak English less than very well1.0% of residents speak other language at home 2 100.0% Speak English very well
English speakers - Foreign-born 30.6% of residents of Libertyville speak English at home.
13.0% of residents speak Spanish at home 76 27.2% Speak English very well203 72.8% Speak English less than very well57.8% of residents speak other language at home 782 62.9% Speak English very well462 37.1% Speak English less than very well
White (Caucasian) - Speak only English Native:
99.4% (14,399)Foreign-born:
49.2% (361)
White (Caucasian) - Speak another language Native:
2.6% (372)Foreign-born:
58.3% (428)
Black or African American - Speak only English Native:
89.4% (126)Foreign-born:
99.6% (41)
Asian - Speak only English Native:
68.2% (338)Foreign-born:
18.7% (159)
Asian - Speak another language Native:
13.1% (65)Foreign-born:
80.1% (681)
Native Hawaiian / Pacific Islander - Speak only English Native:
100.0% (36)Foreign-born:
79.6% (22)
Other race - Speak only English Native:
95.8% (274)Foreign-born:
26.2% (21)
Other race - Speak another language Native:
16.0% (46)Foreign-born:
80.3% (63)
Two or more races - Speak another language Native:
29.8% (295)Foreign-born:
100.0% (230)
White alone - Speak only English Native:
97.5% (14,387)Foreign-born:
41.5% (357)
White alone - Speak another language Native:
2.6% (383)Foreign-born:
59.2% (510)
Hispanic or Latino - Speak only English Native:
60.8% (575)Foreign-born:
11.2% (34)
Hispanic or Latino - Speak another language Native:
41.1% (388)Foreign-born:
89.9% (276)
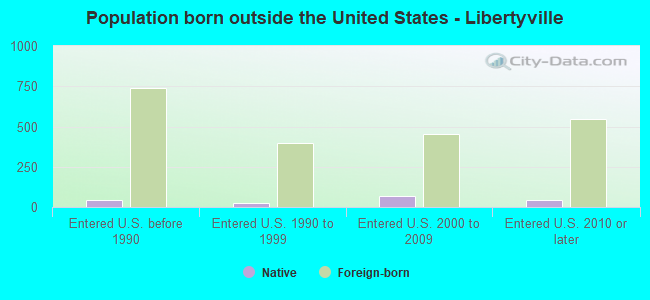
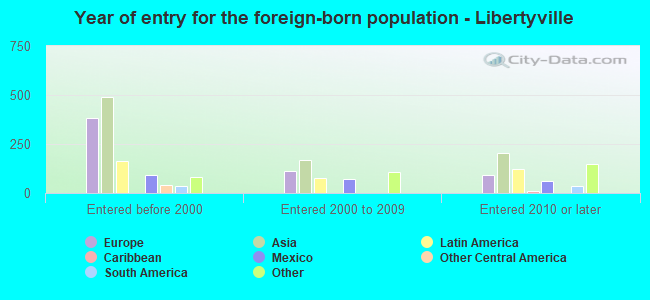
Foreign-born residents in Libertyville 2,068 residents are foreign born (4.5% Asia , 2.6% Europe , 1.5% Latin America ).
This city:
10.1%Illinois:
14.1%
Marital status for residents in Libertyville Marital status - White (Caucasian) population 15 years and over
Males 23.0% Never married68.5% Now married0.5% Separated2.8% Widowed5.2% DivorcedFemales 22.6% Never married60.2% Now married0.5% Separated7.1% Widowed9.5% DivorcedWomen who gave birth in the past 12 months Now married:
85.1% (101)Unmarried:
14.9% (18)
Women who did not give birth in the past 12 months Now married:
54.1% (1,742)Unmarried:
45.9% (1,479)
Marital status - Black or African American population 15 years and over
Males 69.1% Never married28.9% Now married0.0% Separated0.0% Widowed2.1% DivorcedFemales 25.4% Never married16.9% Now married8.5% Separated12.7% Widowed36.6% DivorcedWomen who gave birth in the past 12 months Now married:
0.0% (0)Unmarried:
100.0% (3)
Women who did not give birth in the past 12 months Now married:
0.0% (0)Unmarried:
100.0% (18)
Marital status - American Indian / Alaska Native population 15 years and over
Males 32.7% Never married42.9% Now married0.0% Separated0.0% Widowed24.5% DivorcedFemales 0.0% Never married100.0% Now married0.0% Separated0.0% Widowed0.0% DivorcedMarital status - Asian population 15 years and over
Males 36.2% Never married63.8% Now married0.0% Separated0.0% Widowed0.0% DivorcedFemales 24.7% Never married54.7% Now married0.0% Separated16.1% Widowed4.5% DivorcedWomen who gave birth in the past 12 months Now married:
100.0% (5)Unmarried:
0.0% (0)
Women who did not give birth in the past 12 months Now married:
48.6% (121)Unmarried:
51.4% (128)
Marital status - Other race population 15 years and over
Males 63.1% Never married36.9% Now married0.0% Separated0.0% Widowed0.0% DivorcedFemales 48.2% Never married40.0% Now married0.0% Separated0.0% Widowed11.8% DivorcedWomen who gave birth in the past 12 months Now married:
41.2% (7)Unmarried:
58.8% (10)
Women who did not give birth in the past 12 months Now married:
42.9% (27)Unmarried:
57.1% (36)
Marital status - Two or more races population 15 years and over
Males 34.8% Never married52.5% Now married4.9% Separated7.1% Widowed0.7% DivorcedFemales 28.9% Never married58.9% Now married0.0% Separated0.0% Widowed12.2% DivorcedWomen who did not give birth in the past 12 months Now married:
44.4% (94)Unmarried:
55.6% (117)
Marital status - White alone, not Hispanic / Latino population 15 years and over
Males 22.5% Never married68.9% Now married0.3% Separated2.9% Widowed5.4% DivorcedFemales 21.9% Never married60.9% Now married0.5% Separated6.8% Widowed9.8% DivorcedWomen who gave birth in the past 12 months Now married:
91.9% (108)Unmarried:
8.1% (9)
Women who did not give birth in the past 12 months Now married:
54.8% (1,805)Unmarried:
45.2% (1,489)
Marital status - Hispanic or Latino population 15 years and over
Males 37.0% Never married53.6% Now married2.0% Separated4.9% Widowed2.5% DivorcedFemales 44.2% Never married38.4% Now married0.0% Separated9.0% Widowed8.3% DivorcedWomen who gave birth in the past 12 months Now married:
25.9% (7)Unmarried:
74.1% (21)
Women who did not give birth in the past 12 months Now married:
28.0% (75)Unmarried:
72.0% (193)
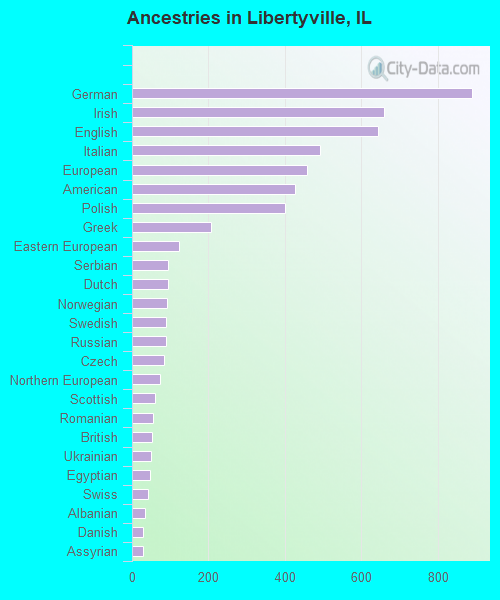
Ancestries in Libertyville
889 11.0% German660 8.2% Irish642 8.0% English492 6.1% Italian458 5.7% European427 5.3% American401 5.0% Polish206 2.6% Greek123 1.5% Eastern European95 1.2% Serbian93 1.2% Dutch92 1.1% Norwegian90 1.1% Swedish89 1.1% Russian84 1.0% Czech74 0.9% Northern European60 0.7% Scottish56 0.7% Romanian51 0.6% British50 0.6% Ukrainian47 0.6% Egyptian41 0.5% Swiss33 0.4% Albanian29 0.4% Danish28 0.3% Assyrian28 0.3% Scotch-Irish28 0.3% Lithuanian25 0.3% Croatian24 0.3% Israeli24 0.3% Scandinavian23 0.3% South African22 0.3% Hungarian22 0.3% Syrian21 0.3% Slovak20 0.2% Welsh19 0.2% Luxembourger18 0.2% Trinidadian and Tobagonian17 0.2% Lebanese16 0.2% Slovene15 0.2% Finnish14 0.2% Australian13 0.2% Armenian13 0.2% Canadian13 0.2% Soviet Union13 0.2% Jamaican12 0.1% Ethiopian11 0.1% Jordanian10 0.1% Nigerian9 0.1% Estonian9 0.1% French Canadian7 0.09% Belgian6 0.07% Slavic
Geographical mobility in Libertyville Same house 1 year ago 13,821 88.1% White (Caucasian)173 90.6% Black or African American68 78.3% American Indian / Alaska Native1,120 82.7% Asian71 100.0% Native Hawaiian / Pacific Islander248 69.7% Other race1,078 64.2% Two or more races14,332 88.0% White alone, not Hispanic / Latino1,002 66.5% Hispanic or LatinoMoved within same county 1,125 7.2% White / Caucasian26 13.5% Black or African American55 4.1% Asian595 35.5% Two or more races1,177 7.2% White alone, not Hispanic / Latino322 21.4% Hispanic or LatinoMoved within same state 433 2.8% White / Caucasian1 0.4% Black or African American28 2.1% Asian33 2.0% Two or more races428 2.6% White alone, not Hispanic / Latino32 2.1% Hispanic or LatinoMoved from different state 209 1.3% White / Caucasian18 21.1% American Indian / Alaska Native72 5.3% Asian121 34.1% Other race16 0.9% Two or more races218 1.3% White alone, not Hispanic / Latino153 10.2% Hispanic or LatinoMoved from abroad 44 0.3% White9 0.7% Asian57 0.4% White alone, not Hispanic / Latino
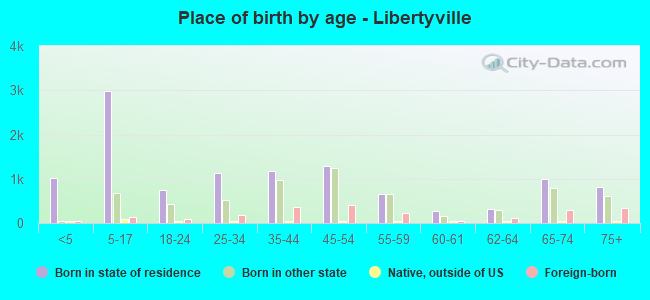
Children Nativity (place of birth) in Libertyville
Children under 6 years - Living with two parents Both parents native 1,011 100.0% NativeBoth parents foreign-born 74 86.2% Native12 13.8% Foreign-bornOne native, one foreign-born parent 50 100.0% NativeChildren under 6 years - Living with one parent Native parent 76 100.0% NativeChildren 6 to 17 years - Living with two parents Both parents native 2,729 99.3% Native19 0.7% Foreign-bornBoth parents foreign-born 244 71.3% Native99 28.7% Foreign-bornOne native, one foreign-born parent 190 100.0% NativeChildren 6 to 17 years - Living with one parent Native parent 476 100.0% NativeForeign-born parent 79 54.6% Native66 45.4% Foreign-born
Grandparents responsible for own grandchildren in Libertyville
Grandparents (30 to 59 years) White / Caucasian 8 100.0% Not responsible for grandchildrenWhite alone, not Hispanic / Latino 8 100.0% Not responsible for grandchildrenGrandparents (60 years and over) White / Caucasian 31 42.3% Responsible for grandchildren42 57.7% Not responsible for grandchildrenWhite alone, not Hispanic / Latino 38 44.6% Responsible for grandchildren47 55.4% Not responsible for grandchildren