Races in Lewiston, Maine (ME) Detailed Stats
Data:
Races - White alone (%)
Races - White alone (% change since 2000)
Races - Black alone (%)
Races - Black alone (% change since 2000)
Races - American Indian alone (%)
Races - American Indian alone (% change since 2000)
Races - Asian alone (%)
Races - Asian alone (% change since 2000)
Races - Hispanic (%)
Races - Hispanic (% change since 2000)
Races - Native Hawaiian and Other Pacific Islander alone (%)
Races - Native Hawaiian and Other Pacific Islander alone (% change since 2000)
Races - Two or more races(%)
Races - Two or more races(% change since 2000)
Races - Other race alone (%)
Races - Other race alone (% change since 2000)
Racial diversity
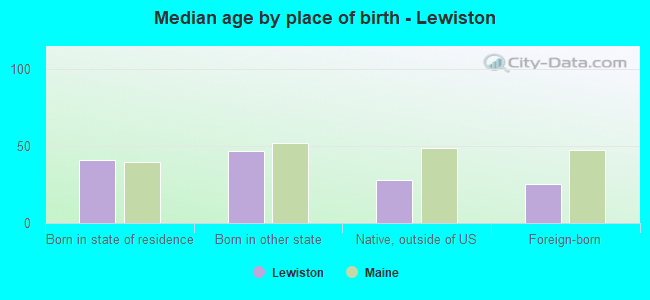
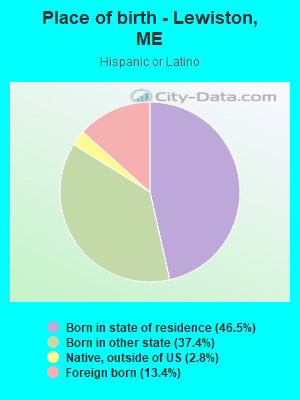
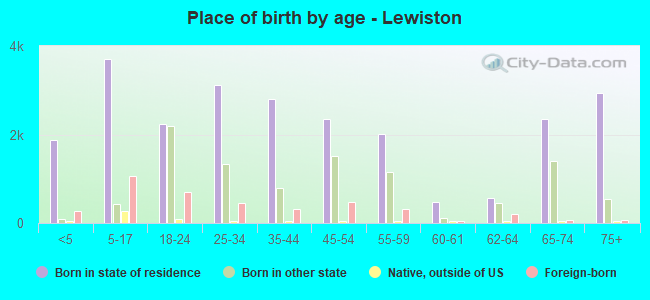
Place of birth - Born in state of residence (%)
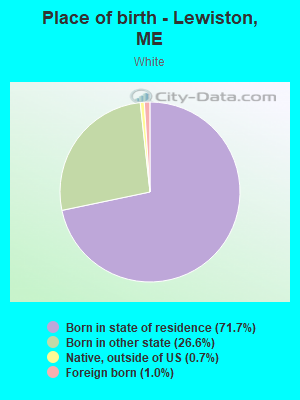
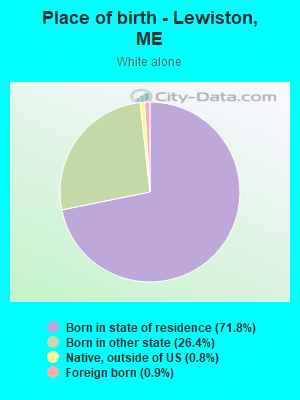
Place of birth - Born in state of residence (%) - White
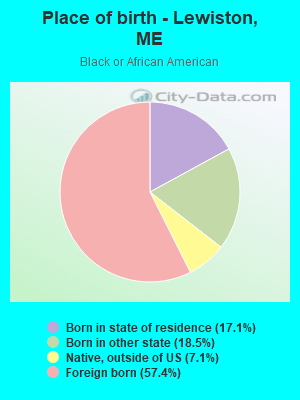
Place of birth - Born in state of residence (%) - Black or African American
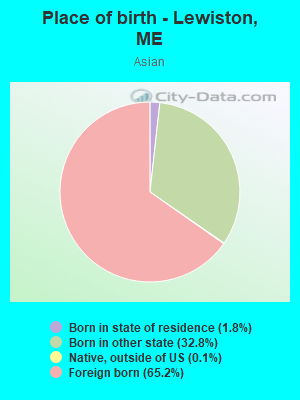
Place of birth - Born in state of residence (%) - Asian
Place of birth - Born in state of residence (%) - Hispanic or Latino
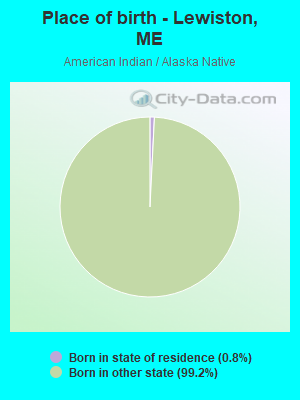
Place of birth - Born in state of residence (%) - American Indian and Alaska Native
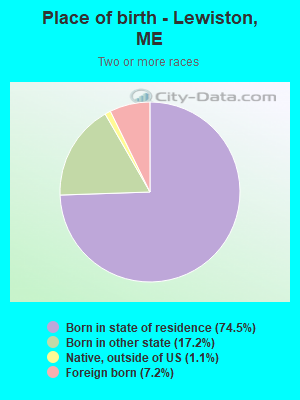
Place of birth - Born in state of residence (%) - Multirace
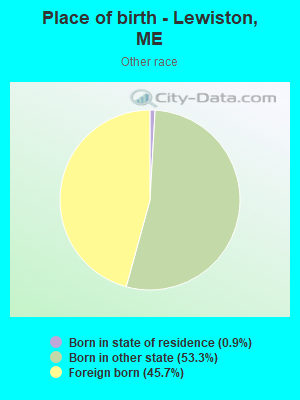
Place of birth - Born in state of residence (%) - Other Race
Place of birth - Born in other state (%)
Place of birth - Born in other state (%) - White
Place of birth - Born in other state (%) - Black or African American
Place of birth - Born in other state (%) - Asian
Place of birth - Born in other state (%) - Hispanic or Latino
Place of birth - Born in other state (%) - American Indian and Alaska Native
Place of birth - Born in other state (%) - Multirace
Place of birth - Born in other state (%) - Other Race
Place of birth - Native, outside of US (%)
Place of birth - Native, outside of US (%) - White
Place of birth - Native, outside of US (%) - Black or African American
Place of birth - Native, outside of US (%) - Asian
Place of birth - Native, outside of US (%) - Hispanic or Latino
Place of birth - Native, outside of US (%) - American Indian and Alaska Native
Place of birth - Native, outside of US (%) - Multirace
Place of birth - Native, outside of US (%) - Other Race
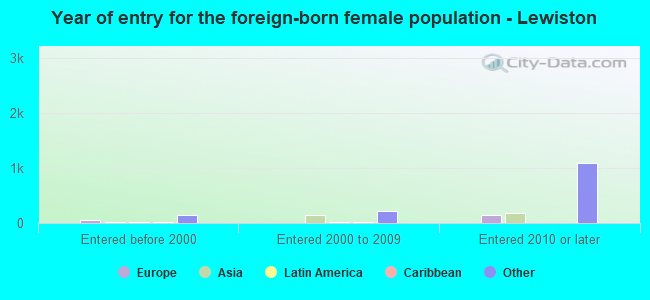
Place of birth - Foreign born (%)
Place of birth - Foreign born (%) - White
Place of birth - Foreign born (%) - Black or African American
Place of birth - Foreign born (%) - Asian
Place of birth - Foreign born (%) - Hispanic or Latino
Place of birth - Foreign born (%) - American Indian and Alaska Native
Place of birth - Foreign born (%) - Multirace
Place of birth - Foreign born (%) - Other Race
Residents speaking English at home (%)
Residents speaking English at home - Born in the United States (%)
Residents speaking English at home - Native, born elsewhere (%)
Residents speaking English at home - Foreign born (%)
Residents speaking Spanish at home (%)
Residents speaking Spanish at home - Born in the United States (%)
Residents speaking Spanish at home - Native, born elsewhere (%)
Residents speaking Spanish at home - Foreign born (%)
Residents speaking other language at home (%)
Residents speaking other language at home - Born in the United States (%)
Residents speaking other language at home - Native, born elsewhere (%)
Residents speaking other language at home - Foreign born (%)
Marital status - Never married (%)
Marital status - Now married (%)
Marital status - Separated (%)
Marital status - Widowed (%)
Marital status - Divorced (%)
Ancestries Reported - Arab (%)
Ancestries Reported - Czech (%)
Ancestries Reported - Danish (%)
Ancestries Reported - Dutch (%)
Ancestries Reported - English (%)
Ancestries Reported - French (%)
Ancestries Reported - French Canadian (%)
Ancestries Reported - German (%)
Ancestries Reported - Greek (%)
Ancestries Reported - Hungarian (%)
Ancestries Reported - Irish (%)
Ancestries Reported - Italian (%)
Ancestries Reported - Lithuanian (%)
Ancestries Reported - Norwegian (%)
Ancestries Reported - Polish (%)
Ancestries Reported - Portuguese (%)
Ancestries Reported - Russian (%)
Ancestries Reported - Scotch-Irish (%)
Ancestries Reported - Scottish (%)
Ancestries Reported - Slovak (%)
Ancestries Reported - Subsaharan African (%)
Ancestries Reported - Swedish (%)
Ancestries Reported - Swiss (%)
Ancestries Reported - Ukrainian (%)
Ancestries Reported - United States (%)
Ancestries Reported - Welsh (%)
Ancestries Reported - West Indian (%)
Ancestries Reported - Other (%)
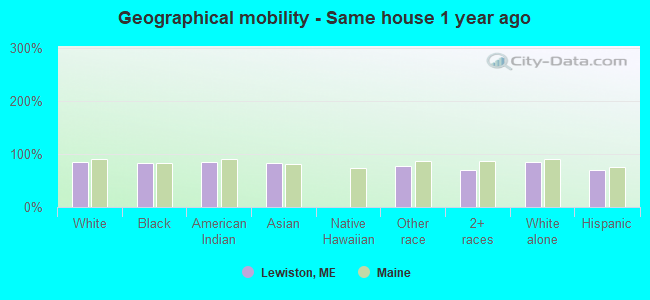
Geographical mobility - Same house 1 year ago (%)
Geographical mobility - Same house 1 year ago (%) - White
Geographical mobility - Same house 1 year ago (%) - Black or African American
Geographical mobility - Same house 1 year ago (%) - Asian
Geographical mobility - Same house 1 year ago (%) - Hispanic or Latino
Geographical mobility - Same house 1 year ago (%) - American Indian and Alaska Native
Geographical mobility - Same house 1 year ago (%) - Multirace
Geographical mobility - Same house 1 year ago (%) - Other Race
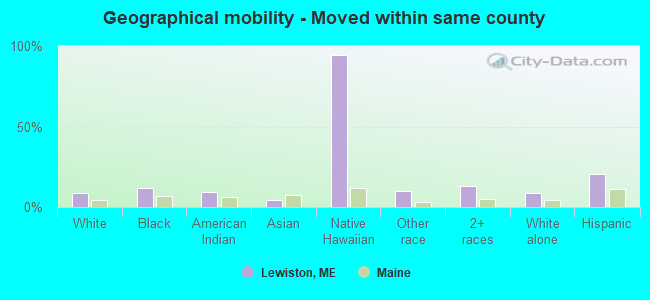
Geographical mobility - Moved within same county (%)
Geographical mobility - Moved within same county (%) - White
Geographical mobility - Moved within same county (%) - Black or African American
Geographical mobility - Moved within same county (%) - Asian
Geographical mobility - Moved within same county (%) - Hispanic or Latino
Geographical mobility - Moved within same county (%) - American Indian and Alaska Native
Geographical mobility - Moved within same county (%) - Multirace
Geographical mobility - Moved within same county (%) - Other Race
Geographical mobility - Moved from different county within same state (%)
Geographical mobility - Moved from different county within same state (%) - White
Geographical mobility - Moved from different county within same state (%) - Black or African American
Geographical mobility - Moved from different county within same state (%) - Asian
Geographical mobility - Moved from different county within same state (%) - Hispanic or Latino
Geographical mobility - Moved from different county within same state (%) - American Indian and Alaska Native
Geographical mobility - Moved from different county within same state (%) - Multirace
Geographical mobility - Moved from different county within same state (%) - Other Race
Geographical mobility - Moved from different state (%)
Geographical mobility - Moved from different state (%) - White
Geographical mobility - Moved from different state (%) - Black or African American
Geographical mobility - Moved from different state (%) - Asian
Geographical mobility - Moved from different state (%) - Hispanic or Latino
Geographical mobility - Moved from different state (%) - American Indian and Alaska Native
Geographical mobility - Moved from different state (%) - Multirace
Geographical mobility - Moved from different state (%) - Other Race
Geographical mobility - Moved from abroad (%)
Geographical mobility - Moved from abroad (%) - White
Geographical mobility - Moved from abroad (%) - Black or African American
Geographical mobility - Moved from abroad (%) - Asian
Geographical mobility - Moved from abroad (%) - Hispanic or Latino
Geographical mobility - Moved from abroad (%) - American Indian and Alaska Native
Geographical mobility - Moved from abroad (%) - Multirace
Geographical mobility - Moved from abroad (%) - Other Race
Place of birth for the foreign-born population - Ireland (%)
Place of birth for the foreign-born population - Denmark (%)
Place of birth for the foreign-born population - Norway (%)
Place of birth for the foreign-born population - Sweden (%)
Place of birth for the foreign-born population - United Kingdom (%)
Place of birth for the foreign-born population - England (%)
Place of birth for the foreign-born population - Scotland (%)
Place of birth for the foreign-born population - Other Northern Europe (%)
Place of birth for the foreign-born population - Austria (%)
Place of birth for the foreign-born population - Belgium (%)
Place of birth for the foreign-born population - France (%)
Place of birth for the foreign-born population - Germany (%)
Place of birth for the foreign-born population - Netherlands (%)
Place of birth for the foreign-born population - Switzerland (%)
Place of birth for the foreign-born population - Other Western Europe (%)
Place of birth for the foreign-born population - Greece (%)
Place of birth for the foreign-born population - Italy (%)
Place of birth for the foreign-born population - Portugal (%)
Place of birth for the foreign-born population - Spain (%)
Place of birth for the foreign-born population - Other Southern Europe (%)
Place of birth for the foreign-born population - Albania (%)
Place of birth for the foreign-born population - Belarus (%)
Place of birth for the foreign-born population - Bosnia and Herzegovina (%)
Place of birth for the foreign-born population - Bulgaria (%)
Place of birth for the foreign-born population - Croatia (%)
Place of birth for the foreign-born population - Czechoslovakia (%)
Place of birth for the foreign-born population - Hungary (%)
Place of birth for the foreign-born population - Latvia (%)
Place of birth for the foreign-born population - Lithuania (%)
Place of birth for the foreign-born population - North Macedonia (Macedonia) (%)
Place of birth for the foreign-born population - Moldova (%)
Place of birth for the foreign-born population - Poland (%)
Place of birth for the foreign-born population - Romania (%)
Place of birth for the foreign-born population - Russia (%)
Place of birth for the foreign-born population - Serbia (%)
Place of birth for the foreign-born population - Ukraine (%)
Place of birth for the foreign-born population - Other Eastern Europe (%)
Place of birth for the foreign-born population - China (%)
Place of birth for the foreign-born population - Hong Kong (%)
Place of birth for the foreign-born population - Taiwan (%)
Place of birth for the foreign-born population - Japan (%)
Place of birth for the foreign-born population - Korea (%)
Place of birth for the foreign-born population - Other Eastern Asia (%)
Place of birth for the foreign-born population - Afghanistan (%)
Place of birth for the foreign-born population - Bangladesh (%)
Place of birth for the foreign-born population - India (%)
Place of birth for the foreign-born population - Iran (%)
Place of birth for the foreign-born population - Kazakhstan (%)
Place of birth for the foreign-born population - Nepal (%)
Place of birth for the foreign-born population - Pakistan (%)
Place of birth for the foreign-born population - Sri Lanka (%)
Place of birth for the foreign-born population - Uzbekistan (%)
Place of birth for the foreign-born population - Other South Central Asia (%)
Place of birth for the foreign-born population - Burma (%)
Place of birth for the foreign-born population - Cambodia (%)
Place of birth for the foreign-born population - Indonesia (%)
Place of birth for the foreign-born population - Laos (%)
Place of birth for the foreign-born population - Malaysia (%)
Place of birth for the foreign-born population - Philippines (%)
Place of birth for the foreign-born population - Singapore (%)
Place of birth for the foreign-born population - Thailand (%)
Place of birth for the foreign-born population - Vietnam (%)
Place of birth for the foreign-born population - Other South Eastern Asia (%)
Place of birth for the foreign-born population - Armenia (%)
Place of birth for the foreign-born population - Iraq (%)
Place of birth for the foreign-born population - Israel (%)
Place of birth for the foreign-born population - Jordan (%)
Place of birth for the foreign-born population - Kuwait (%)
Place of birth for the foreign-born population - Lebanon (%)
Place of birth for the foreign-born population - Saudi Arabia (%)
Place of birth for the foreign-born population - Syria (%)
Place of birth for the foreign-born population - Turkey (%)
Place of birth for the foreign-born population - Yemen (%)
Place of birth for the foreign-born population - Other Western Asia (%)
Place of birth for the foreign-born population - Eritrea (%)
Place of birth for the foreign-born population - Ethiopia (%)
Place of birth for the foreign-born population - Kenya (%)
Place of birth for the foreign-born population - Somalia (%)
Place of birth for the foreign-born population - Uganda (%)
Place of birth for the foreign-born population - Zimbabwe (%)
Place of birth for the foreign-born population - Other Eastern Africa (%)
Place of birth for the foreign-born population - Cameroon (%)
Place of birth for the foreign-born population - Congo (%)
Place of birth for the foreign-born population - Democratic Republic of Congo (Zaire) (%)
Place of birth for the foreign-born population - Other Middle Africa (%)
Place of birth for the foreign-born population - Egypt (%)
Place of birth for the foreign-born population - Morocco (%)
Place of birth for the foreign-born population - Sudan (%)
Place of birth for the foreign-born population - Other Northern Africa (%)
Place of birth for the foreign-born population - South Africa (%)
Place of birth for the foreign-born population - Other Southern Africa (%)
Place of birth for the foreign-born population - Cabo Verde (%)
Place of birth for the foreign-born population - Ghana (%)
Place of birth for the foreign-born population - Liberia (%)
Place of birth for the foreign-born population - Nigeria (%)
Place of birth for the foreign-born population - Senegal (%)
Place of birth for the foreign-born population - Sierra Leone (%)
Place of birth for the foreign-born population - Other Western Africa (%)
Place of birth for the foreign-born population - Australia (%)
Place of birth for the foreign-born population - New Zealand (%)
Place of birth for the foreign-born population - Fiji (%)
Place of birth for the foreign-born population - Micronesia (%)
Place of birth for the foreign-born population - Bahamas (%)
Place of birth for the foreign-born population - Barbados (%)
Place of birth for the foreign-born population - Cuba (%)
Place of birth for the foreign-born population - Dominica (%)
Place of birth for the foreign-born population - Dominican Republic (%)
Place of birth for the foreign-born population - Grenada (%)
Place of birth for the foreign-born population - Haiti (%)
Place of birth for the foreign-born population - Jamaica (%)
Place of birth for the foreign-born population - St. Vincent and the Grenadines (%)
Place of birth for the foreign-born population - Trinidad and Tobago (%)
Place of birth for the foreign-born population - West Indies (%)
Place of birth for the foreign-born population - Other Caribbean (%)
Place of birth for the foreign-born population - Belize (%)
Place of birth for the foreign-born population - Costa Rica (%)
Place of birth for the foreign-born population - El Salvador (%)
Place of birth for the foreign-born population - Guatemala (%)
Place of birth for the foreign-born population - Honduras (%)
Place of birth for the foreign-born population - Mexico (%)
Place of birth for the foreign-born population - Nicaragua (%)
Place of birth for the foreign-born population - Panama (%)
Place of birth for the foreign-born population - Other Central America (%)
Place of birth for the foreign-born population - Argentina (%)
Place of birth for the foreign-born population - Bolivia (%)
Place of birth for the foreign-born population - Brazil (%)
Place of birth for the foreign-born population - Chile (%)
Place of birth for the foreign-born population - Colombia (%)
Place of birth for the foreign-born population - Ecuador (%)
Place of birth for the foreign-born population - Guyana (%)
Place of birth for the foreign-born population - Peru (%)
Place of birth for the foreign-born population - Uruguay (%)
Place of birth for the foreign-born population - Venezuela (%)
Place of birth for the foreign-born population - Other South America (%)
Place of birth for the foreign-born population - Canada (%)
Place of birth for the foreign-born population - Other Northern America (%)
Place of birth for the foreign-born population - Other (%)
Latest news about races in Lewiston, ME collected exclusively by city-data.com from local newspapers, TV, and radio stations
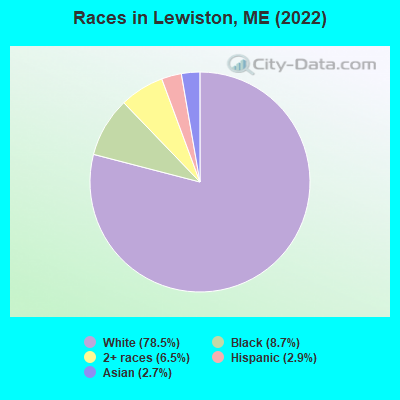
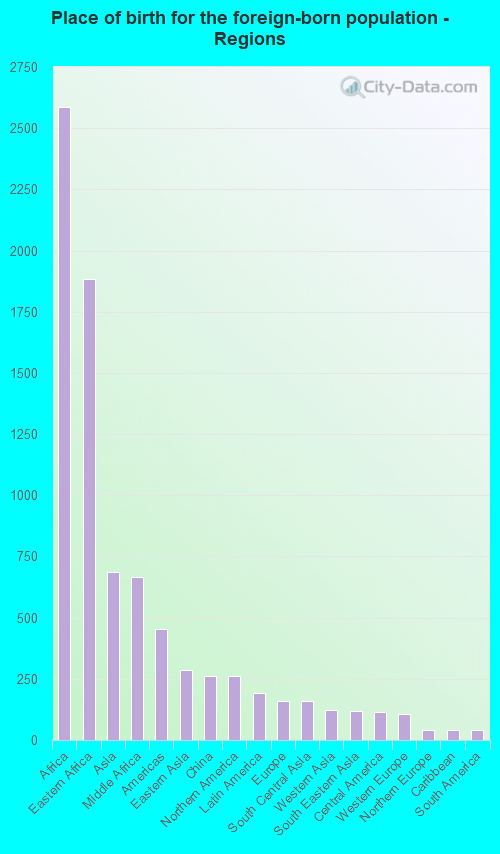
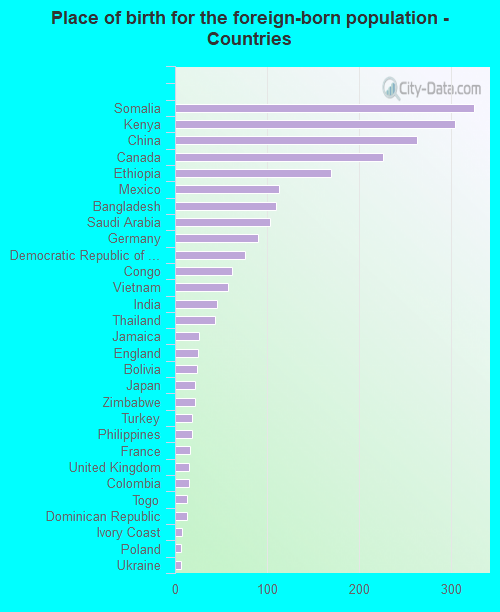
According to 2022 data, the most numerous races in Lewiston, ME are White alone (29,900 residents), Two or more races (2,472 residents), and Hispanic (1,099 residents). 78.8% of Lewiston residents speak English at home. 10.2% of Lewiston, ME residents are foreign-born (6.8% born in Africa, 1.8% born in Asia), which is 70.6% greater than the foreign-born rate of 3.0% across the entire state of Maine.
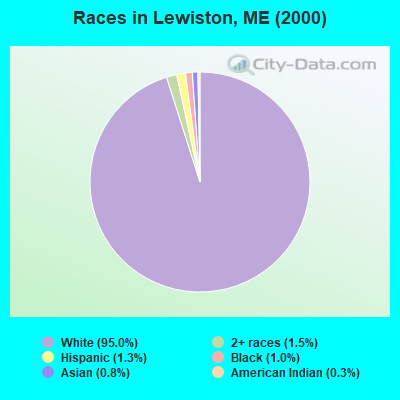
Race distribution in Lewiston
2000 2022
1,230,297 96.5% White alone 11,731 0.9% Two or more races 9,360 0.7% Hispanic 9,014 0.7% Asian alone 6,440 0.5% Black alone 6,911 0.5% American Indian alone 836 0.07% Other race alone 334 0.03% Native Hawaiian and Other
1,249,233 90.2% White alone 58,357 4.2% Two or more races 28,717 2.1% Hispanic 21,583 1.6% Black alone 16,151 1.2% Asian alone 5,873 0.4% Other race alone 5,205 0.4% American Indian alone 221 0.02% Native Hawaiian and Other
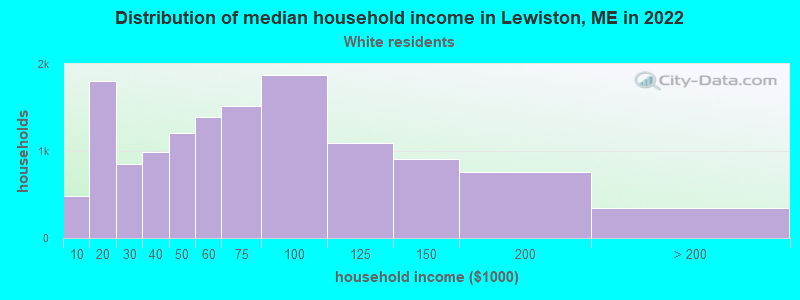
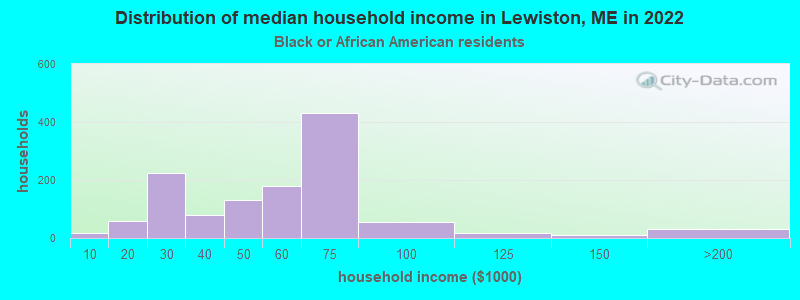
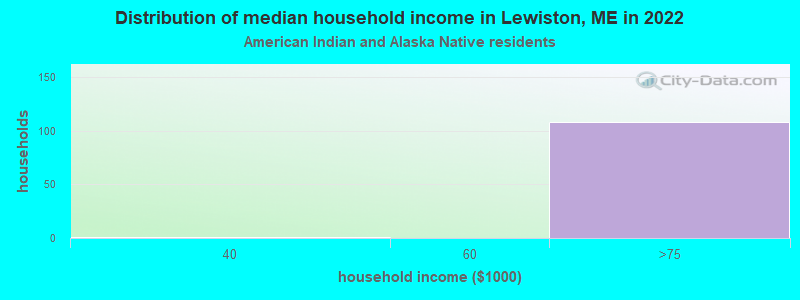
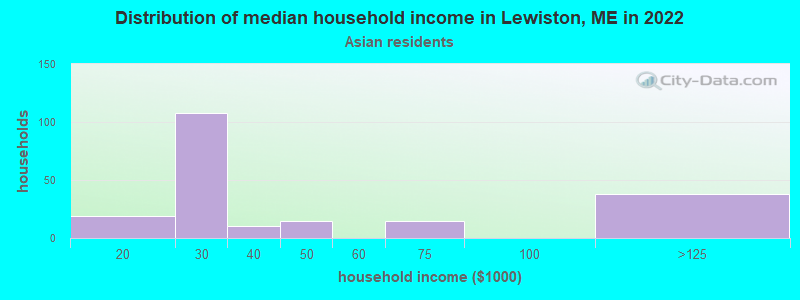
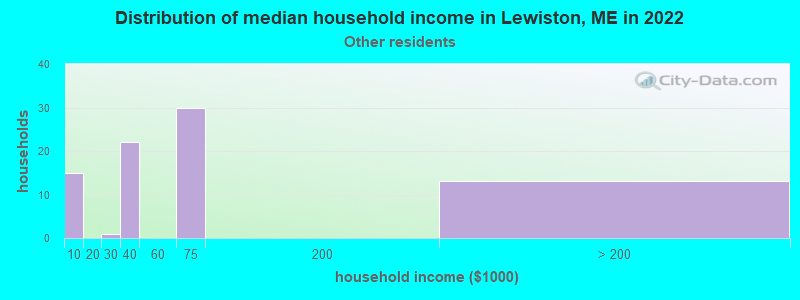
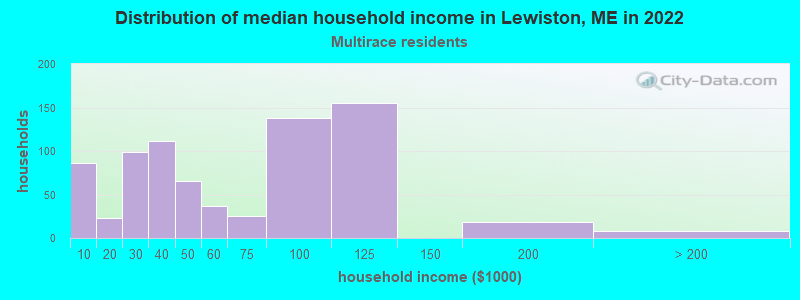
Income and house value in Lewiston Median household income in 2022 $56,440 White non-Hispanic householders$28,468 Black householders$32,535 Asian householders$32,553 Two or more races householders$70,177 Hispanic or Latino race householdersMedian 2022 house value $225,264 White Non-Hispanic householders$237,951 Black or African American householders$276,272 American Indian or Alaska Native householders $229,924 Asian householders$245,978 Some other race householders$252,451 Two or more races householders$245,978 Hispanic or Latino householders
Median age by race in Lewiston
45.3 Median age for White residents44.4 46.8 24.3 Median age for Black or African American residents21.3 37.7 33.5 Median age for American Indian / Alaska Native residents56.7 -708,108,107.4 33.8 Median age for Asian residents36.6 39.0 -666,666,666.0 Median age for Native Hawaiian / Pacific Islander residents-666,666,666.0 -666,666,666.0 36.7 Median age for Other race residents39.4 62.3 21.4 Median age for Two or more races residents20.0 20.3 45.5 Median age for White alone residents44.2 47.1 17.1 Median age for Hispanic or Latino residents26.6 16.3
Owner/renter occupied households by race in Lewiston
House owners and renters - White residents 7,442 55.9% Owner occupied5,870 44.1% Renter occupiedHouse owners and renters - Black or African American residents 146 17.7% Owner occupied683 82.3% Renter occupiedHouse owners and renters - American Indian / Alaska Native residents 72 100.0% Renter occupiedHouse owners and renters - Asian residents 116 27.0% Owner occupied314 73.0% Renter occupiedHouse owners and renters - Other race residents 39 49.2% Owner occupied40 50.8% Renter occupiedHouse owners and renters - Two or more races residents 173 37.5% Owner occupied288 62.5% Renter occupiedHouse owners and renters - White alone residents 7,420 55.7% Owner occupied5,906 44.3% Renter occupiedHouse owners and renters - Hispanic or Latino residents 104 37.6% Owner occupied174 62.4% Renter occupied
Language usage in Lewiston
English speakers - Total 78.8% of residents of Lewiston speak English at home.
1.3% of residents speak Spanish at home 415 89.6% Speak English very well48 10.4% Speak English less than very well20.3% of residents speak other language at home 5,041 69.7% Speak English very well2,192 30.3% Speak English less than very well
English speakers - Born in the United States 92.8% of residents of Lewiston speak English at home.
2.1% of residents speak Spanish at home 171 91.4% Speak English very well16 8.6% Speak English less than very well5.2% of residents speak other language at home 417 88.0% Speak English very well57 12.0% Speak English less than very well
English speakers - Native, born elsewhere 45.5% of residents of Lewiston speak English at home.
5.7% of residents speak Spanish at home 33 100.0% Speak English very well50.9% of residents speak other language at home 274 92.3% Speak English very well23 7.7% Speak English less than very well
English speakers - Foreign-born 11.9% of residents of Lewiston speak English at home.
3.9% of residents speak Spanish at home 118 77.6% Speak English very well34 22.4% Speak English less than very well86.6% of residents speak other language at home 1,722 51.1% Speak English very well1,648 48.9% Speak English less than very well
White (Caucasian) - Speak only English Native:
89.0% (25,324)Foreign-born:
51.9% (156)
White (Caucasian) - Speak another language Native:
9.8% (2,785)Foreign-born:
98.5% (297)
Black or African American - Speak only English Native:
61.6% (544)Foreign-born:
11.5% (313)
Black or African American - Speak another language Native:
50.2% (444)Foreign-born:
84.1% (2,291)
Asian - Speak only English Native:
47.2% (155)Foreign-born:
12.0% (71)
Asian - Speak another language Native:
39.6% (130)Foreign-born:
94.0% (560)
Other race - Speak another language Native:
37.2% (27)Foreign-born:
82.2% (55)
Two or more races - Speak only English Native:
91.1% (2,003)Foreign-born:
10.9% (24)
Two or more races - Speak another language Native:
7.4% (162)Foreign-born:
85.4% (188)
White alone - Speak only English Native:
88.9% (25,223)Foreign-born:
55.7% (158)
White alone - Speak another language Native:
9.9% (2,815)Foreign-born:
95.6% (271)
Hispanic or Latino - Speak only English Native:
75.1% (613)Foreign-born:
9.8% (17)
Hispanic or Latino - Speak another language Native:
20.8% (170)Foreign-born:
85.9% (153)
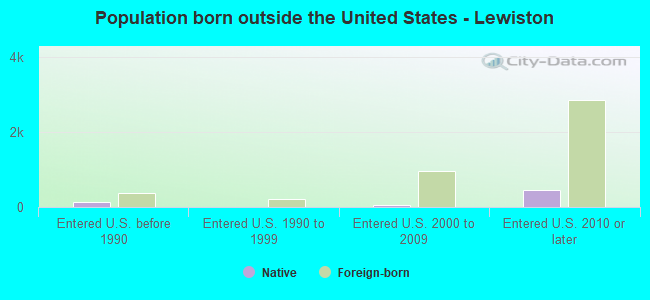
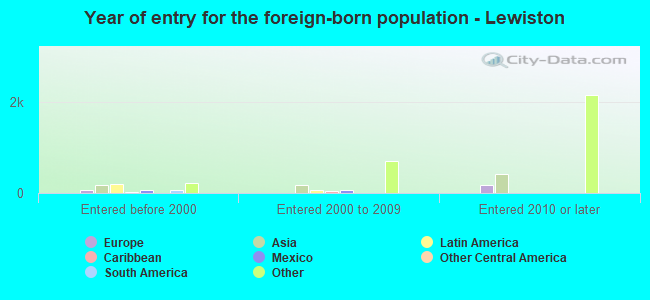
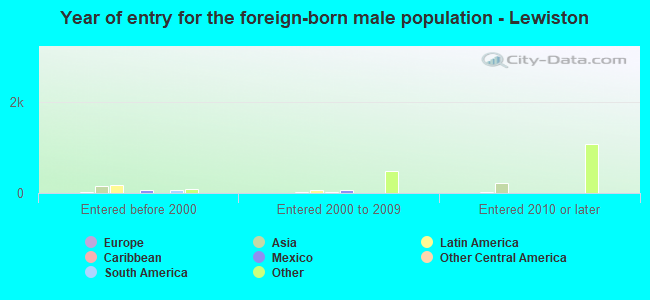
Foreign-born residents in Lewiston 3,889 residents are foreign born (6.8% Africa , 1.8% Asia ).
This city:
10.2%Maine:
3.8%
Marital status for residents in Lewiston Marital status - White (Caucasian) population 15 years and over
Males 36.9% Never married42.4% Now married0.6% Separated4.4% Widowed15.8% DivorcedFemales 28.2% Never married41.3% Now married1.1% Separated10.9% Widowed18.6% DivorcedWomen who gave birth in the past 12 months Now married:
80.1% (276)Unmarried:
19.9% (68)
Women who did not give birth in the past 12 months Now married:
35.1% (2,215)Unmarried:
64.9% (4,100)
Marital status - Black or African American population 15 years and over
Males 52.7% Never married38.5% Now married4.4% Separated3.2% Widowed1.2% DivorcedFemales 51.1% Never married37.0% Now married1.5% Separated2.8% Widowed7.6% DivorcedWomen who gave birth in the past 12 months Now married:
100.0% (83)Unmarried:
0.0% (0)
Women who did not give birth in the past 12 months Now married:
34.6% (346)Unmarried:
65.4% (652)
Marital status - American Indian / Alaska Native population 15 years and over
Males 45.5% Never married45.5% Now married0.0% Separated0.0% Widowed9.1% DivorcedFemales 100.0% Never married0.0% Now married0.0% Separated0.0% Widowed0.0% DivorcedWomen who did not give birth in the past 12 months Now married:
0.0% (0)Unmarried:
100.0% (50)
Marital status - Asian population 15 years and over
Males 64.9% Never married35.1% Now married0.0% Separated0.0% Widowed0.0% DivorcedFemales 45.8% Never married26.8% Now married21.2% Separated0.0% Widowed6.2% DivorcedWomen who did not give birth in the past 12 months Now married:
29.6% (68)Unmarried:
70.4% (160)
Marital status - Other race population 15 years and over
Males 40.8% Never married32.0% Now married0.0% Separated0.0% Widowed27.2% DivorcedFemales 47.8% Never married0.0% Now married0.0% Separated0.0% Widowed52.2% DivorcedWomen who did not give birth in the past 12 months Now married:
0.0% (0)Unmarried:
100.0% (15)
Marital status - Two or more races population 15 years and over
Males 52.4% Never married32.5% Now married0.0% Separated2.7% Widowed12.4% DivorcedFemales 61.9% Never married18.9% Now married4.7% Separated6.2% Widowed8.4% DivorcedWomen who gave birth in the past 12 months Now married:
15.0% (12)Unmarried:
85.0% (66)
Women who did not give birth in the past 12 months Now married:
15.7% (113)Unmarried:
84.3% (610)
Marital status - White alone, not Hispanic / Latino population 15 years and over
Males 36.9% Never married42.3% Now married0.6% Separated4.4% Widowed15.8% DivorcedFemales 27.7% Never married41.5% Now married1.1% Separated10.9% Widowed18.7% DivorcedWomen who gave birth in the past 12 months Now married:
80.1% (277)Unmarried:
19.9% (69)
Women who did not give birth in the past 12 months Now married:
35.6% (2,229)Unmarried:
64.4% (4,029)
Marital status - Hispanic or Latino population 15 years and over
Males 35.1% Never married52.6% Now married0.0% Separated1.8% Widowed10.5% DivorcedFemales 78.9% Never married18.4% Now married0.0% Separated0.0% Widowed2.7% DivorcedWomen who did not give birth in the past 12 months Now married:
5.2% (19)Unmarried:
94.8% (341)
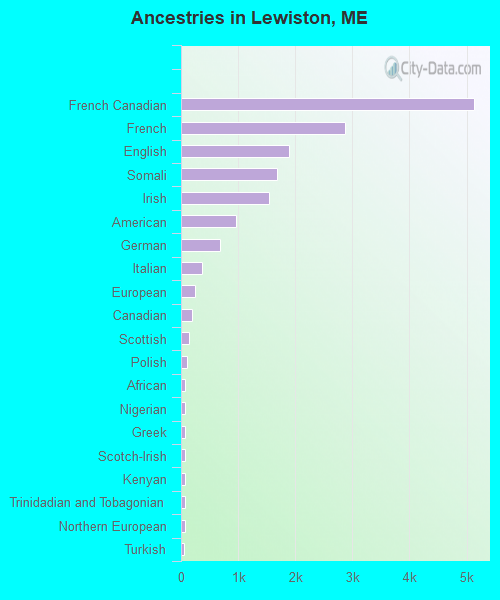
Ancestries in Lewiston
5,136 25.3% French Canadian2,871 14.1% French1,892 9.3% English1,686 8.3% Somali1,535 7.6% Irish957 4.7% American678 3.3% German368 1.8% Italian242 1.2% European192 0.9% Canadian146 0.7% Scottish106 0.5% Polish77 0.4% African73 0.4% Nigerian67 0.3% Greek67 0.3% Scotch-Irish66 0.3% Kenyan66 0.3% Trinidadian and Tobagonian65 0.3% Northern European51 0.3% Turkish45 0.2% Belgian43 0.2% British43 0.2% Ukrainian43 0.2% Welsh34 0.2% Norwegian31 0.2% Zimbabwean23 0.1% Finnish21 0.1% Swedish20 0.10% Scandinavian19 0.09% Arab18 0.09% Lithuanian15 0.07% Russian13 0.06% Ethiopian12 0.06% Jamaican9 0.04% Portuguese8 0.04% Eastern European2 0.01% Serbian
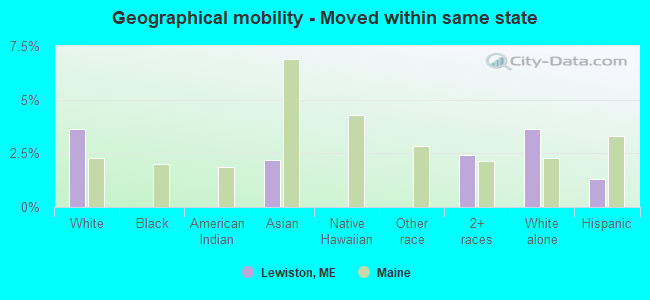
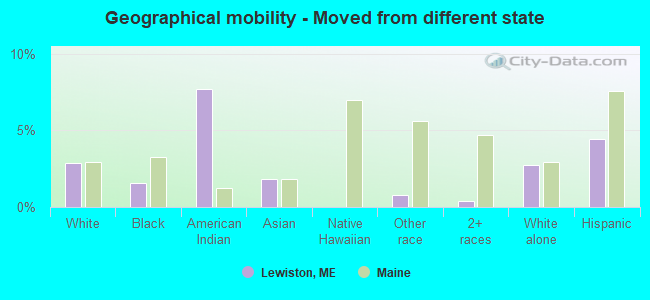
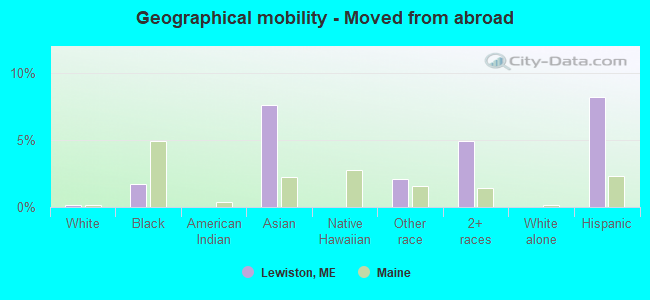
Geographical mobility in Lewiston Same house 1 year ago 25,299 84.8% White (Caucasian)3,340 83.9% Black or African American51 84.9% American Indian / Alaska Native751 82.8% Asian113 77.4% Other race2,190 69.9% Two or more races25,308 85.1% White alone, not Hispanic / Latino761 69.1% Hispanic or LatinoMoved within same county 2,590 8.7% White / Caucasian473 11.9% Black or African American6 9.3% American Indian / Alaska Native42 4.6% Asian13 94.6% Native Hawaiian / Pacific Islander14 9.9% Other race410 13.1% Two or more races2,552 8.6% White alone, not Hispanic / Latino225 20.4% Hispanic or LatinoMoved within same state 1,081 3.6% White / Caucasian0 0.0% Black or African American20 2.2% Asian75 2.4% Two or more races1,083 3.6% White alone, not Hispanic / Latino14 1.3% Hispanic or LatinoMoved from different state 858 2.9% White / Caucasian63 1.6% Black or African American5 7.7% American Indian / Alaska Native17 1.8% Asian1 0.8% Other race13 0.4% Two or more races810 2.7% White alone, not Hispanic / Latino49 4.4% Hispanic or LatinoMoved from abroad 47 0.2% White69 1.7% Black or African American69 7.6% Asian3 2.1% Other race154 4.9% Two or more races4 0.0% White alone, not Hispanic / Latino90 8.2% Hispanic or Latino
Children Nativity (place of birth) in Lewiston
Children under 6 years - Living with two parents Both parents native 675 100.0% NativeBoth parents foreign-born 383 58.9% Native267 41.1% Foreign-bornOne native, one foreign-born parent 156 100.0% NativeChildren under 6 years - Living with one parent Native parent 1,094 98.3% Native19 1.7% Foreign-bornForeign-born parent 99 74.2% Native34 25.8% Foreign-bornChildren 6 to 17 years - Living with two parents Both parents native 1,687 100.0% NativeBoth parents foreign-born 348 36.0% Native619 64.0% Foreign-bornOne native, one foreign-born parent 164 100.0% NativeChildren 6 to 17 years - Living with one parent Native parent 1,172 85.8% Native193 14.2% Foreign-bornForeign-born parent 296 81.3% Native68 18.7% Foreign-born
Grandparents responsible for own grandchildren in Lewiston
Grandparents (30 to 59 years) White / Caucasian 72 16.8% Responsible for grandchildren357 83.2% Not responsible for grandchildrenWhite alone, not Hispanic / Latino 72 16.8% Responsible for grandchildren357 83.2% Not responsible for grandchildrenGrandparents (60 years and over) White / Caucasian 48 39.7% Responsible for grandchildren73 60.3% Not responsible for grandchildrenWhite alone, not Hispanic / Latino 48 38.6% Responsible for grandchildren77 61.4% Not responsible for grandchildren