Races in Lebanon, Pennsylvania (PA) Detailed Stats
Data:
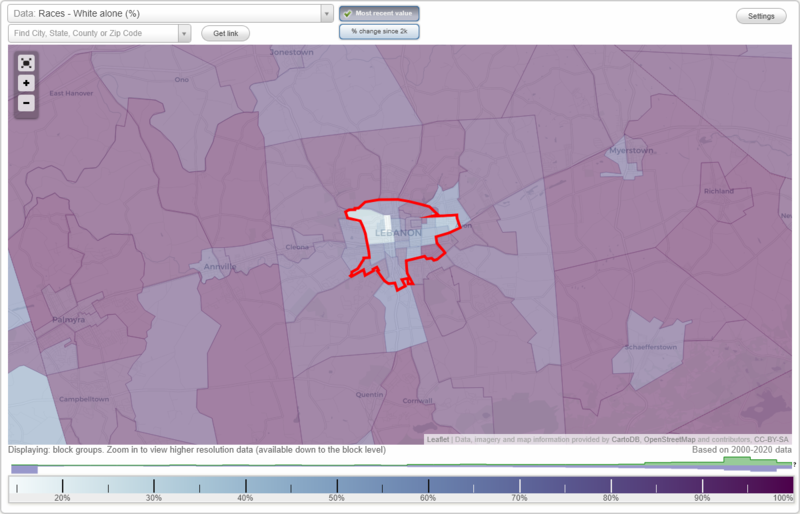
Races - White alone (%)
Races - White alone (% change since 2000)
Races - Black alone (%)
Races - Black alone (% change since 2000)
Races - American Indian alone (%)
Races - American Indian alone (% change since 2000)
Races - Asian alone (%)
Races - Asian alone (% change since 2000)
Races - Hispanic (%)
Races - Hispanic (% change since 2000)
Races - Native Hawaiian and Other Pacific Islander alone (%)
Races - Native Hawaiian and Other Pacific Islander alone (% change since 2000)
Races - Two or more races(%)
Races - Two or more races(% change since 2000)
Races - Other race alone (%)
Races - Other race alone (% change since 2000)
Racial diversity
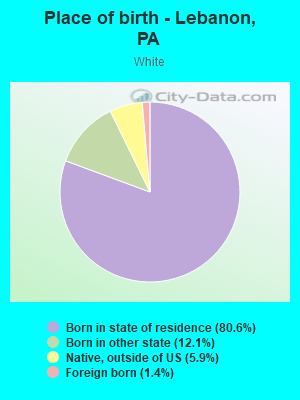
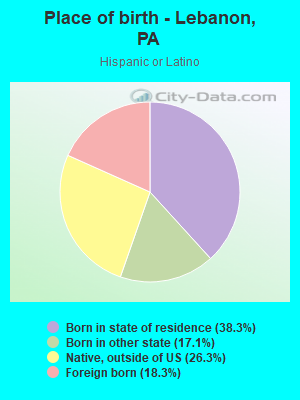
Place of birth - Born in state of residence (%)
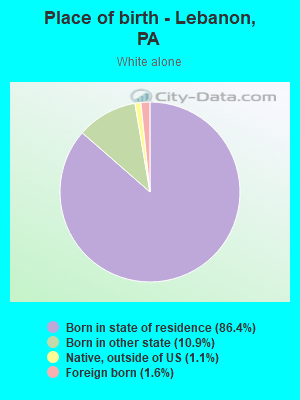
Place of birth - Born in state of residence (%) - White
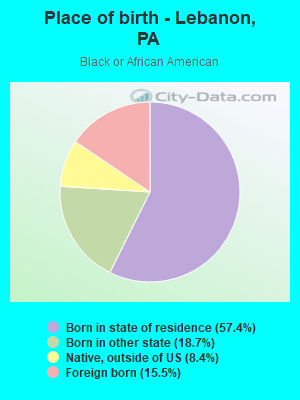
Place of birth - Born in state of residence (%) - Black or African American
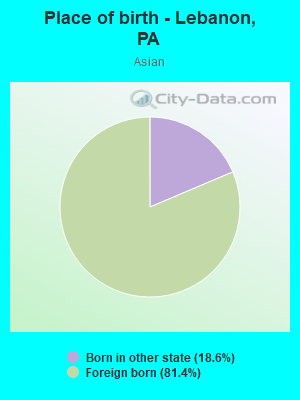
Place of birth - Born in state of residence (%) - Asian
Place of birth - Born in state of residence (%) - Hispanic or Latino
Place of birth - Born in state of residence (%) - American Indian and Alaska Native
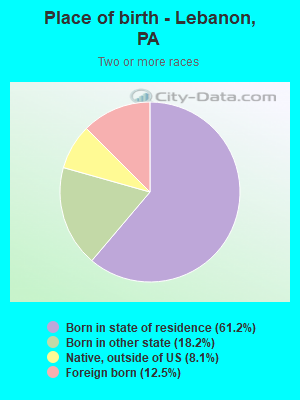
Place of birth - Born in state of residence (%) - Multirace
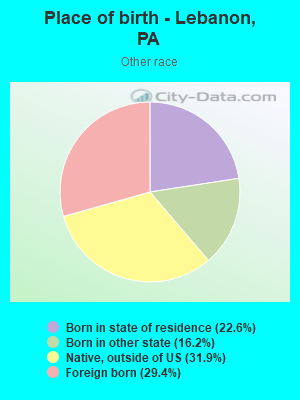
Place of birth - Born in state of residence (%) - Other Race
Place of birth - Born in other state (%)
Place of birth - Born in other state (%) - White
Place of birth - Born in other state (%) - Black or African American
Place of birth - Born in other state (%) - Asian
Place of birth - Born in other state (%) - Hispanic or Latino
Place of birth - Born in other state (%) - American Indian and Alaska Native
Place of birth - Born in other state (%) - Multirace
Place of birth - Born in other state (%) - Other Race
Place of birth - Native, outside of US (%)
Place of birth - Native, outside of US (%) - White
Place of birth - Native, outside of US (%) - Black or African American
Place of birth - Native, outside of US (%) - Asian
Place of birth - Native, outside of US (%) - Hispanic or Latino
Place of birth - Native, outside of US (%) - American Indian and Alaska Native
Place of birth - Native, outside of US (%) - Multirace
Place of birth - Native, outside of US (%) - Other Race
Place of birth - Foreign born (%)
Place of birth - Foreign born (%) - White
Place of birth - Foreign born (%) - Black or African American
Place of birth - Foreign born (%) - Asian
Place of birth - Foreign born (%) - Hispanic or Latino
Place of birth - Foreign born (%) - American Indian and Alaska Native
Place of birth - Foreign born (%) - Multirace
Place of birth - Foreign born (%) - Other Race
Residents speaking English at home (%)
Residents speaking English at home - Born in the United States (%)
Residents speaking English at home - Native, born elsewhere (%)
Residents speaking English at home - Foreign born (%)
Residents speaking Spanish at home (%)
Residents speaking Spanish at home - Born in the United States (%)
Residents speaking Spanish at home - Native, born elsewhere (%)
Residents speaking Spanish at home - Foreign born (%)
Residents speaking other language at home (%)
Residents speaking other language at home - Born in the United States (%)
Residents speaking other language at home - Native, born elsewhere (%)
Residents speaking other language at home - Foreign born (%)
Marital status - Never married (%)
Marital status - Now married (%)
Marital status - Separated (%)
Marital status - Widowed (%)
Marital status - Divorced (%)
Ancestries Reported - Arab (%)
Ancestries Reported - Czech (%)
Ancestries Reported - Danish (%)
Ancestries Reported - Dutch (%)
Ancestries Reported - English (%)
Ancestries Reported - French (%)
Ancestries Reported - French Canadian (%)
Ancestries Reported - German (%)
Ancestries Reported - Greek (%)
Ancestries Reported - Hungarian (%)
Ancestries Reported - Irish (%)
Ancestries Reported - Italian (%)
Ancestries Reported - Lithuanian (%)
Ancestries Reported - Norwegian (%)
Ancestries Reported - Polish (%)
Ancestries Reported - Portuguese (%)
Ancestries Reported - Russian (%)
Ancestries Reported - Scotch-Irish (%)
Ancestries Reported - Scottish (%)
Ancestries Reported - Slovak (%)
Ancestries Reported - Subsaharan African (%)
Ancestries Reported - Swedish (%)
Ancestries Reported - Swiss (%)
Ancestries Reported - Ukrainian (%)
Ancestries Reported - United States (%)
Ancestries Reported - Welsh (%)
Ancestries Reported - West Indian (%)
Ancestries Reported - Other (%)
Geographical mobility - Same house 1 year ago (%)
Geographical mobility - Same house 1 year ago (%) - White
Geographical mobility - Same house 1 year ago (%) - Black or African American
Geographical mobility - Same house 1 year ago (%) - Asian
Geographical mobility - Same house 1 year ago (%) - Hispanic or Latino
Geographical mobility - Same house 1 year ago (%) - American Indian and Alaska Native
Geographical mobility - Same house 1 year ago (%) - Multirace
Geographical mobility - Same house 1 year ago (%) - Other Race
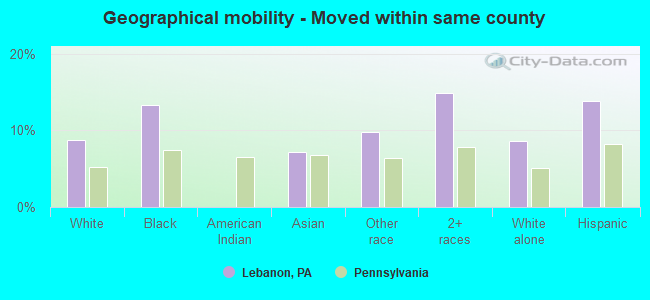
Geographical mobility - Moved within same county (%)
Geographical mobility - Moved within same county (%) - White
Geographical mobility - Moved within same county (%) - Black or African American
Geographical mobility - Moved within same county (%) - Asian
Geographical mobility - Moved within same county (%) - Hispanic or Latino
Geographical mobility - Moved within same county (%) - American Indian and Alaska Native
Geographical mobility - Moved within same county (%) - Multirace
Geographical mobility - Moved within same county (%) - Other Race
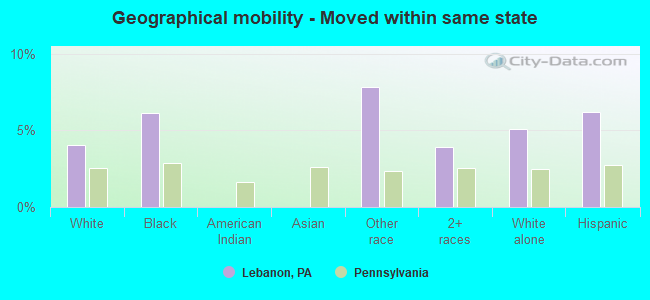
Geographical mobility - Moved from different county within same state (%)
Geographical mobility - Moved from different county within same state (%) - White
Geographical mobility - Moved from different county within same state (%) - Black or African American
Geographical mobility - Moved from different county within same state (%) - Asian
Geographical mobility - Moved from different county within same state (%) - Hispanic or Latino
Geographical mobility - Moved from different county within same state (%) - American Indian and Alaska Native
Geographical mobility - Moved from different county within same state (%) - Multirace
Geographical mobility - Moved from different county within same state (%) - Other Race
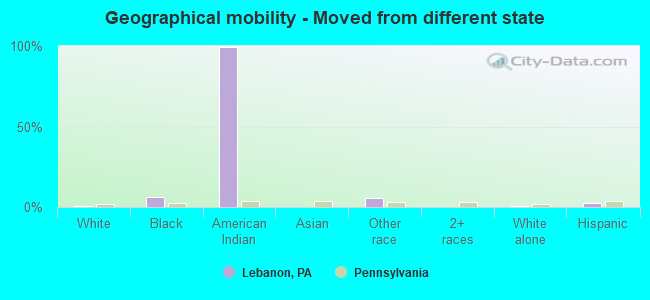
Geographical mobility - Moved from different state (%)
Geographical mobility - Moved from different state (%) - White
Geographical mobility - Moved from different state (%) - Black or African American
Geographical mobility - Moved from different state (%) - Asian
Geographical mobility - Moved from different state (%) - Hispanic or Latino
Geographical mobility - Moved from different state (%) - American Indian and Alaska Native
Geographical mobility - Moved from different state (%) - Multirace
Geographical mobility - Moved from different state (%) - Other Race
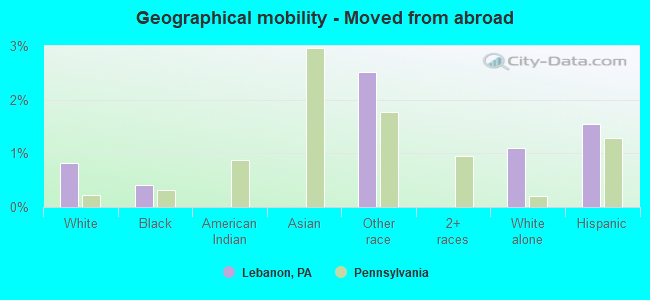
Geographical mobility - Moved from abroad (%)
Geographical mobility - Moved from abroad (%) - White
Geographical mobility - Moved from abroad (%) - Black or African American
Geographical mobility - Moved from abroad (%) - Asian
Geographical mobility - Moved from abroad (%) - Hispanic or Latino
Geographical mobility - Moved from abroad (%) - American Indian and Alaska Native
Geographical mobility - Moved from abroad (%) - Multirace
Geographical mobility - Moved from abroad (%) - Other Race
Place of birth for the foreign-born population - Ireland (%)
Place of birth for the foreign-born population - Denmark (%)
Place of birth for the foreign-born population - Norway (%)
Place of birth for the foreign-born population - Sweden (%)
Place of birth for the foreign-born population - United Kingdom (%)
Place of birth for the foreign-born population - England (%)
Place of birth for the foreign-born population - Scotland (%)
Place of birth for the foreign-born population - Other Northern Europe (%)
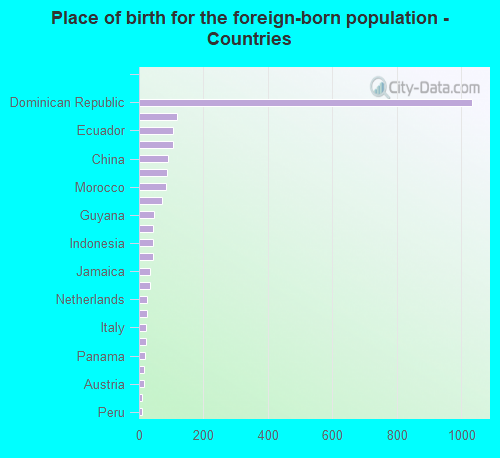
Place of birth for the foreign-born population - Austria (%)
Place of birth for the foreign-born population - Belgium (%)
Place of birth for the foreign-born population - France (%)
Place of birth for the foreign-born population - Germany (%)
Place of birth for the foreign-born population - Netherlands (%)
Place of birth for the foreign-born population - Switzerland (%)
Place of birth for the foreign-born population - Other Western Europe (%)
Place of birth for the foreign-born population - Greece (%)
Place of birth for the foreign-born population - Italy (%)
Place of birth for the foreign-born population - Portugal (%)
Place of birth for the foreign-born population - Spain (%)
Place of birth for the foreign-born population - Other Southern Europe (%)
Place of birth for the foreign-born population - Albania (%)
Place of birth for the foreign-born population - Belarus (%)
Place of birth for the foreign-born population - Bosnia and Herzegovina (%)
Place of birth for the foreign-born population - Bulgaria (%)
Place of birth for the foreign-born population - Croatia (%)
Place of birth for the foreign-born population - Czechoslovakia (%)
Place of birth for the foreign-born population - Hungary (%)
Place of birth for the foreign-born population - Latvia (%)
Place of birth for the foreign-born population - Lithuania (%)
Place of birth for the foreign-born population - North Macedonia (Macedonia) (%)
Place of birth for the foreign-born population - Moldova (%)
Place of birth for the foreign-born population - Poland (%)
Place of birth for the foreign-born population - Romania (%)
Place of birth for the foreign-born population - Russia (%)
Place of birth for the foreign-born population - Serbia (%)
Place of birth for the foreign-born population - Ukraine (%)
Place of birth for the foreign-born population - Other Eastern Europe (%)
Place of birth for the foreign-born population - China (%)
Place of birth for the foreign-born population - Hong Kong (%)
Place of birth for the foreign-born population - Taiwan (%)
Place of birth for the foreign-born population - Japan (%)
Place of birth for the foreign-born population - Korea (%)
Place of birth for the foreign-born population - Other Eastern Asia (%)
Place of birth for the foreign-born population - Afghanistan (%)
Place of birth for the foreign-born population - Bangladesh (%)
Place of birth for the foreign-born population - India (%)
Place of birth for the foreign-born population - Iran (%)
Place of birth for the foreign-born population - Kazakhstan (%)
Place of birth for the foreign-born population - Nepal (%)
Place of birth for the foreign-born population - Pakistan (%)
Place of birth for the foreign-born population - Sri Lanka (%)
Place of birth for the foreign-born population - Uzbekistan (%)
Place of birth for the foreign-born population - Other South Central Asia (%)
Place of birth for the foreign-born population - Burma (%)
Place of birth for the foreign-born population - Cambodia (%)
Place of birth for the foreign-born population - Indonesia (%)
Place of birth for the foreign-born population - Laos (%)
Place of birth for the foreign-born population - Malaysia (%)
Place of birth for the foreign-born population - Philippines (%)
Place of birth for the foreign-born population - Singapore (%)
Place of birth for the foreign-born population - Thailand (%)
Place of birth for the foreign-born population - Vietnam (%)
Place of birth for the foreign-born population - Other South Eastern Asia (%)
Place of birth for the foreign-born population - Armenia (%)
Place of birth for the foreign-born population - Iraq (%)
Place of birth for the foreign-born population - Israel (%)
Place of birth for the foreign-born population - Jordan (%)
Place of birth for the foreign-born population - Kuwait (%)
Place of birth for the foreign-born population - Lebanon (%)
Place of birth for the foreign-born population - Saudi Arabia (%)
Place of birth for the foreign-born population - Syria (%)
Place of birth for the foreign-born population - Turkey (%)
Place of birth for the foreign-born population - Yemen (%)
Place of birth for the foreign-born population - Other Western Asia (%)
Place of birth for the foreign-born population - Eritrea (%)
Place of birth for the foreign-born population - Ethiopia (%)
Place of birth for the foreign-born population - Kenya (%)
Place of birth for the foreign-born population - Somalia (%)
Place of birth for the foreign-born population - Uganda (%)
Place of birth for the foreign-born population - Zimbabwe (%)
Place of birth for the foreign-born population - Other Eastern Africa (%)
Place of birth for the foreign-born population - Cameroon (%)
Place of birth for the foreign-born population - Congo (%)
Place of birth for the foreign-born population - Democratic Republic of Congo (Zaire) (%)
Place of birth for the foreign-born population - Other Middle Africa (%)
Place of birth for the foreign-born population - Egypt (%)
Place of birth for the foreign-born population - Morocco (%)
Place of birth for the foreign-born population - Sudan (%)
Place of birth for the foreign-born population - Other Northern Africa (%)
Place of birth for the foreign-born population - South Africa (%)
Place of birth for the foreign-born population - Other Southern Africa (%)
Place of birth for the foreign-born population - Cabo Verde (%)
Place of birth for the foreign-born population - Ghana (%)
Place of birth for the foreign-born population - Liberia (%)
Place of birth for the foreign-born population - Nigeria (%)
Place of birth for the foreign-born population - Senegal (%)
Place of birth for the foreign-born population - Sierra Leone (%)
Place of birth for the foreign-born population - Other Western Africa (%)
Place of birth for the foreign-born population - Australia (%)
Place of birth for the foreign-born population - New Zealand (%)
Place of birth for the foreign-born population - Fiji (%)
Place of birth for the foreign-born population - Micronesia (%)
Place of birth for the foreign-born population - Bahamas (%)
Place of birth for the foreign-born population - Barbados (%)
Place of birth for the foreign-born population - Cuba (%)
Place of birth for the foreign-born population - Dominica (%)
Place of birth for the foreign-born population - Dominican Republic (%)
Place of birth for the foreign-born population - Grenada (%)
Place of birth for the foreign-born population - Haiti (%)
Place of birth for the foreign-born population - Jamaica (%)
Place of birth for the foreign-born population - St. Vincent and the Grenadines (%)
Place of birth for the foreign-born population - Trinidad and Tobago (%)
Place of birth for the foreign-born population - West Indies (%)
Place of birth for the foreign-born population - Other Caribbean (%)
Place of birth for the foreign-born population - Belize (%)
Place of birth for the foreign-born population - Costa Rica (%)
Place of birth for the foreign-born population - El Salvador (%)
Place of birth for the foreign-born population - Guatemala (%)
Place of birth for the foreign-born population - Honduras (%)
Place of birth for the foreign-born population - Mexico (%)
Place of birth for the foreign-born population - Nicaragua (%)
Place of birth for the foreign-born population - Panama (%)
Place of birth for the foreign-born population - Other Central America (%)
Place of birth for the foreign-born population - Argentina (%)
Place of birth for the foreign-born population - Bolivia (%)
Place of birth for the foreign-born population - Brazil (%)
Place of birth for the foreign-born population - Chile (%)
Place of birth for the foreign-born population - Colombia (%)
Place of birth for the foreign-born population - Ecuador (%)
Place of birth for the foreign-born population - Guyana (%)
Place of birth for the foreign-born population - Peru (%)
Place of birth for the foreign-born population - Uruguay (%)
Place of birth for the foreign-born population - Venezuela (%)
Place of birth for the foreign-born population - Other South America (%)
Place of birth for the foreign-born population - Canada (%)
Place of birth for the foreign-born population - Other Northern America (%)
Place of birth for the foreign-born population - Other (%)
Latest news about races in Lebanon, PA collected exclusively by city-data.com from local newspapers, TV, and radio stations
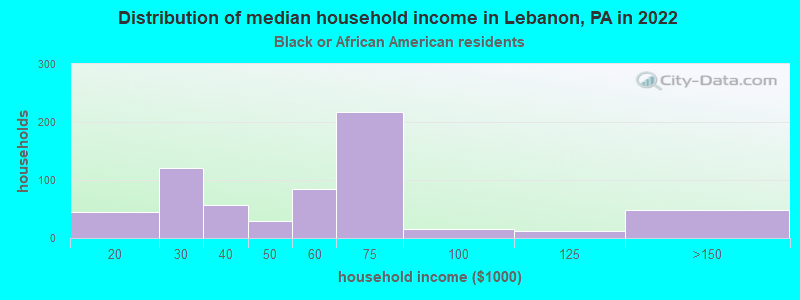
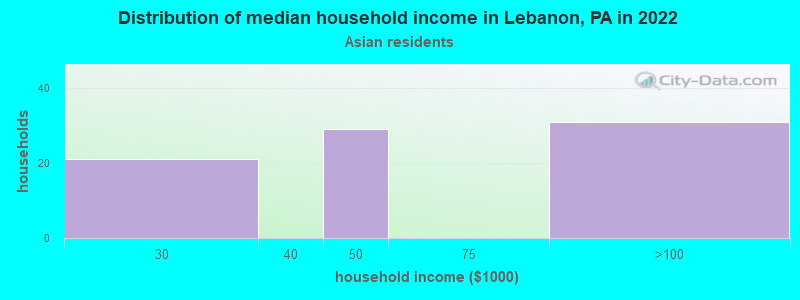
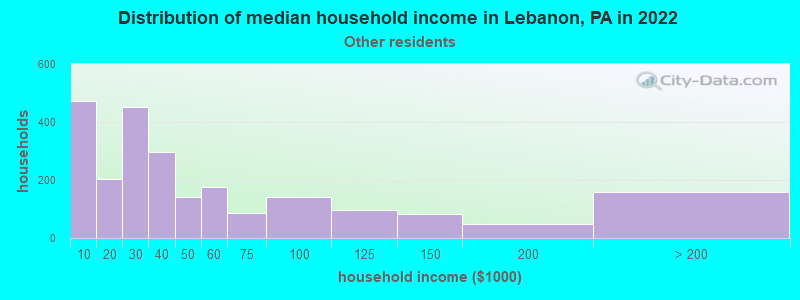
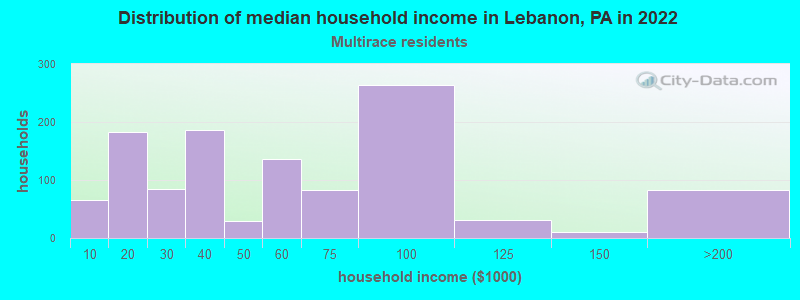
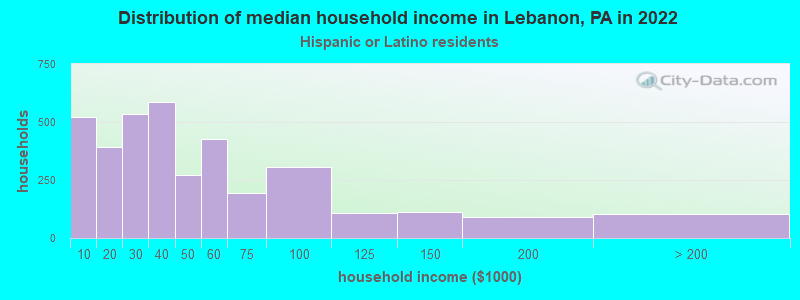
According to 2022 data, the most numerous races in Lebanon, PA are White alone (12,922 residents), Black alone (870 residents), and Hispanic (12,458 residents). 68.7% of Lebanon residents speak English at home. 7.9% of Lebanon, PA residents are foreign-born (5.7% born in Latin America, 1.0% born in Asia), which is 11.4% greater than the foreign-born rate of 7.0% across the entire state of Pennsylvania.
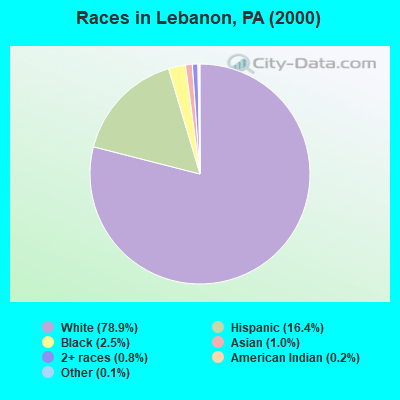
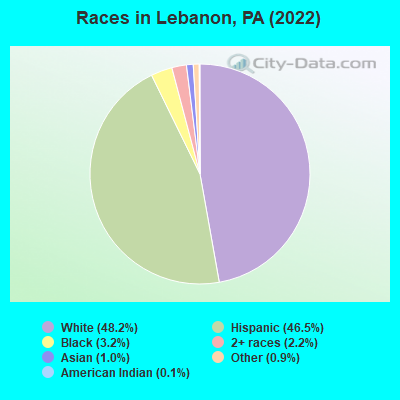
Race distribution in Lebanon
2000 2022
10,322,455 84.1% White alone 1,202,437 9.8% Black alone 394,088 3.2% Hispanic 218,296 1.8% Asian alone 113,097 0.9% Two or more races 13,086 0.1% Other race alone 14,904 0.1% American Indian alone 2,691 0.02% Native Hawaiian and Other
9,487,228 73.1% White alone 1,311,581 10.1% Black alone 1,115,997 8.6% Hispanic 493,942 3.8% Two or more races 487,124 3.8% Asian alone 63,582 0.5% Other race alone 10,130 0.08% American Indian alone 2,424 0.02% Native Hawaiian and Other
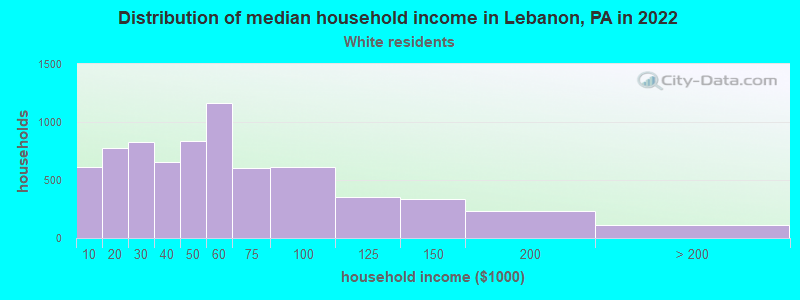
Income and house value in Lebanon Median household income in 2022 $47,967 White non-Hispanic householders$63,380 Black householders$37,018 Some other race householders$72,624 Two or more races householders$50,802 Hispanic or Latino race householdersMedian 2022 house value $137,179 White Non-Hispanic householders$119,385 Black or African American householders$336,223 American Indian or Alaska Native householders $248,909 Asian householders$118,764 Some other race householders$87,107 Two or more races householders$129,730 Hispanic or Latino householders
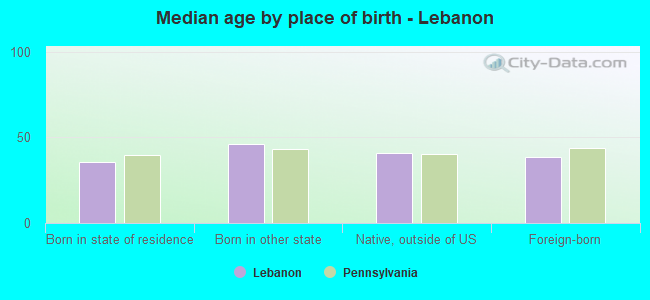
Median age by race in Lebanon
44.7 Median age for White residents43.9 46.2 47.6 Median age for Black or African American residents51.5 43.3 -861,747,242.6 Median age for American Indian / Alaska Native residents-881,944,443.6 -577,519,379.3 21.4 Median age for Asian residents46.0 17.2 -666,666,666.0 Median age for Native Hawaiian / Pacific Islander residents-666,666,666.0 -666,666,666.0 32.1 Median age for Other race residents29.1 36.1 34.7 Median age for Two or more races residents49.9 22.3 50.0 Median age for White alone residents48.4 52.0 30.5 Median age for Hispanic or Latino residents29.4 34.3
Owner/renter occupied households by race in Lebanon
House owners and renters - White residents 3,717 55.3% Owner occupied3,007 44.7% Renter occupiedHouse owners and renters - Black or African American residents 115 20.1% Owner occupied459 79.9% Renter occupiedHouse owners and renters - American Indian / Alaska Native residents 16 100.0% Renter occupiedHouse owners and renters - Asian residents 82 72.6% Owner occupied31 27.4% Renter occupiedHouse owners and renters - Other race residents 831 39.7% Owner occupied1,262 60.3% Renter occupiedHouse owners and renters - Two or more races residents 831 53.0% Owner occupied736 47.0% Renter occupiedHouse owners and renters - White alone residents 3,541 56.3% Owner occupied2,751 43.7% Renter occupiedHouse owners and renters - Hispanic or Latino residents 1,429 38.3% Owner occupied2,299 61.7% Renter occupied
Language usage in Lebanon
English speakers - Total 68.7% of residents of Lebanon speak English at home.
28.3% of residents speak Spanish at home 3,993 56.5% Speak English very well3,075 43.5% Speak English less than very well1.7% of residents speak other language at home 276 64.5% Speak English very well152 35.5% Speak English less than very well
English speakers - Born in the United States 62.2% of residents of Lebanon speak English at home.
25.4% of residents speak Spanish at home 843 87.5% Speak English very well120 12.5% Speak English less than very well
English speakers - Native, born elsewhere 18.6% of residents of Lebanon speak English at home.
79.4% of residents speak Spanish at home 1,279 46.1% Speak English very well1,497 53.9% Speak English less than very well
English speakers - Foreign-born 21.1% of residents of Lebanon speak English at home.
60.8% of residents speak Spanish at home 315 20.7% Speak English very well1,205 79.3% Speak English less than very well10.9% of residents speak other language at home 133 48.7% Speak English very well140 51.3% Speak English less than very well
White (Caucasian) - Speak only English Native:
90.1% (12,497)Foreign-born:
75.1% (155)
White (Caucasian) - Speak another language Native:
10.2% (1,415)Foreign-born:
31.0% (64)
Black or African American - Speak only English Native:
86.1% (789)Foreign-born:
23.3% (43)
Black or African American - Speak another language Native:
13.4% (123)Foreign-born:
72.4% (133)
Asian - Speak only English Native:
61.6% (35)Foreign-born:
32.1% (69)
Other race - Speak only English Native:
35.7% (1,572)Foreign-born:
2.9% (61)
Other race - Speak another language Native:
63.7% (2,806)Foreign-born:
89.4% (1,858)
Two or more races - Speak only English Native:
65.5% (2,254)Foreign-born:
2.5% (14)
Two or more races - Speak another language Native:
28.4% (978)Foreign-born:
87.7% (474)
White alone - Speak only English Native:
97.9% (11,764)Foreign-born:
77.8% (162)
White alone - Speak another language Native:
1.5% (179)Foreign-born:
28.7% (60)
Hispanic or Latino - Speak only English Native:
44.6% (4,043)Foreign-born:
2.1% (47)
Hispanic or Latino - Speak another language Native:
53.8% (4,879)Foreign-born:
94.9% (2,174)
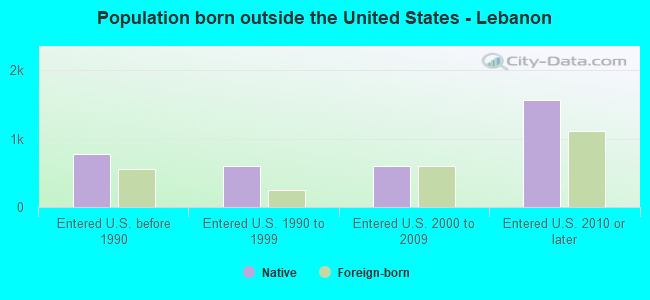
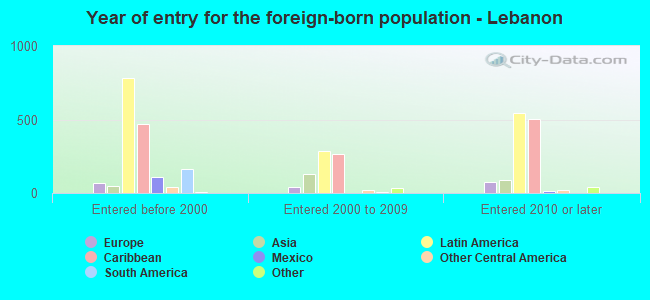
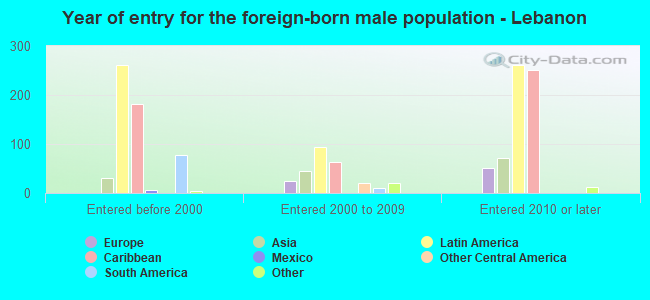
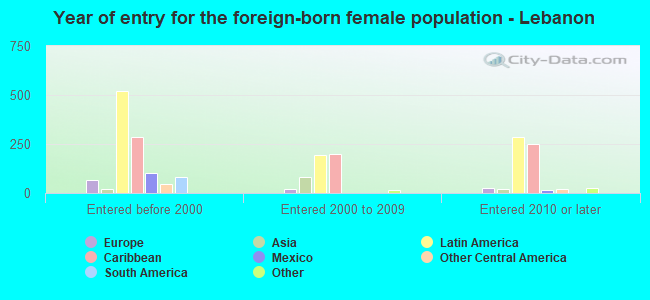
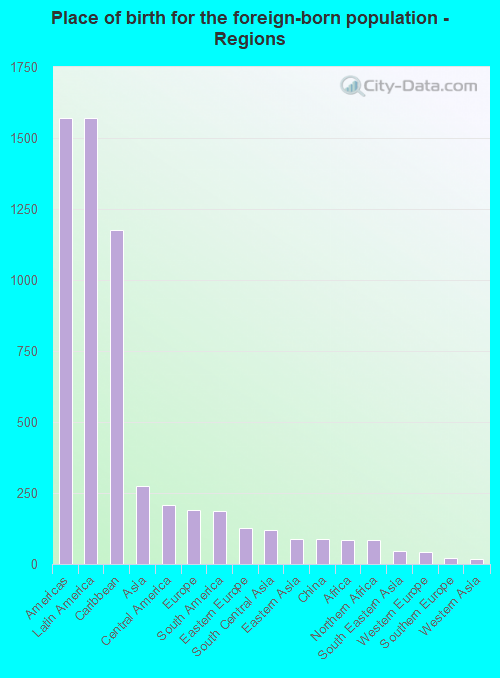
Foreign-born residents in Lebanon 2,120 residents are foreign born (5.7% Latin America , 1.0% Asia ).
This city:
7.9%Pennsylvania:
7.3%
Marital status for residents in Lebanon Marital status - White (Caucasian) population 15 years and over
Males 38.5% Never married38.8% Now married1.9% Separated2.8% Widowed18.0% DivorcedFemales 32.4% Never married36.9% Now married2.2% Separated11.2% Widowed17.3% DivorcedWomen who gave birth in the past 12 months Now married:
80.2% (174)Unmarried:
19.8% (43)
Women who did not give birth in the past 12 months Now married:
35.1% (1,132)Unmarried:
64.9% (2,092)
Marital status - Black or African American population 15 years and over
Males 19.1% Never married63.3% Now married8.4% Separated2.1% Widowed7.1% DivorcedFemales 41.8% Never married30.5% Now married0.0% Separated10.9% Widowed16.8% DivorcedWomen who did not give birth in the past 12 months Now married:
28.9% (55)Unmarried:
71.1% (135)
Marital status - Asian population 15 years and over
Males 25.2% Never married49.6% Now married0.0% Separated25.2% Widowed0.0% DivorcedFemales 83.6% Never married16.4% Now married0.0% Separated0.0% Widowed0.0% DivorcedWomen who did not give birth in the past 12 months Now married:
14.4% (18)Unmarried:
85.6% (110)
Marital status - Other race population 15 years and over
Males 60.2% Never married31.8% Now married4.5% Separated1.5% Widowed1.9% DivorcedFemales 51.3% Never married27.3% Now married4.4% Separated6.1% Widowed10.9% DivorcedWomen who gave birth in the past 12 months Now married:
0.0% (0)Unmarried:
100.0% (32)
Women who did not give birth in the past 12 months Now married:
26.4% (608)Unmarried:
73.6% (1,695)
Marital status - Two or more races population 15 years and over
Males 64.0% Never married27.8% Now married1.9% Separated0.2% Widowed6.1% DivorcedFemales 54.4% Never married38.1% Now married0.3% Separated0.0% Widowed7.2% DivorcedWomen who gave birth in the past 12 months Now married:
100.0% (18)Unmarried:
0.0% (0)
Women who did not give birth in the past 12 months Now married:
28.1% (247)Unmarried:
71.9% (632)
Marital status - White alone, not Hispanic / Latino population 15 years and over
Males 38.2% Never married39.0% Now married2.1% Separated3.1% Widowed17.7% DivorcedFemales 28.9% Never married38.7% Now married1.5% Separated12.2% Widowed18.6% DivorcedWomen who gave birth in the past 12 months Now married:
80.2% (179)Unmarried:
19.8% (44)
Women who did not give birth in the past 12 months Now married:
36.7% (982)Unmarried:
63.3% (1,696)
Marital status - Hispanic or Latino population 15 years and over
Males 56.4% Never married32.5% Now married3.3% Separated1.2% Widowed6.5% DivorcedFemales 53.8% Never married29.2% Now married4.2% Separated4.1% Widowed8.6% DivorcedWomen who gave birth in the past 12 months Now married:
33.3% (15)Unmarried:
66.7% (29)
Women who did not give birth in the past 12 months Now married:
28.2% (996)Unmarried:
71.8% (2,535)
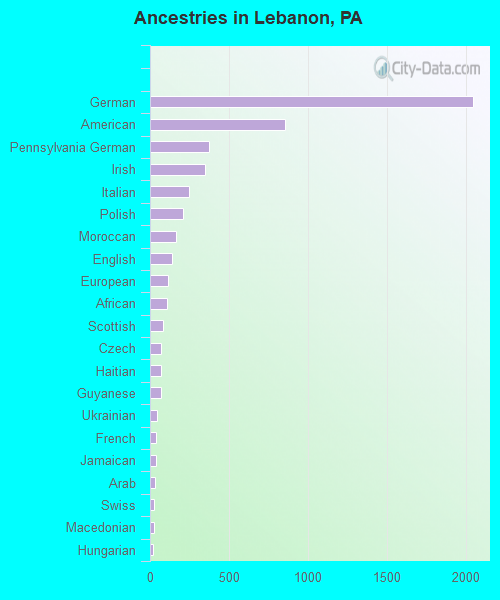
Ancestries in Lebanon
2,045 15.5% German852 6.4% American371 2.8% Pennsylvania German346 2.6% Irish247 1.9% Italian206 1.6% Polish166 1.3% Moroccan137 1.0% English117 0.9% European110 0.8% African85 0.6% Scottish70 0.5% Czech69 0.5% Haitian68 0.5% Guyanese45 0.3% Ukrainian35 0.3% French35 0.3% Jamaican32 0.2% Arab28 0.2% Swiss26 0.2% Macedonian22 0.2% Hungarian16 0.1% Austrian12 0.09% Danish9 0.07% French Canadian8 0.06% Lithuanian8 0.06% Slovene7 0.05% Slovak6 0.05% Dutch6 0.05% Scandinavian5 0.04% Yugoslavian4 0.03% Scotch-Irish
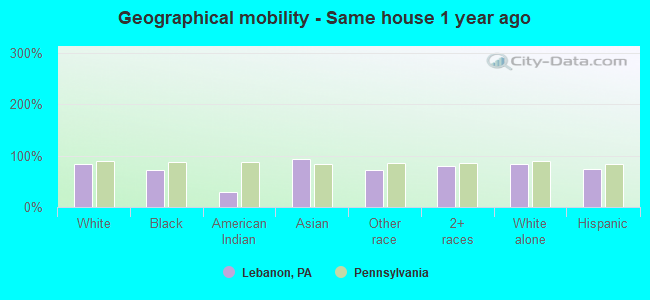
Geographical mobility in Lebanon Same house 1 year ago 12,334 84.2% White (Caucasian)812 72.0% Black or African American17 28.5% American Indian / Alaska Native271 93.7% Asian5,978 71.5% Other race3,316 80.2% Two or more races10,671 83.6% White alone, not Hispanic / Latino9,095 74.2% Hispanic or LatinoMoved within same county 1,274 8.7% White / Caucasian149 13.3% Black or African American21 7.2% Asian821 9.8% Other race615 14.9% Two or more races1,095 8.6% White alone, not Hispanic / Latino1,696 13.8% Hispanic or LatinoMoved within same state 596 4.1% White / Caucasian69 6.1% Black or African American653 7.8% Other race162 3.9% Two or more races647 5.1% White alone, not Hispanic / Latino756 6.2% Hispanic or LatinoMoved from different state 92 0.6% White / Caucasian73 6.4% Black or African American58 99.3% American Indian / Alaska Native442 5.3% Other race93 0.7% White alone, not Hispanic / Latino336 2.7% Hispanic or LatinoMoved from abroad 121 0.8% White5 0.4% Black or African American210 2.5% Other race141 1.1% White alone, not Hispanic / Latino190 1.6% Hispanic or Latino
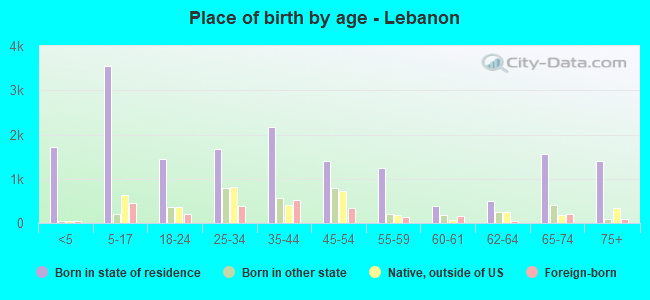
Children Nativity (place of birth) in Lebanon
Children under 6 years - Living with two parents Both parents native 659 100.0% NativeBoth parents foreign-born 190 100.0% NativeOne native, one foreign-born parent 87 100.0% NativeChildren under 6 years - Living with one parent Native parent 1,067 100.0% NativeForeign-born parent 123 100.0% NativeChildren 6 to 17 years - Living with two parents Both parents native 1,357 98.0% Native28 2.0% Foreign-bornBoth parents foreign-born 134 74.8% Native45 25.2% Foreign-bornOne native, one foreign-born parent 240 100.0% NativeChildren 6 to 17 years - Living with one parent Native parent 1,404 100.0% NativeForeign-born parent 469 65.5% Native247 34.5% Foreign-born
Grandparents responsible for own grandchildren in Lebanon
Grandparents (30 to 59 years) White / Caucasian 31 31.4% Responsible for grandchildren68 68.6% Not responsible for grandchildrenOther race 51 17.7% Responsible for grandchildren238 82.3% Not responsible for grandchildrenTwo or more races 41 83.5% Responsible for grandchildren8 16.5% Not responsible for grandchildrenWhite alone, not Hispanic / Latino 33 32.1% Responsible for grandchildren70 67.9% Not responsible for grandchildrenHispanic or Latino 61 24.2% Responsible for grandchildren189 75.8% Not responsible for grandchildrenGrandparents (60 years and over) White / Caucasian 78 49.6% Responsible for grandchildren79 50.4% Not responsible for grandchildrenOther race 130 100.0% Not responsible for grandchildrenTwo or more races 11 100.0% Not responsible for grandchildrenWhite alone, not Hispanic / Latino 78 51.2% Responsible for grandchildren74 48.8% Not responsible for grandchildrenHispanic or Latino 156 100.0% Not responsible for grandchildren