Races in Lebanon, Ohio (OH) Detailed Stats
Data:
Races - White alone (%)
Races - White alone (% change since 2000)
Races - Black alone (%)
Races - Black alone (% change since 2000)
Races - American Indian alone (%)
Races - American Indian alone (% change since 2000)
Races - Asian alone (%)
Races - Asian alone (% change since 2000)
Races - Hispanic (%)
Races - Hispanic (% change since 2000)
Races - Native Hawaiian and Other Pacific Islander alone (%)
Races - Native Hawaiian and Other Pacific Islander alone (% change since 2000)
Races - Two or more races(%)
Races - Two or more races(% change since 2000)
Races - Other race alone (%)
Races - Other race alone (% change since 2000)
Racial diversity
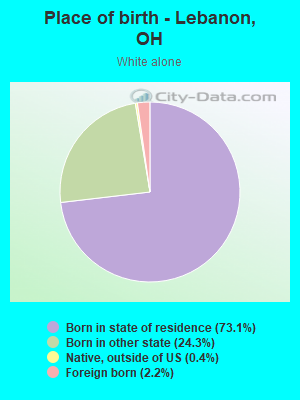
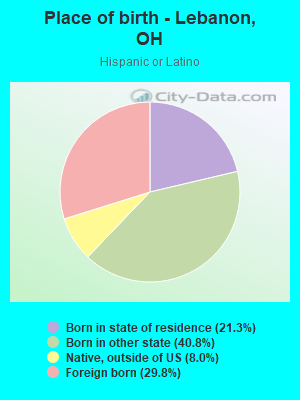
Place of birth - Born in state of residence (%)
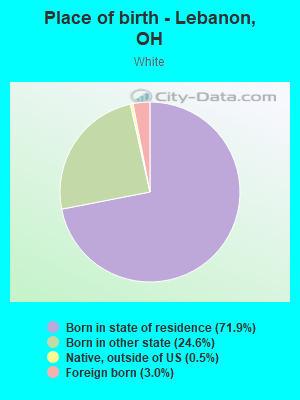
Place of birth - Born in state of residence (%) - White
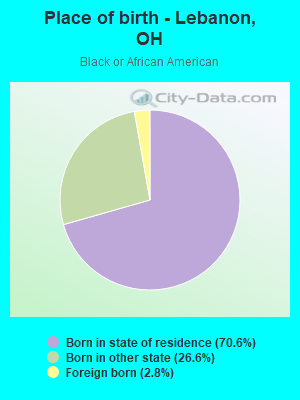
Place of birth - Born in state of residence (%) - Black or African American
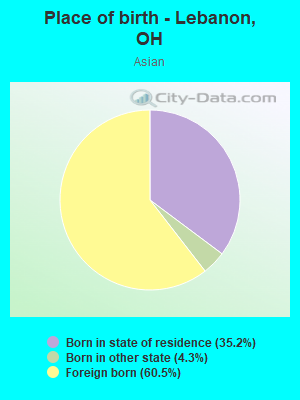
Place of birth - Born in state of residence (%) - Asian
Place of birth - Born in state of residence (%) - Hispanic or Latino
Place of birth - Born in state of residence (%) - American Indian and Alaska Native
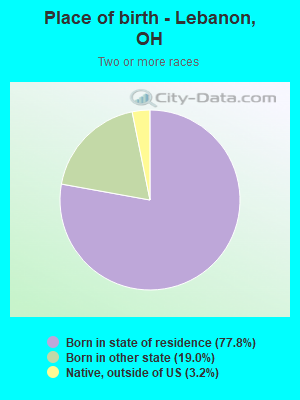
Place of birth - Born in state of residence (%) - Multirace
Place of birth - Born in state of residence (%) - Other Race
Place of birth - Born in other state (%)
Place of birth - Born in other state (%) - White
Place of birth - Born in other state (%) - Black or African American
Place of birth - Born in other state (%) - Asian
Place of birth - Born in other state (%) - Hispanic or Latino
Place of birth - Born in other state (%) - American Indian and Alaska Native
Place of birth - Born in other state (%) - Multirace
Place of birth - Born in other state (%) - Other Race
Place of birth - Native, outside of US (%)
Place of birth - Native, outside of US (%) - White
Place of birth - Native, outside of US (%) - Black or African American
Place of birth - Native, outside of US (%) - Asian
Place of birth - Native, outside of US (%) - Hispanic or Latino
Place of birth - Native, outside of US (%) - American Indian and Alaska Native
Place of birth - Native, outside of US (%) - Multirace
Place of birth - Native, outside of US (%) - Other Race
Place of birth - Foreign born (%)
Place of birth - Foreign born (%) - White
Place of birth - Foreign born (%) - Black or African American
Place of birth - Foreign born (%) - Asian
Place of birth - Foreign born (%) - Hispanic or Latino
Place of birth - Foreign born (%) - American Indian and Alaska Native
Place of birth - Foreign born (%) - Multirace
Place of birth - Foreign born (%) - Other Race
Residents speaking English at home (%)
Residents speaking English at home - Born in the United States (%)
Residents speaking English at home - Native, born elsewhere (%)
Residents speaking English at home - Foreign born (%)
Residents speaking Spanish at home (%)
Residents speaking Spanish at home - Born in the United States (%)
Residents speaking Spanish at home - Native, born elsewhere (%)
Residents speaking Spanish at home - Foreign born (%)
Residents speaking other language at home (%)
Residents speaking other language at home - Born in the United States (%)
Residents speaking other language at home - Native, born elsewhere (%)
Residents speaking other language at home - Foreign born (%)
Marital status - Never married (%)
Marital status - Now married (%)
Marital status - Separated (%)
Marital status - Widowed (%)
Marital status - Divorced (%)
Ancestries Reported - Arab (%)
Ancestries Reported - Czech (%)
Ancestries Reported - Danish (%)
Ancestries Reported - Dutch (%)
Ancestries Reported - English (%)
Ancestries Reported - French (%)
Ancestries Reported - French Canadian (%)
Ancestries Reported - German (%)
Ancestries Reported - Greek (%)
Ancestries Reported - Hungarian (%)
Ancestries Reported - Irish (%)
Ancestries Reported - Italian (%)
Ancestries Reported - Lithuanian (%)
Ancestries Reported - Norwegian (%)
Ancestries Reported - Polish (%)
Ancestries Reported - Portuguese (%)
Ancestries Reported - Russian (%)
Ancestries Reported - Scotch-Irish (%)
Ancestries Reported - Scottish (%)
Ancestries Reported - Slovak (%)
Ancestries Reported - Subsaharan African (%)
Ancestries Reported - Swedish (%)
Ancestries Reported - Swiss (%)
Ancestries Reported - Ukrainian (%)
Ancestries Reported - United States (%)
Ancestries Reported - Welsh (%)
Ancestries Reported - West Indian (%)
Ancestries Reported - Other (%)
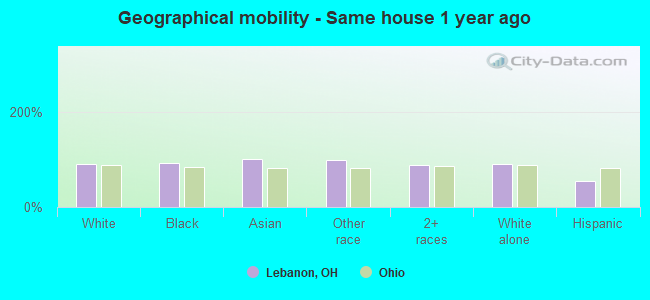
Geographical mobility - Same house 1 year ago (%)
Geographical mobility - Same house 1 year ago (%) - White
Geographical mobility - Same house 1 year ago (%) - Black or African American
Geographical mobility - Same house 1 year ago (%) - Asian
Geographical mobility - Same house 1 year ago (%) - Hispanic or Latino
Geographical mobility - Same house 1 year ago (%) - American Indian and Alaska Native
Geographical mobility - Same house 1 year ago (%) - Multirace
Geographical mobility - Same house 1 year ago (%) - Other Race
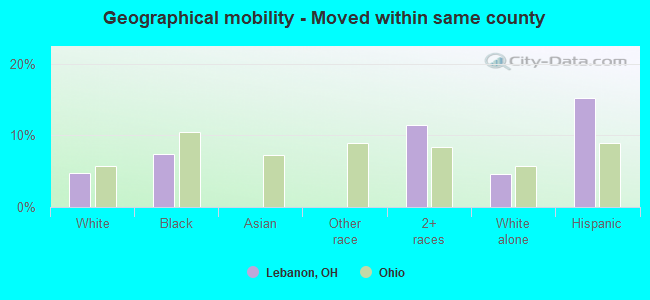
Geographical mobility - Moved within same county (%)
Geographical mobility - Moved within same county (%) - White
Geographical mobility - Moved within same county (%) - Black or African American
Geographical mobility - Moved within same county (%) - Asian
Geographical mobility - Moved within same county (%) - Hispanic or Latino
Geographical mobility - Moved within same county (%) - American Indian and Alaska Native
Geographical mobility - Moved within same county (%) - Multirace
Geographical mobility - Moved within same county (%) - Other Race
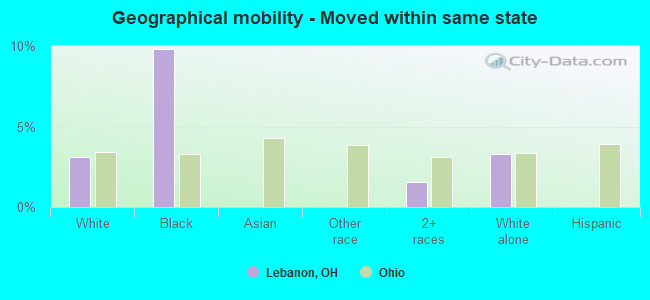
Geographical mobility - Moved from different county within same state (%)
Geographical mobility - Moved from different county within same state (%) - White
Geographical mobility - Moved from different county within same state (%) - Black or African American
Geographical mobility - Moved from different county within same state (%) - Asian
Geographical mobility - Moved from different county within same state (%) - Hispanic or Latino
Geographical mobility - Moved from different county within same state (%) - American Indian and Alaska Native
Geographical mobility - Moved from different county within same state (%) - Multirace
Geographical mobility - Moved from different county within same state (%) - Other Race
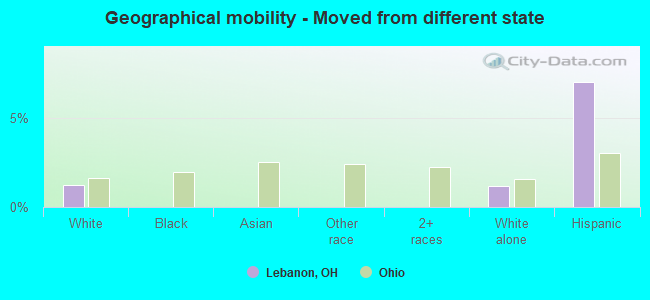
Geographical mobility - Moved from different state (%)
Geographical mobility - Moved from different state (%) - White
Geographical mobility - Moved from different state (%) - Black or African American
Geographical mobility - Moved from different state (%) - Asian
Geographical mobility - Moved from different state (%) - Hispanic or Latino
Geographical mobility - Moved from different state (%) - American Indian and Alaska Native
Geographical mobility - Moved from different state (%) - Multirace
Geographical mobility - Moved from different state (%) - Other Race
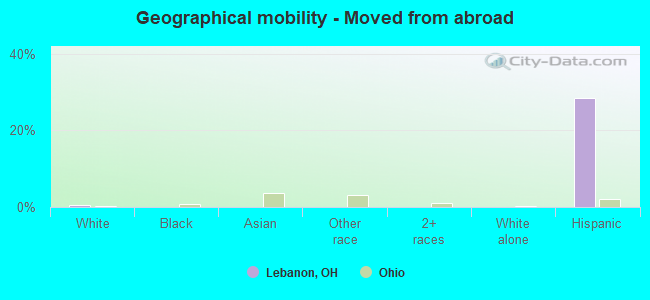
Geographical mobility - Moved from abroad (%)
Geographical mobility - Moved from abroad (%) - White
Geographical mobility - Moved from abroad (%) - Black or African American
Geographical mobility - Moved from abroad (%) - Asian
Geographical mobility - Moved from abroad (%) - Hispanic or Latino
Geographical mobility - Moved from abroad (%) - American Indian and Alaska Native
Geographical mobility - Moved from abroad (%) - Multirace
Geographical mobility - Moved from abroad (%) - Other Race
Place of birth for the foreign-born population - Ireland (%)
Place of birth for the foreign-born population - Denmark (%)
Place of birth for the foreign-born population - Norway (%)
Place of birth for the foreign-born population - Sweden (%)
Place of birth for the foreign-born population - United Kingdom (%)
Place of birth for the foreign-born population - England (%)
Place of birth for the foreign-born population - Scotland (%)
Place of birth for the foreign-born population - Other Northern Europe (%)
Place of birth for the foreign-born population - Austria (%)
Place of birth for the foreign-born population - Belgium (%)
Place of birth for the foreign-born population - France (%)
Place of birth for the foreign-born population - Germany (%)
Place of birth for the foreign-born population - Netherlands (%)
Place of birth for the foreign-born population - Switzerland (%)
Place of birth for the foreign-born population - Other Western Europe (%)
Place of birth for the foreign-born population - Greece (%)
Place of birth for the foreign-born population - Italy (%)
Place of birth for the foreign-born population - Portugal (%)
Place of birth for the foreign-born population - Spain (%)
Place of birth for the foreign-born population - Other Southern Europe (%)
Place of birth for the foreign-born population - Albania (%)
Place of birth for the foreign-born population - Belarus (%)
Place of birth for the foreign-born population - Bosnia and Herzegovina (%)
Place of birth for the foreign-born population - Bulgaria (%)
Place of birth for the foreign-born population - Croatia (%)
Place of birth for the foreign-born population - Czechoslovakia (%)
Place of birth for the foreign-born population - Hungary (%)
Place of birth for the foreign-born population - Latvia (%)
Place of birth for the foreign-born population - Lithuania (%)
Place of birth for the foreign-born population - North Macedonia (Macedonia) (%)
Place of birth for the foreign-born population - Moldova (%)
Place of birth for the foreign-born population - Poland (%)
Place of birth for the foreign-born population - Romania (%)
Place of birth for the foreign-born population - Russia (%)
Place of birth for the foreign-born population - Serbia (%)
Place of birth for the foreign-born population - Ukraine (%)
Place of birth for the foreign-born population - Other Eastern Europe (%)
Place of birth for the foreign-born population - China (%)
Place of birth for the foreign-born population - Hong Kong (%)
Place of birth for the foreign-born population - Taiwan (%)
Place of birth for the foreign-born population - Japan (%)
Place of birth for the foreign-born population - Korea (%)
Place of birth for the foreign-born population - Other Eastern Asia (%)
Place of birth for the foreign-born population - Afghanistan (%)
Place of birth for the foreign-born population - Bangladesh (%)
Place of birth for the foreign-born population - India (%)
Place of birth for the foreign-born population - Iran (%)
Place of birth for the foreign-born population - Kazakhstan (%)
Place of birth for the foreign-born population - Nepal (%)
Place of birth for the foreign-born population - Pakistan (%)
Place of birth for the foreign-born population - Sri Lanka (%)
Place of birth for the foreign-born population - Uzbekistan (%)
Place of birth for the foreign-born population - Other South Central Asia (%)
Place of birth for the foreign-born population - Burma (%)
Place of birth for the foreign-born population - Cambodia (%)
Place of birth for the foreign-born population - Indonesia (%)
Place of birth for the foreign-born population - Laos (%)
Place of birth for the foreign-born population - Malaysia (%)
Place of birth for the foreign-born population - Philippines (%)
Place of birth for the foreign-born population - Singapore (%)
Place of birth for the foreign-born population - Thailand (%)
Place of birth for the foreign-born population - Vietnam (%)
Place of birth for the foreign-born population - Other South Eastern Asia (%)
Place of birth for the foreign-born population - Armenia (%)
Place of birth for the foreign-born population - Iraq (%)
Place of birth for the foreign-born population - Israel (%)
Place of birth for the foreign-born population - Jordan (%)
Place of birth for the foreign-born population - Kuwait (%)
Place of birth for the foreign-born population - Lebanon (%)
Place of birth for the foreign-born population - Saudi Arabia (%)
Place of birth for the foreign-born population - Syria (%)
Place of birth for the foreign-born population - Turkey (%)
Place of birth for the foreign-born population - Yemen (%)
Place of birth for the foreign-born population - Other Western Asia (%)
Place of birth for the foreign-born population - Eritrea (%)
Place of birth for the foreign-born population - Ethiopia (%)
Place of birth for the foreign-born population - Kenya (%)
Place of birth for the foreign-born population - Somalia (%)
Place of birth for the foreign-born population - Uganda (%)
Place of birth for the foreign-born population - Zimbabwe (%)
Place of birth for the foreign-born population - Other Eastern Africa (%)
Place of birth for the foreign-born population - Cameroon (%)
Place of birth for the foreign-born population - Congo (%)
Place of birth for the foreign-born population - Democratic Republic of Congo (Zaire) (%)
Place of birth for the foreign-born population - Other Middle Africa (%)
Place of birth for the foreign-born population - Egypt (%)
Place of birth for the foreign-born population - Morocco (%)
Place of birth for the foreign-born population - Sudan (%)
Place of birth for the foreign-born population - Other Northern Africa (%)
Place of birth for the foreign-born population - South Africa (%)
Place of birth for the foreign-born population - Other Southern Africa (%)
Place of birth for the foreign-born population - Cabo Verde (%)
Place of birth for the foreign-born population - Ghana (%)
Place of birth for the foreign-born population - Liberia (%)
Place of birth for the foreign-born population - Nigeria (%)
Place of birth for the foreign-born population - Senegal (%)
Place of birth for the foreign-born population - Sierra Leone (%)
Place of birth for the foreign-born population - Other Western Africa (%)
Place of birth for the foreign-born population - Australia (%)
Place of birth for the foreign-born population - New Zealand (%)
Place of birth for the foreign-born population - Fiji (%)
Place of birth for the foreign-born population - Micronesia (%)
Place of birth for the foreign-born population - Bahamas (%)
Place of birth for the foreign-born population - Barbados (%)
Place of birth for the foreign-born population - Cuba (%)
Place of birth for the foreign-born population - Dominica (%)
Place of birth for the foreign-born population - Dominican Republic (%)
Place of birth for the foreign-born population - Grenada (%)
Place of birth for the foreign-born population - Haiti (%)
Place of birth for the foreign-born population - Jamaica (%)
Place of birth for the foreign-born population - St. Vincent and the Grenadines (%)
Place of birth for the foreign-born population - Trinidad and Tobago (%)
Place of birth for the foreign-born population - West Indies (%)
Place of birth for the foreign-born population - Other Caribbean (%)
Place of birth for the foreign-born population - Belize (%)
Place of birth for the foreign-born population - Costa Rica (%)
Place of birth for the foreign-born population - El Salvador (%)
Place of birth for the foreign-born population - Guatemala (%)
Place of birth for the foreign-born population - Honduras (%)
Place of birth for the foreign-born population - Mexico (%)
Place of birth for the foreign-born population - Nicaragua (%)
Place of birth for the foreign-born population - Panama (%)
Place of birth for the foreign-born population - Other Central America (%)
Place of birth for the foreign-born population - Argentina (%)
Place of birth for the foreign-born population - Bolivia (%)
Place of birth for the foreign-born population - Brazil (%)
Place of birth for the foreign-born population - Chile (%)
Place of birth for the foreign-born population - Colombia (%)
Place of birth for the foreign-born population - Ecuador (%)
Place of birth for the foreign-born population - Guyana (%)
Place of birth for the foreign-born population - Peru (%)
Place of birth for the foreign-born population - Uruguay (%)
Place of birth for the foreign-born population - Venezuela (%)
Place of birth for the foreign-born population - Other South America (%)
Place of birth for the foreign-born population - Canada (%)
Place of birth for the foreign-born population - Other Northern America (%)
Place of birth for the foreign-born population - Other (%)
Latest news about races in Lebanon, OH collected exclusively by city-data.com from local newspapers, TV, and radio stations
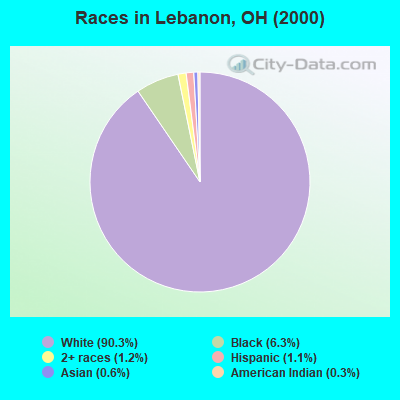
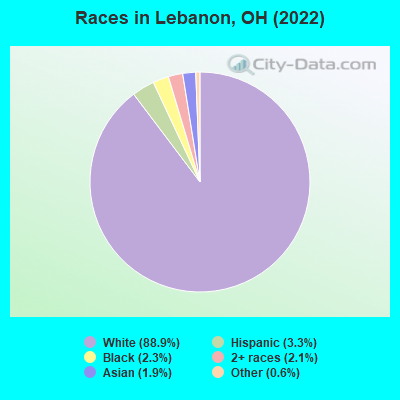
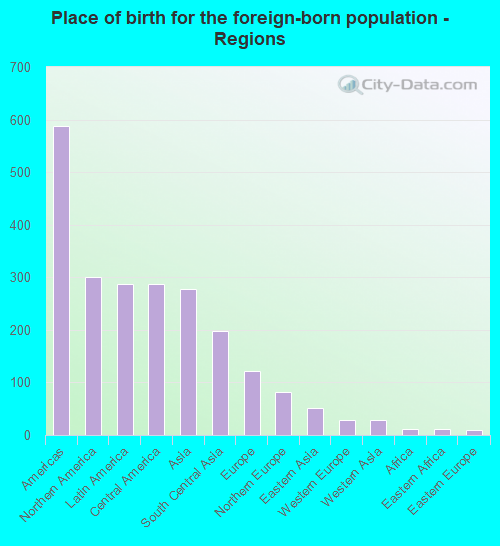
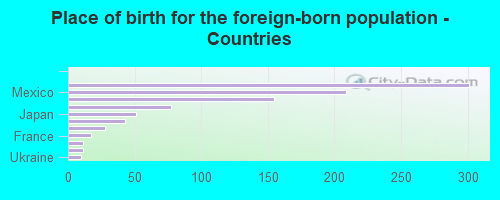
According to 2022 data, the most numerous races in Lebanon, OH are White alone (19,175 residents), Black alone (500 residents), and Two or more races (453 residents). 96.1% of Lebanon residents speak English at home. 4.6% of Lebanon, OH residents are foreign-born (1.4% born in North America, 1.3% born in Latin America, 1.3% born in Asia, 0.6% born in Europe), which is 13.7% greater than the foreign-born rate of 4.0% across the entire state of Ohio.
Race distribution in Lebanon
2000 2022
9,538,111 84.0% White alone 1,290,662 11.4% Black alone 217,123 1.9% Hispanic 137,770 1.2% Two or more races 131,670 1.2% Asian alone 21,985 0.2% American Indian alone 13,483 0.1% Other race alone 2,336 0.02% Native Hawaiian and Other
8,948,793 76.1% White alone 1,401,403 11.9% Black alone 529,291 4.5% Two or more races 517,232 4.4% Hispanic 293,387 2.5% Asian alone 52,805 0.4% Other race alone 9,785 0.08% American Indian alone 3,362 0.03% Native Hawaiian and Other
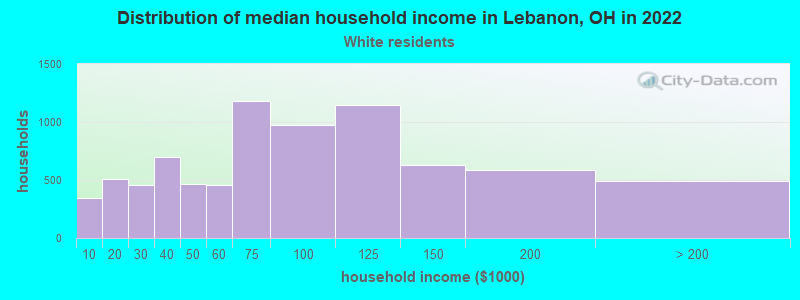
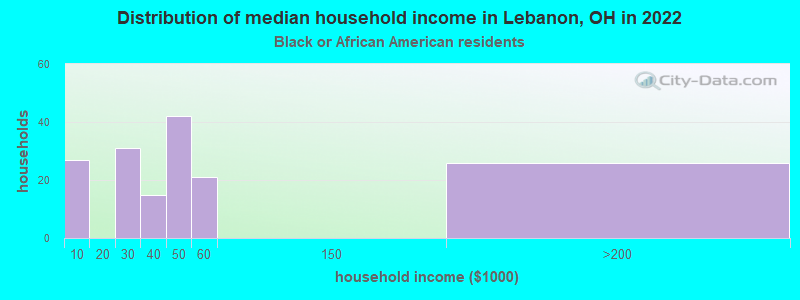
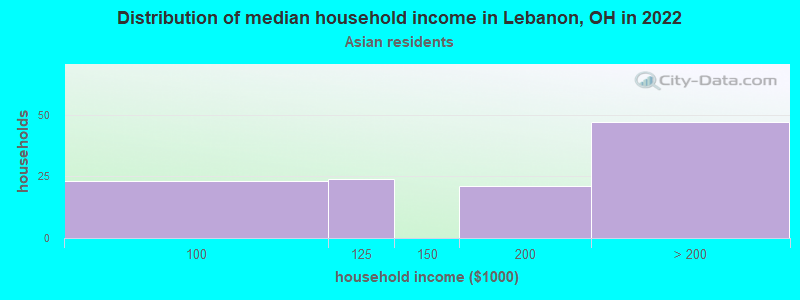
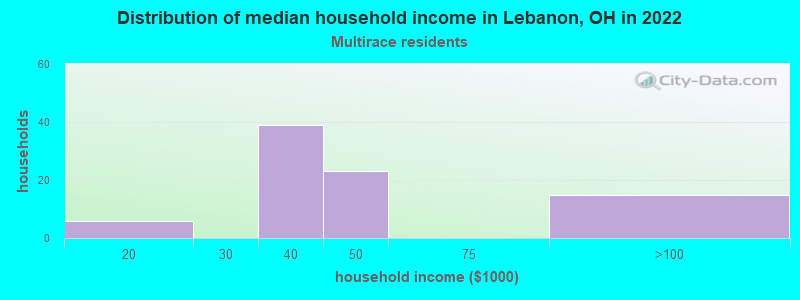
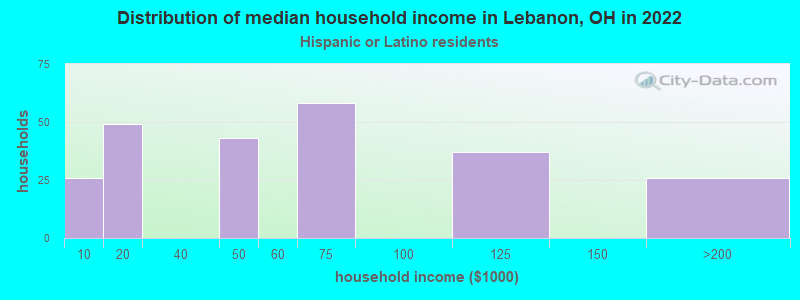
Income and house value in Lebanon Median household income in 2022 $76,022 White non-Hispanic householders$50,517 Black householders$171,479 Asian householders$37,123 Two or more races householdersMedian 2022 house value $273,346 White Non-Hispanic householders$229,543 Black or African American householders$394,857 American Indian or Alaska Native householders $312,937 Asian householders$236,914 Some other race householders$68,441 Two or more races householders$322,414 Hispanic or Latino householders
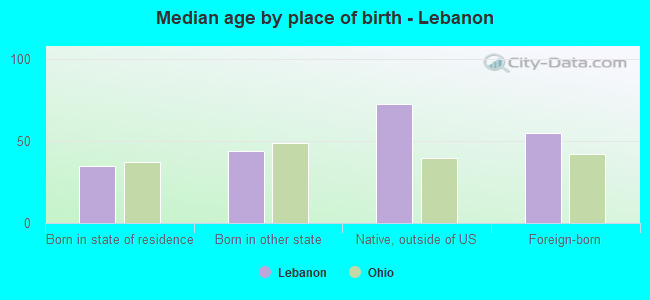
Median age by race in Lebanon
38.2 Median age for White residents37.4 38.9 61.9 Median age for Black or African American residents50.3 61.3 -676,818,950.3 Median age for American Indian / Alaska Native residents-685,185,184.5 -1,189,189,188.0 41.5 Median age for Asian residents41.0 41.9 -666,666,666.0 Median age for Native Hawaiian / Pacific Islander residents-666,666,666.0 -666,666,666.0 35.4 Median age for Other race residents5.5 -755,178,907.0 17.0 Median age for Two or more races residents12.9 15.6 38.3 Median age for White alone residents37.4 39.5 43.1 Median age for Hispanic or Latino residents45.1 22.9
Owner/renter occupied households by race in Lebanon
House owners and renters - White residents 4,907 63.7% Owner occupied2,793 36.3% Renter occupiedHouse owners and renters - Black or African American residents 98 46.2% Owner occupied114 53.8% Renter occupiedHouse owners and renters - Asian residents 165 100.0% Owner occupiedHouse owners and renters - Other race residents 21 43.6% Owner occupied28 56.4% Renter occupiedHouse owners and renters - Two or more races residents 37 48.5% Owner occupied39 51.5% Renter occupiedHouse owners and renters - White alone residents 4,831 63.7% Owner occupied2,748 36.3% Renter occupiedHouse owners and renters - Hispanic or Latino residents 112 64.6% Owner occupied62 35.4% Renter occupied
Language usage in Lebanon
English speakers - Total 96.1% of residents of Lebanon speak English at home.
2.2% of residents speak Spanish at home 125 28.5% Speak English very well314 71.5% Speak English less than very well1.5% of residents speak other language at home 198 66.7% Speak English very well99 33.3% Speak English less than very well
English speakers - Born in the United States 97.7% of residents of Lebanon speak English at home.
2.8% of residents speak Spanish at home 100 72.5% Speak English very well38 27.5% Speak English less than very well0.4% of residents speak other language at home 20 100.0% Speak English very well
English speakers - Native, born elsewhere 82.6% of residents of Lebanon speak English at home.
English speakers - Foreign-born 60.6% of residents of Lebanon speak English at home.
19.4% of residents speak Spanish at home 35 16.2% Speak English very well181 83.8% Speak English less than very well17.5% of residents speak other language at home 99 50.8% Speak English very well96 49.2% Speak English less than very well
White (Caucasian) - Speak only English Native:
99.6% (17,719)Foreign-born:
66.1% (399)
White (Caucasian) - Speak another language Native:
0.6% (113)Foreign-born:
38.5% (232)
Asian - Speak only English Native:
83.5% (77)Foreign-born:
40.0% (106)
Asian - Speak another language Native:
23.5% (22)Foreign-born:
64.0% (169)
White alone - Speak only English Native:
99.9% (17,482)Foreign-born:
96.1% (416)
White alone - Speak another language Native:
0.3% (57)Foreign-born:
5.7% (25)
Hispanic or Latino - Speak another language Native:
34.0% (161)Foreign-born:
100.0% (202)
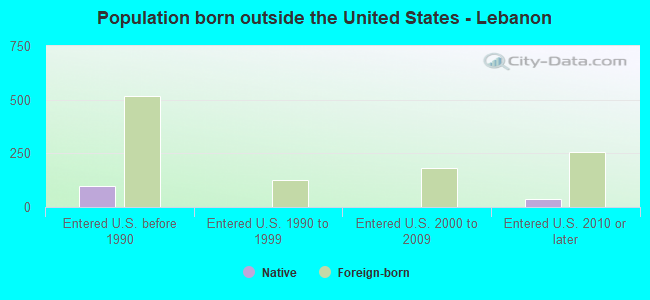
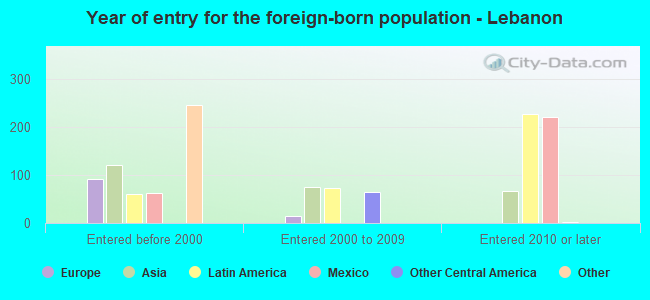
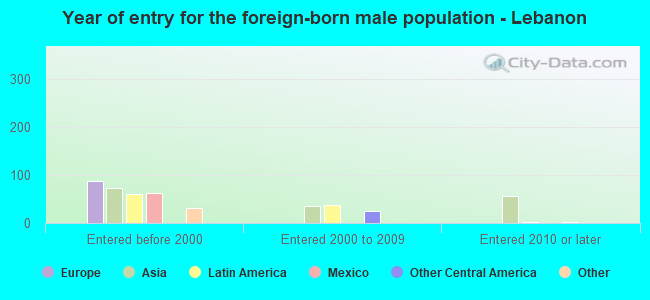
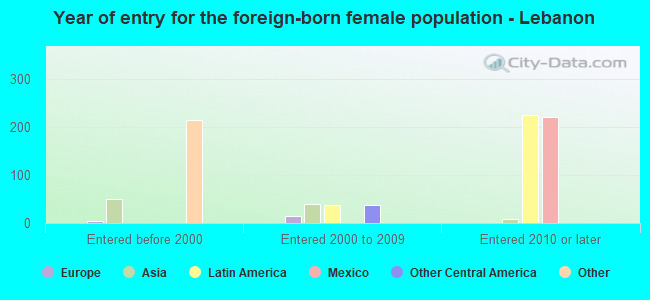
Foreign-born residents in Lebanon 1,000 residents are foreign born (1.4% North America , 1.3% Latin America , 1.3% Asia , 0.6% Europe ).
Marital status for residents in Lebanon Marital status - White (Caucasian) population 15 years and over
Males 28.0% Never married58.7% Now married1.0% Separated3.5% Widowed8.7% DivorcedFemales 22.8% Never married52.9% Now married0.3% Separated7.1% Widowed16.9% DivorcedWomen who gave birth in the past 12 months Now married:
96.2% (175)Unmarried:
3.8% (7)
Women who did not give birth in the past 12 months Now married:
45.3% (1,972)Unmarried:
54.7% (2,384)
Marital status - Black or African American population 15 years and over
Males 64.8% Never married14.8% Now married3.5% Separated0.0% Widowed16.8% DivorcedFemales 28.8% Never married16.9% Now married0.0% Separated32.8% Widowed21.5% DivorcedWomen who did not give birth in the past 12 months Now married:
48.1% (13)Unmarried:
51.9% (14)
Marital status - Asian population 15 years and over
Males 0.0% Never married100.0% Now married0.0% Separated0.0% Widowed0.0% DivorcedFemales 11.0% Never married74.7% Now married0.0% Separated0.0% Widowed14.3% DivorcedWomen who did not give birth in the past 12 months Now married:
55.7% (53)Unmarried:
44.3% (42)
Marital status - Other race population 15 years and over
Males 0.0% Never married100.0% Now married0.0% Separated0.0% Widowed0.0% DivorcedFemales 0.0% Never married100.0% Now married0.0% Separated0.0% Widowed0.0% DivorcedWomen who did not give birth in the past 12 months Now married:
100.0% (32)Unmarried:
0.0% (0)
Marital status - Two or more races population 15 years and over
Males 79.2% Never married20.8% Now married0.0% Separated0.0% Widowed0.0% DivorcedFemales 67.0% Never married7.8% Now married0.0% Separated0.0% Widowed25.2% DivorcedWomen who gave birth in the past 12 months Now married:
0.0% (0)Unmarried:
100.0% (9)
Women who did not give birth in the past 12 months Now married:
0.0% (0)Unmarried:
100.0% (89)
Marital status - White alone, not Hispanic / Latino population 15 years and over
Males 28.7% Never married57.7% Now married1.1% Separated3.6% Widowed9.0% DivorcedFemales 22.1% Never married53.0% Now married0.4% Separated7.4% Widowed17.1% DivorcedWomen who gave birth in the past 12 months Now married:
96.2% (178)Unmarried:
3.8% (7)
Women who did not give birth in the past 12 months Now married:
44.6% (1,848)Unmarried:
55.4% (2,297)
Marital status - Hispanic or Latino population 15 years and over
Males 4.9% Never married95.1% Now married0.0% Separated0.0% Widowed0.0% DivorcedFemales 40.1% Never married49.8% Now married0.0% Separated0.0% Widowed10.1% DivorcedWomen who did not give birth in the past 12 months Now married:
55.4% (166)Unmarried:
44.6% (133)
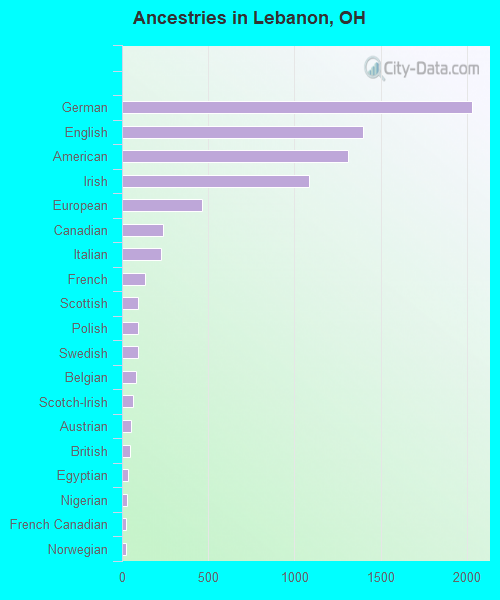
Ancestries in Lebanon
2,027 21.8% German1,399 15.1% English1,312 14.1% American1,086 11.7% Irish463 5.0% European235 2.5% Canadian228 2.5% Italian131 1.4% French91 1.0% Scottish90 1.0% Polish90 1.0% Swedish80 0.9% Belgian63 0.7% Scotch-Irish51 0.5% Austrian46 0.5% British32 0.3% Egyptian30 0.3% Nigerian22 0.2% French Canadian21 0.2% Norwegian11 0.1% African10 0.1% Russian9 0.10% Hungarian8 0.09% Syrian
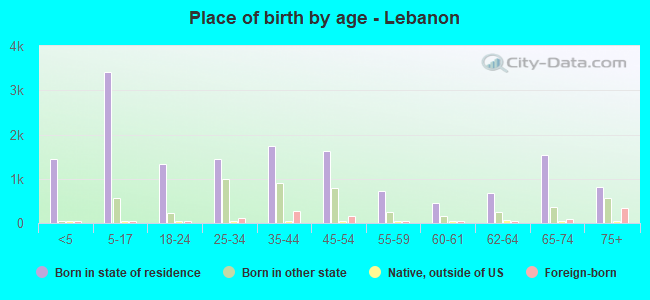
Children Nativity (place of birth) in Lebanon
Children under 6 years - Living with two parents Both parents native 1,108 100.0% NativeBoth parents foreign-born 53 100.0% NativeOne native, one foreign-born parent 33 100.0% NativeChildren under 6 years - Living with one parent Native parent 523 100.0% NativeChildren 6 to 17 years - Living with two parents Both parents native 2,283 100.0% NativeBoth parents foreign-born 138 77.9% Native39 22.1% Foreign-bornOne native, one foreign-born parent 83 100.0% NativeChildren 6 to 17 years - Living with one parent Native parent 691 100.0% NativeForeign-born parent 35 68.3% Native16 31.7% Foreign-born
Grandparents responsible for own grandchildren in Lebanon
Grandparents (30 to 59 years) White / Caucasian 52 71.0% Responsible for grandchildren21 29.0% Not responsible for grandchildrenWhite alone, not Hispanic / Latino 52 69.4% Responsible for grandchildren23 30.6% Not responsible for grandchildrenGrandparents (60 years and over) White / Caucasian 57 32.2% Responsible for grandchildren119 67.8% Not responsible for grandchildrenWhite alone, not Hispanic / Latino 57 32.9% Responsible for grandchildren116 67.1% Not responsible for grandchildren