Races in Lantana, Florida (FL) Detailed Stats
Data:
Races - White alone (%)
Races - White alone (% change since 2000)
Races - Black alone (%)
Races - Black alone (% change since 2000)
Races - American Indian alone (%)
Races - American Indian alone (% change since 2000)
Races - Asian alone (%)
Races - Asian alone (% change since 2000)
Races - Hispanic (%)
Races - Hispanic (% change since 2000)
Races - Native Hawaiian and Other Pacific Islander alone (%)
Races - Native Hawaiian and Other Pacific Islander alone (% change since 2000)
Races - Two or more races(%)
Races - Two or more races(% change since 2000)
Races - Other race alone (%)
Races - Other race alone (% change since 2000)
Racial diversity
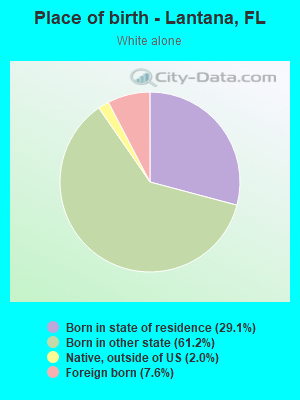
Place of birth - Born in state of residence (%)
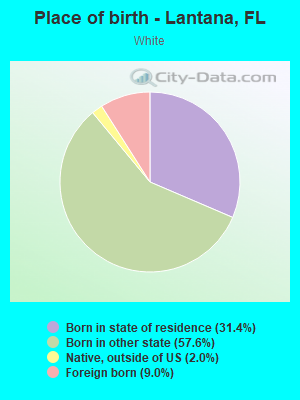
Place of birth - Born in state of residence (%) - White
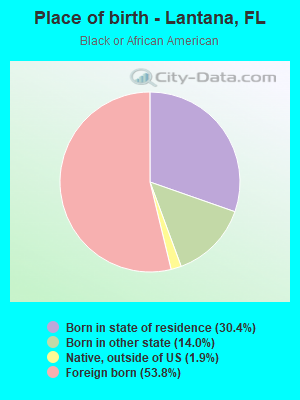
Place of birth - Born in state of residence (%) - Black or African American
Place of birth - Born in state of residence (%) - Asian
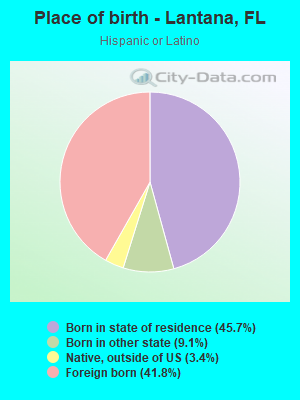
Place of birth - Born in state of residence (%) - Hispanic or Latino
Place of birth - Born in state of residence (%) - American Indian and Alaska Native
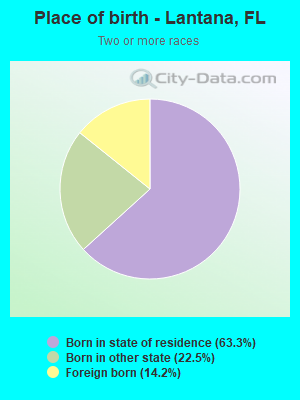
Place of birth - Born in state of residence (%) - Multirace
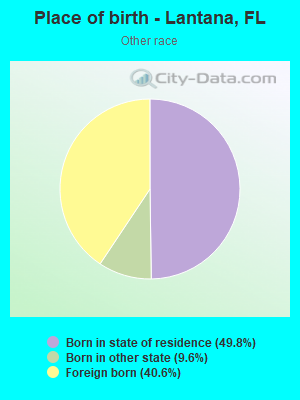
Place of birth - Born in state of residence (%) - Other Race
Place of birth - Born in other state (%)
Place of birth - Born in other state (%) - White
Place of birth - Born in other state (%) - Black or African American
Place of birth - Born in other state (%) - Asian
Place of birth - Born in other state (%) - Hispanic or Latino
Place of birth - Born in other state (%) - American Indian and Alaska Native
Place of birth - Born in other state (%) - Multirace
Place of birth - Born in other state (%) - Other Race
Place of birth - Native, outside of US (%)
Place of birth - Native, outside of US (%) - White
Place of birth - Native, outside of US (%) - Black or African American
Place of birth - Native, outside of US (%) - Asian
Place of birth - Native, outside of US (%) - Hispanic or Latino
Place of birth - Native, outside of US (%) - American Indian and Alaska Native
Place of birth - Native, outside of US (%) - Multirace
Place of birth - Native, outside of US (%) - Other Race
Place of birth - Foreign born (%)
Place of birth - Foreign born (%) - White
Place of birth - Foreign born (%) - Black or African American
Place of birth - Foreign born (%) - Asian
Place of birth - Foreign born (%) - Hispanic or Latino
Place of birth - Foreign born (%) - American Indian and Alaska Native
Place of birth - Foreign born (%) - Multirace
Place of birth - Foreign born (%) - Other Race
Residents speaking English at home (%)
Residents speaking English at home - Born in the United States (%)
Residents speaking English at home - Native, born elsewhere (%)
Residents speaking English at home - Foreign born (%)
Residents speaking Spanish at home (%)
Residents speaking Spanish at home - Born in the United States (%)
Residents speaking Spanish at home - Native, born elsewhere (%)
Residents speaking Spanish at home - Foreign born (%)
Residents speaking other language at home (%)
Residents speaking other language at home - Born in the United States (%)
Residents speaking other language at home - Native, born elsewhere (%)
Residents speaking other language at home - Foreign born (%)
Marital status - Never married (%)
Marital status - Now married (%)
Marital status - Separated (%)
Marital status - Widowed (%)
Marital status - Divorced (%)
Ancestries Reported - Arab (%)
Ancestries Reported - Czech (%)
Ancestries Reported - Danish (%)
Ancestries Reported - Dutch (%)
Ancestries Reported - English (%)
Ancestries Reported - French (%)
Ancestries Reported - French Canadian (%)
Ancestries Reported - German (%)
Ancestries Reported - Greek (%)
Ancestries Reported - Hungarian (%)
Ancestries Reported - Irish (%)
Ancestries Reported - Italian (%)
Ancestries Reported - Lithuanian (%)
Ancestries Reported - Norwegian (%)
Ancestries Reported - Polish (%)
Ancestries Reported - Portuguese (%)
Ancestries Reported - Russian (%)
Ancestries Reported - Scotch-Irish (%)
Ancestries Reported - Scottish (%)
Ancestries Reported - Slovak (%)
Ancestries Reported - Subsaharan African (%)
Ancestries Reported - Swedish (%)
Ancestries Reported - Swiss (%)
Ancestries Reported - Ukrainian (%)
Ancestries Reported - United States (%)
Ancestries Reported - Welsh (%)
Ancestries Reported - West Indian (%)
Ancestries Reported - Other (%)
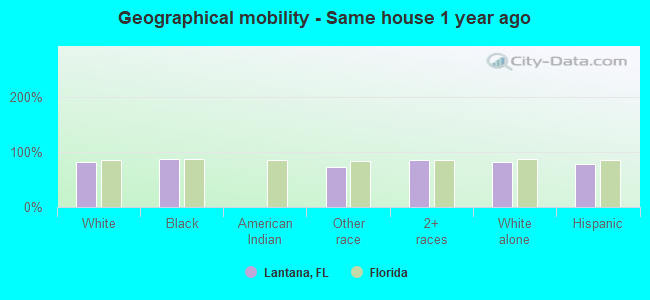
Geographical mobility - Same house 1 year ago (%)
Geographical mobility - Same house 1 year ago (%) - White
Geographical mobility - Same house 1 year ago (%) - Black or African American
Geographical mobility - Same house 1 year ago (%) - Asian
Geographical mobility - Same house 1 year ago (%) - Hispanic or Latino
Geographical mobility - Same house 1 year ago (%) - American Indian and Alaska Native
Geographical mobility - Same house 1 year ago (%) - Multirace
Geographical mobility - Same house 1 year ago (%) - Other Race
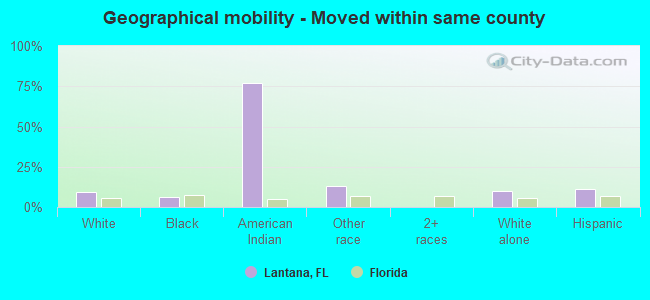
Geographical mobility - Moved within same county (%)
Geographical mobility - Moved within same county (%) - White
Geographical mobility - Moved within same county (%) - Black or African American
Geographical mobility - Moved within same county (%) - Asian
Geographical mobility - Moved within same county (%) - Hispanic or Latino
Geographical mobility - Moved within same county (%) - American Indian and Alaska Native
Geographical mobility - Moved within same county (%) - Multirace
Geographical mobility - Moved within same county (%) - Other Race
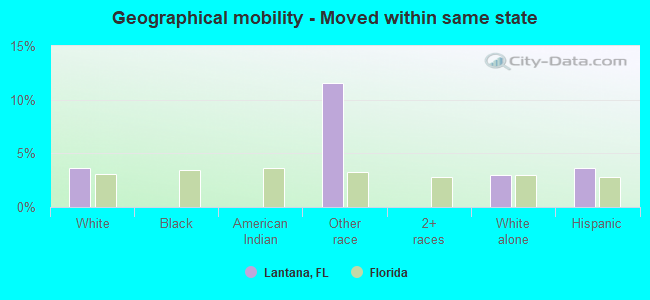
Geographical mobility - Moved from different county within same state (%)
Geographical mobility - Moved from different county within same state (%) - White
Geographical mobility - Moved from different county within same state (%) - Black or African American
Geographical mobility - Moved from different county within same state (%) - Asian
Geographical mobility - Moved from different county within same state (%) - Hispanic or Latino
Geographical mobility - Moved from different county within same state (%) - American Indian and Alaska Native
Geographical mobility - Moved from different county within same state (%) - Multirace
Geographical mobility - Moved from different county within same state (%) - Other Race
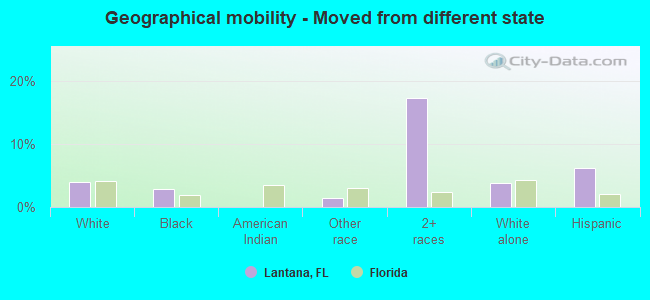
Geographical mobility - Moved from different state (%)
Geographical mobility - Moved from different state (%) - White
Geographical mobility - Moved from different state (%) - Black or African American
Geographical mobility - Moved from different state (%) - Asian
Geographical mobility - Moved from different state (%) - Hispanic or Latino
Geographical mobility - Moved from different state (%) - American Indian and Alaska Native
Geographical mobility - Moved from different state (%) - Multirace
Geographical mobility - Moved from different state (%) - Other Race
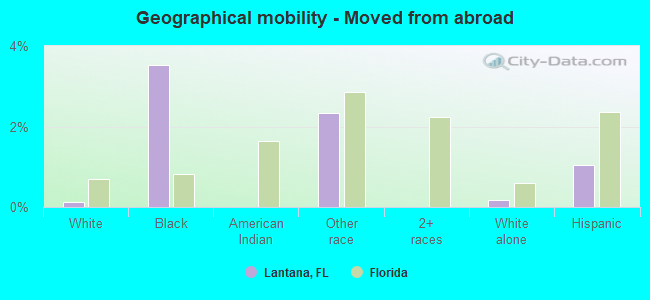
Geographical mobility - Moved from abroad (%)
Geographical mobility - Moved from abroad (%) - White
Geographical mobility - Moved from abroad (%) - Black or African American
Geographical mobility - Moved from abroad (%) - Asian
Geographical mobility - Moved from abroad (%) - Hispanic or Latino
Geographical mobility - Moved from abroad (%) - American Indian and Alaska Native
Geographical mobility - Moved from abroad (%) - Multirace
Geographical mobility - Moved from abroad (%) - Other Race
Place of birth for the foreign-born population - Ireland (%)
Place of birth for the foreign-born population - Denmark (%)
Place of birth for the foreign-born population - Norway (%)
Place of birth for the foreign-born population - Sweden (%)
Place of birth for the foreign-born population - United Kingdom (%)
Place of birth for the foreign-born population - England (%)
Place of birth for the foreign-born population - Scotland (%)
Place of birth for the foreign-born population - Other Northern Europe (%)
Place of birth for the foreign-born population - Austria (%)
Place of birth for the foreign-born population - Belgium (%)
Place of birth for the foreign-born population - France (%)
Place of birth for the foreign-born population - Germany (%)
Place of birth for the foreign-born population - Netherlands (%)
Place of birth for the foreign-born population - Switzerland (%)
Place of birth for the foreign-born population - Other Western Europe (%)
Place of birth for the foreign-born population - Greece (%)
Place of birth for the foreign-born population - Italy (%)
Place of birth for the foreign-born population - Portugal (%)
Place of birth for the foreign-born population - Spain (%)
Place of birth for the foreign-born population - Other Southern Europe (%)
Place of birth for the foreign-born population - Albania (%)
Place of birth for the foreign-born population - Belarus (%)
Place of birth for the foreign-born population - Bosnia and Herzegovina (%)
Place of birth for the foreign-born population - Bulgaria (%)
Place of birth for the foreign-born population - Croatia (%)
Place of birth for the foreign-born population - Czechoslovakia (%)
Place of birth for the foreign-born population - Hungary (%)
Place of birth for the foreign-born population - Latvia (%)
Place of birth for the foreign-born population - Lithuania (%)
Place of birth for the foreign-born population - North Macedonia (Macedonia) (%)
Place of birth for the foreign-born population - Moldova (%)
Place of birth for the foreign-born population - Poland (%)
Place of birth for the foreign-born population - Romania (%)
Place of birth for the foreign-born population - Russia (%)
Place of birth for the foreign-born population - Serbia (%)
Place of birth for the foreign-born population - Ukraine (%)
Place of birth for the foreign-born population - Other Eastern Europe (%)
Place of birth for the foreign-born population - China (%)
Place of birth for the foreign-born population - Hong Kong (%)
Place of birth for the foreign-born population - Taiwan (%)
Place of birth for the foreign-born population - Japan (%)
Place of birth for the foreign-born population - Korea (%)
Place of birth for the foreign-born population - Other Eastern Asia (%)
Place of birth for the foreign-born population - Afghanistan (%)
Place of birth for the foreign-born population - Bangladesh (%)
Place of birth for the foreign-born population - India (%)
Place of birth for the foreign-born population - Iran (%)
Place of birth for the foreign-born population - Kazakhstan (%)
Place of birth for the foreign-born population - Nepal (%)
Place of birth for the foreign-born population - Pakistan (%)
Place of birth for the foreign-born population - Sri Lanka (%)
Place of birth for the foreign-born population - Uzbekistan (%)
Place of birth for the foreign-born population - Other South Central Asia (%)
Place of birth for the foreign-born population - Burma (%)
Place of birth for the foreign-born population - Cambodia (%)
Place of birth for the foreign-born population - Indonesia (%)
Place of birth for the foreign-born population - Laos (%)
Place of birth for the foreign-born population - Malaysia (%)
Place of birth for the foreign-born population - Philippines (%)
Place of birth for the foreign-born population - Singapore (%)
Place of birth for the foreign-born population - Thailand (%)
Place of birth for the foreign-born population - Vietnam (%)
Place of birth for the foreign-born population - Other South Eastern Asia (%)
Place of birth for the foreign-born population - Armenia (%)
Place of birth for the foreign-born population - Iraq (%)
Place of birth for the foreign-born population - Israel (%)
Place of birth for the foreign-born population - Jordan (%)
Place of birth for the foreign-born population - Kuwait (%)
Place of birth for the foreign-born population - Lebanon (%)
Place of birth for the foreign-born population - Saudi Arabia (%)
Place of birth for the foreign-born population - Syria (%)
Place of birth for the foreign-born population - Turkey (%)
Place of birth for the foreign-born population - Yemen (%)
Place of birth for the foreign-born population - Other Western Asia (%)
Place of birth for the foreign-born population - Eritrea (%)
Place of birth for the foreign-born population - Ethiopia (%)
Place of birth for the foreign-born population - Kenya (%)
Place of birth for the foreign-born population - Somalia (%)
Place of birth for the foreign-born population - Uganda (%)
Place of birth for the foreign-born population - Zimbabwe (%)
Place of birth for the foreign-born population - Other Eastern Africa (%)
Place of birth for the foreign-born population - Cameroon (%)
Place of birth for the foreign-born population - Congo (%)
Place of birth for the foreign-born population - Democratic Republic of Congo (Zaire) (%)
Place of birth for the foreign-born population - Other Middle Africa (%)
Place of birth for the foreign-born population - Egypt (%)
Place of birth for the foreign-born population - Morocco (%)
Place of birth for the foreign-born population - Sudan (%)
Place of birth for the foreign-born population - Other Northern Africa (%)
Place of birth for the foreign-born population - South Africa (%)
Place of birth for the foreign-born population - Other Southern Africa (%)
Place of birth for the foreign-born population - Cabo Verde (%)
Place of birth for the foreign-born population - Ghana (%)
Place of birth for the foreign-born population - Liberia (%)
Place of birth for the foreign-born population - Nigeria (%)
Place of birth for the foreign-born population - Senegal (%)
Place of birth for the foreign-born population - Sierra Leone (%)
Place of birth for the foreign-born population - Other Western Africa (%)
Place of birth for the foreign-born population - Australia (%)
Place of birth for the foreign-born population - New Zealand (%)
Place of birth for the foreign-born population - Fiji (%)
Place of birth for the foreign-born population - Micronesia (%)
Place of birth for the foreign-born population - Bahamas (%)
Place of birth for the foreign-born population - Barbados (%)
Place of birth for the foreign-born population - Cuba (%)
Place of birth for the foreign-born population - Dominica (%)
Place of birth for the foreign-born population - Dominican Republic (%)
Place of birth for the foreign-born population - Grenada (%)
Place of birth for the foreign-born population - Haiti (%)
Place of birth for the foreign-born population - Jamaica (%)
Place of birth for the foreign-born population - St. Vincent and the Grenadines (%)
Place of birth for the foreign-born population - Trinidad and Tobago (%)
Place of birth for the foreign-born population - West Indies (%)
Place of birth for the foreign-born population - Other Caribbean (%)
Place of birth for the foreign-born population - Belize (%)
Place of birth for the foreign-born population - Costa Rica (%)
Place of birth for the foreign-born population - El Salvador (%)
Place of birth for the foreign-born population - Guatemala (%)
Place of birth for the foreign-born population - Honduras (%)
Place of birth for the foreign-born population - Mexico (%)
Place of birth for the foreign-born population - Nicaragua (%)
Place of birth for the foreign-born population - Panama (%)
Place of birth for the foreign-born population - Other Central America (%)
Place of birth for the foreign-born population - Argentina (%)
Place of birth for the foreign-born population - Bolivia (%)
Place of birth for the foreign-born population - Brazil (%)
Place of birth for the foreign-born population - Chile (%)
Place of birth for the foreign-born population - Colombia (%)
Place of birth for the foreign-born population - Ecuador (%)
Place of birth for the foreign-born population - Guyana (%)
Place of birth for the foreign-born population - Peru (%)
Place of birth for the foreign-born population - Uruguay (%)
Place of birth for the foreign-born population - Venezuela (%)
Place of birth for the foreign-born population - Other South America (%)
Place of birth for the foreign-born population - Canada (%)
Place of birth for the foreign-born population - Other Northern America (%)
Place of birth for the foreign-born population - Other (%)
Latest news about races in Lantana, FL collected exclusively by city-data.com from local newspapers, TV, and radio stations
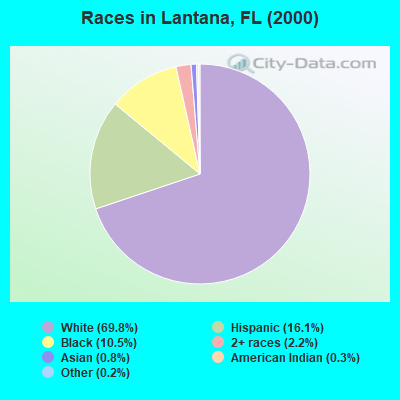
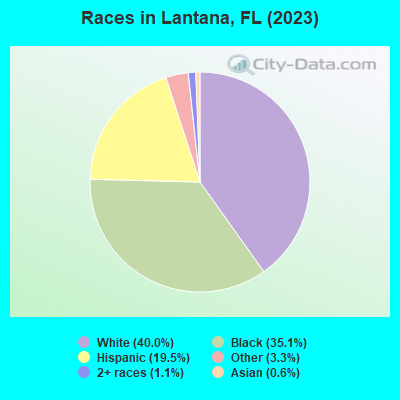
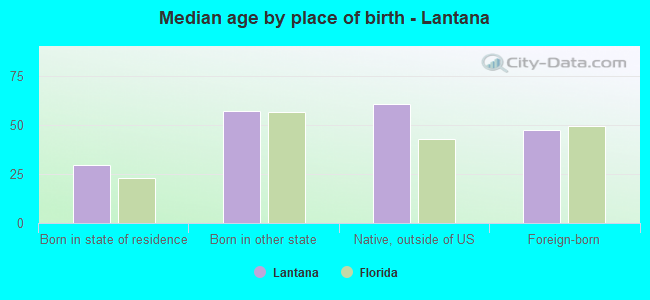
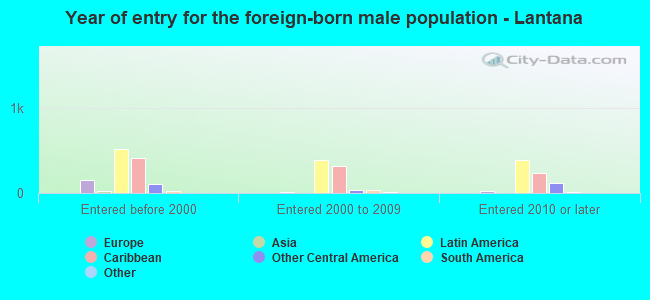
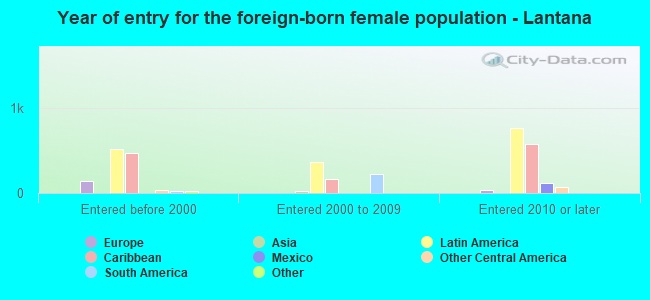
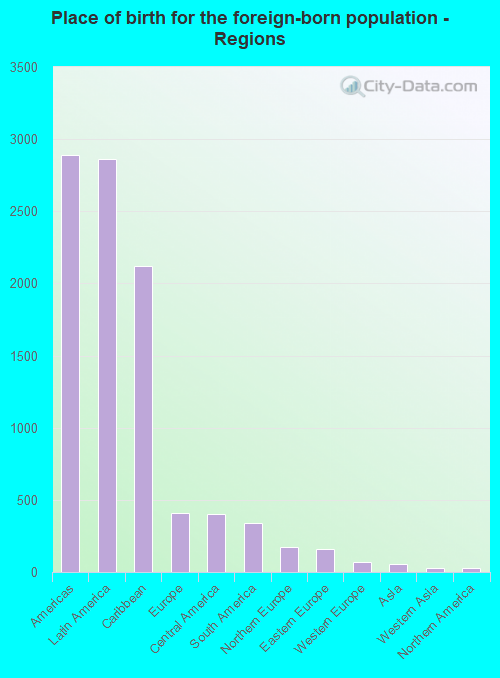
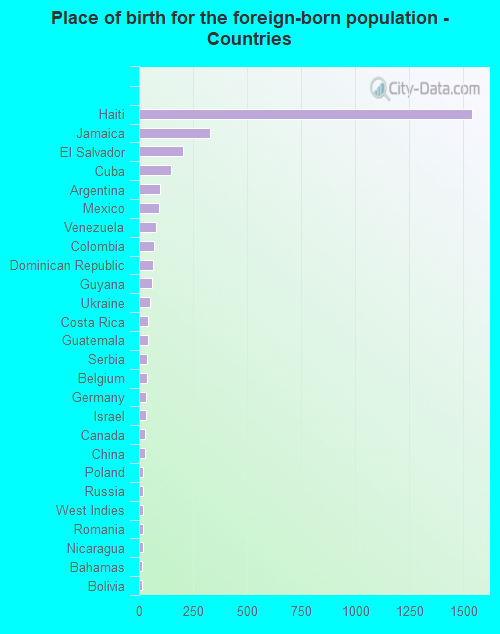
According to 2022 data, the most numerous races in Lantana, FL are White alone (5,370 residents), Hispanic (2,221 residents), and Black alone (3,598 residents). 63.3% of Lantana residents speak English at home. 28.3% of Lantana, FL residents are foreign-born (23.6% born in Latin America, 3.4% born in Europe), which is 25.9% greater than the foreign-born rate of 21.0% across the entire state of Florida.
Race distribution in Lantana
2000 2022
10,458,509 65.4% White alone 2,682,715 16.8% Hispanic 2,264,268 14.2% Black alone 261,693 1.6% Asian alone 236,954 1.5% Two or more races 42,358 0.3% American Indian alone 28,994 0.2% Other race alone 6,887 0.04% Native Hawaiian and Other
11,309,403 50.8% White alone 6,025,039 27.1% Hispanic 3,241,015 14.6% Black alone 861,630 3.9% Two or more races 623,692 2.8% Asian alone 152,054 0.7% Other race alone 22,504 0.1% American Indian alone 9,486 0.04% Native Hawaiian and Other
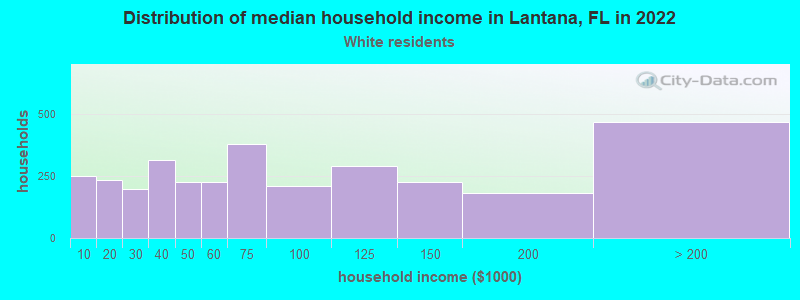
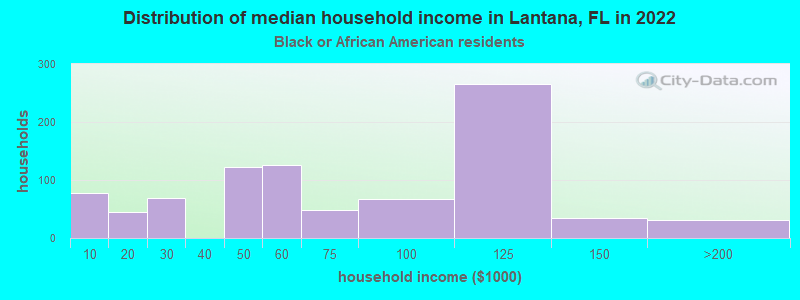
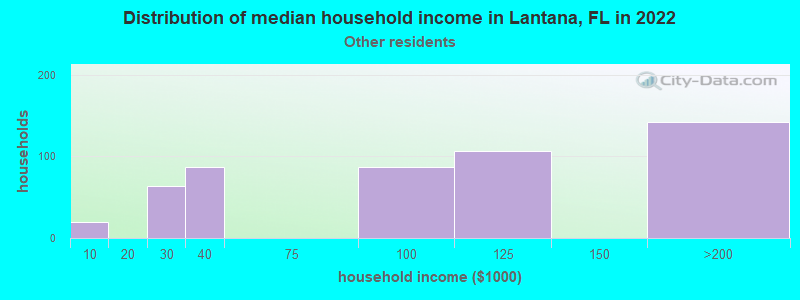
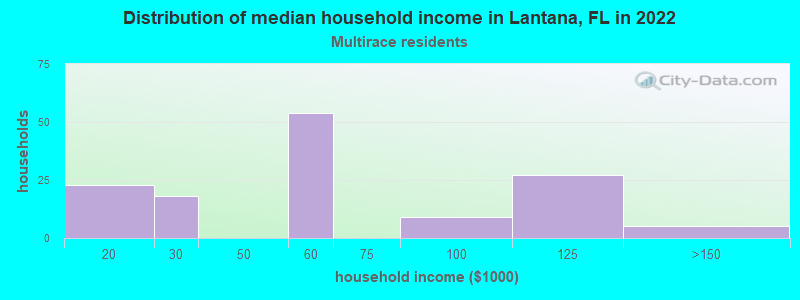
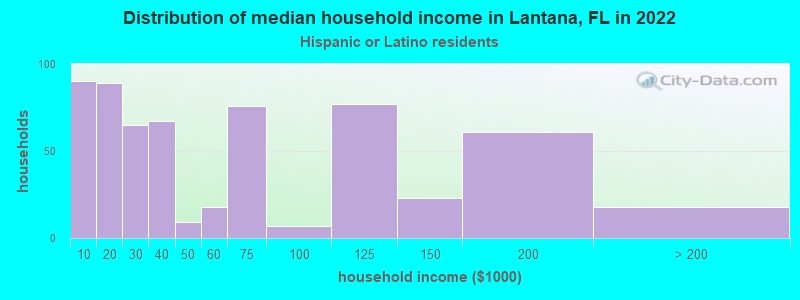
Income and house value in Lantana Median household income in 2022 $68,500 White non-Hispanic householders$59,827 Black householders$105,582 Some other race householders$51,993 Two or more races householders$40,106 Hispanic or Latino race householdersMedian 2022 house value $377,030 White Non-Hispanic householders$399,946 Black or African American householders$374,868 Some other race householders$351,520 Two or more races householders$367,085 Hispanic or Latino householders
Median age by race in Lantana
54.5 Median age for White residents53.4 54.8 35.7 Median age for Black or African American residents28.9 41.9 -724,168,912.1 Median age for American Indian / Alaska Native residents-806,112,702.2 -660,098,521.5 -679,040,989.3 Median age for Asian residents-707,317,072.5 -674,277,016.1 -674,285,713.6 Median age for Native Hawaiian / Pacific Islander residents-674,264,006.9 -672,397,325.0 30.6 Median age for Other race residents25.7 31.2 33.4 Median age for Two or more races residents27.2 33.9 54.2 Median age for White alone residents53.3 57.7 32.7 Median age for Hispanic or Latino residents26.1 33.7
Owner/renter occupied households by race in Lantana
House owners and renters - White residents 1,967 62.2% Owner occupied1,194 37.8% Renter occupiedHouse owners and renters - Black or African American residents 414 45.3% Owner occupied500 54.7% Renter occupiedHouse owners and renters - American Indian / Alaska Native residents 10 100.0% Renter occupiedHouse owners and renters - Other race residents 377 82.8% Owner occupied78 17.2% Renter occupiedHouse owners and renters - Two or more races residents 116 80.6% Owner occupied28 19.4% Renter occupiedHouse owners and renters - White alone residents 1,977 63.6% Owner occupied1,130 36.4% Renter occupiedHouse owners and renters - Hispanic or Latino residents 268 44.2% Owner occupied339 55.8% Renter occupied
Language usage in Lantana
English speakers - Total 63.3% of residents of Lantana speak English at home.
12.6% of residents speak Spanish at home 906 63.3% Speak English very well525 36.7% Speak English less than very well24.2% of residents speak other language at home 1,493 54.1% Speak English very well1,266 45.9% Speak English less than very well
English speakers - Born in the United States 97.0% of residents of Lantana speak English at home.
1.8% of residents speak Spanish at home 60 83.3% Speak English very well12 16.7% Speak English less than very well1.5% of residents speak other language at home 61 100.0% Speak English very well
English speakers - Native, born elsewhere 43.4% of residents of Lantana speak English at home.
10.0% of residents speak Spanish at home 25 100.0% Speak English very well37.3% of residents speak other language at home 93 100.0% Speak English very well
English speakers - Foreign-born 16.2% of residents of Lantana speak English at home.
23.6% of residents speak Spanish at home 387 48.7% Speak English very well407 51.3% Speak English less than very well60.7% of residents speak other language at home 950 46.6% Speak English very well1,089 53.4% Speak English less than very well
White (Caucasian) - Speak only English Native:
94.8% (4,822)Foreign-born:
21.4% (111)
White (Caucasian) - Speak another language Native:
5.6% (287)Foreign-born:
73.0% (378)
Black or African American - Speak only English Native:
70.0% (1,100)Foreign-born:
21.6% (418)
Black or African American - Speak another language Native:
30.8% (484)Foreign-born:
79.4% (1,536)
Other race - Speak another language Native:
49.4% (460)Foreign-born:
100.0% (758)
Two or more races - Speak another language Native:
33.4% (185)Foreign-born:
100.0% (108)
White alone - Speak only English Native:
94.9% (4,574)Foreign-born:
23.1% (95)
White alone - Speak another language Native:
5.0% (241)Foreign-born:
75.0% (310)
Hispanic or Latino - Speak only English Native:
59.0% (694)Foreign-born:
2.6% (24)
Hispanic or Latino - Speak another language Native:
41.8% (492)Foreign-born:
97.5% (905)
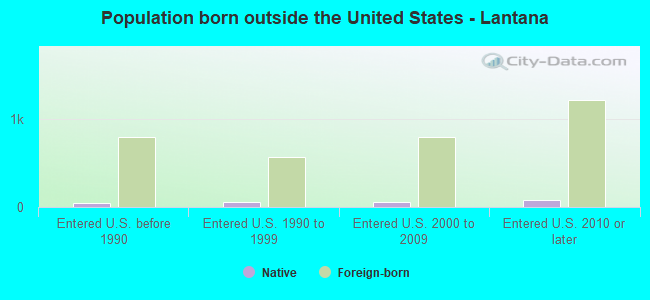
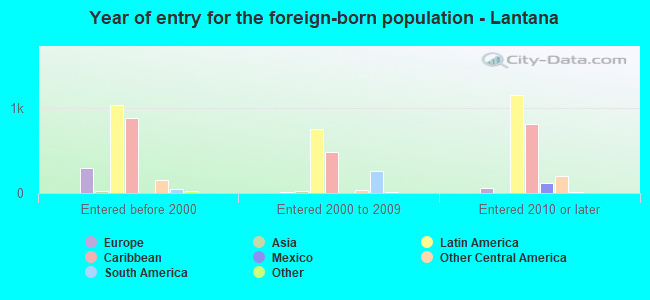
Foreign-born residents in Lantana 3,367 residents are foreign born (23.6% Latin America , 3.4% Europe ).
This city:
28.3%Florida:
21.1%
Marital status for residents in Lantana Marital status - White (Caucasian) population 15 years and over
Males 32.6% Never married37.7% Now married4.1% Separated6.2% Widowed19.4% DivorcedFemales 21.5% Never married39.4% Now married2.5% Separated15.3% Widowed21.3% DivorcedWomen who did not give birth in the past 12 months Now married:
41.1% (427)Unmarried:
58.9% (612)
Marital status - Black or African American population 15 years and over
Males 46.5% Never married39.8% Now married1.7% Separated3.5% Widowed8.4% DivorcedFemales 30.1% Never married56.1% Now married3.7% Separated2.6% Widowed7.6% DivorcedWomen who did not give birth in the past 12 months Now married:
59.1% (642)Unmarried:
40.9% (444)
Marital status - Other race population 15 years and over
Males 35.8% Never married57.7% Now married0.0% Separated0.0% Widowed6.5% DivorcedFemales 34.7% Never married28.8% Now married17.1% Separated0.0% Widowed19.4% DivorcedWomen who gave birth in the past 12 months Now married:
0.0% (0)Unmarried:
100.0% (136)
Women who did not give birth in the past 12 months Now married:
71.8% (205)Unmarried:
28.2% (81)
Marital status - Two or more races population 15 years and over
Males 23.7% Never married76.3% Now married0.0% Separated0.0% Widowed0.0% DivorcedFemales 26.3% Never married64.6% Now married0.0% Separated5.2% Widowed3.9% DivorcedWomen who did not give birth in the past 12 months Now married:
58.5% (183)Unmarried:
41.5% (130)
Marital status - White alone, not Hispanic / Latino population 15 years and over
Males 29.4% Never married39.2% Now married3.8% Separated7.0% Widowed20.6% DivorcedFemales 21.8% Never married40.4% Now married1.9% Separated16.6% Widowed19.2% DivorcedWomen who did not give birth in the past 12 months Now married:
38.8% (359)Unmarried:
61.2% (567)
Marital status - Hispanic or Latino population 15 years and over
Males 54.8% Never married32.8% Now married3.2% Separated0.0% Widowed9.1% DivorcedFemales 21.3% Never married47.8% Now married9.4% Separated4.0% Widowed17.5% DivorcedWomen who did not give birth in the past 12 months Now married:
58.9% (414)Unmarried:
41.1% (288)
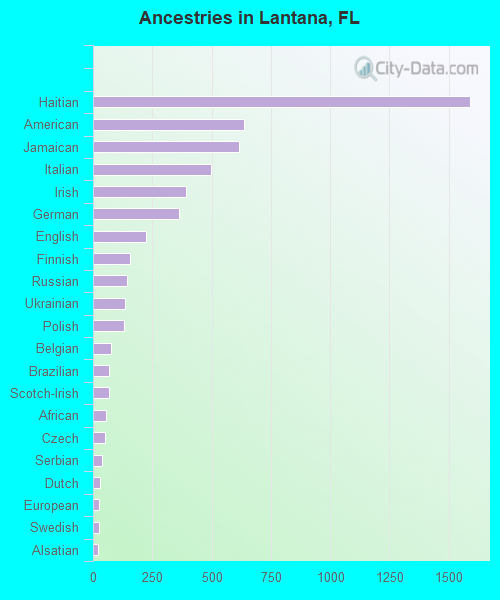
Ancestries in Lantana
1,590 22.2% Haitian636 8.9% American616 8.6% Jamaican497 6.9% Italian391 5.4% Irish362 5.0% German224 3.1% English156 2.2% Finnish144 2.0% Russian136 1.9% Ukrainian131 1.8% Polish74 1.0% Belgian68 0.9% Brazilian66 0.9% Scotch-Irish54 0.8% African52 0.7% Czech36 0.5% Serbian28 0.4% Dutch25 0.3% European24 0.3% Swedish22 0.3% Alsatian14 0.2% Romanian13 0.2% British13 0.2% Norwegian11 0.2% Maltese10 0.1% Greek7 0.10% Scottish7 0.10% Bahamian
Geographical mobility in Lantana Same house 1 year ago 4,631 81.3% White (Caucasian)3,097 87.3% Black or African American1,307 72.2% Other race698 86.3% Two or more races4,398 81.8% White alone, not Hispanic / Latino1,743 78.3% Hispanic or LatinoMoved within same county 542 9.5% White / Caucasian212 6.0% Black or African American7 77.2% American Indian / Alaska Native242 13.3% Other race537 10.0% White alone, not Hispanic / Latino246 11.1% Hispanic or LatinoMoved within same state 206 3.6% White / Caucasian1 0.0% Black or African American209 11.5% Other race162 3.0% White alone, not Hispanic / Latino81 3.6% Hispanic or LatinoMoved from different state 225 3.9% White / Caucasian101 2.9% Black or African American26 1.4% Other race139 17.2% Two or more races207 3.8% White alone, not Hispanic / Latino139 6.2% Hispanic or LatinoMoved from abroad 8 0.1% White125 3.5% Black or African American42 2.3% Other race10 0.2% White alone, not Hispanic / Latino23 1.0% Hispanic or Latino
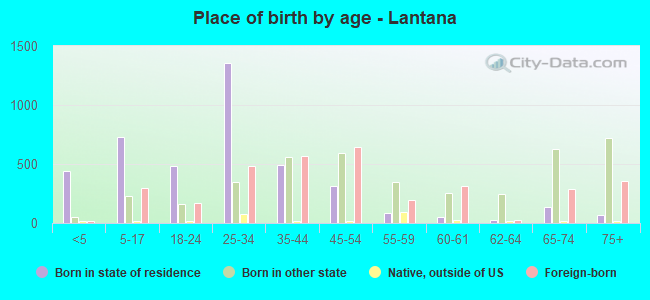
Children Nativity (place of birth) in Lantana
Children under 6 years - Living with two parents Both parents native 118 100.0% NativeBoth parents foreign-born 141 100.0% NativeOne native, one foreign-born parent 14 100.0% NativeChildren under 6 years - Living with one parent Native parent 197 100.0% NativeForeign-born parent 37 100.0% NativeChildren 6 to 17 years - Living with two parents Both parents native 197 100.0% NativeBoth parents foreign-born 45 20.5% Native174 79.5% Foreign-bornOne native, one foreign-born parent 230 100.0% NativeChildren 6 to 17 years - Living with one parent Native parent 241 100.0% NativeForeign-born parent 156 64.4% Native86 35.6% Foreign-born
Grandparents responsible for own grandchildren in Lantana
Grandparents (30 to 59 years) White / Caucasian 11 100.0% Not responsible for grandchildrenBlack or African American 119 100.0% Responsible for grandchildrenOther race 35 100.0% Not responsible for grandchildrenWhite alone, not Hispanic / Latino 19 100.0% Not responsible for grandchildrenHispanic or Latino 18 100.0% Not responsible for grandchildren
Grandparents (60 years and over) White / Caucasian 32 100.0% Not responsible for grandchildrenOther race 132 100.0% Not responsible for grandchildrenWhite alone, not Hispanic / Latino 36 100.0% Not responsible for grandchildrenHispanic or Latino 17 100.0% Not responsible for grandchildren