Races in Land O' Lakes, Florida (FL) Detailed Stats
Data:
Races - White alone (%)
Races - White alone (% change since 2000)
Races - Black alone (%)
Races - Black alone (% change since 2000)
Races - American Indian alone (%)
Races - American Indian alone (% change since 2000)
Races - Asian alone (%)
Races - Asian alone (% change since 2000)
Races - Hispanic (%)
Races - Hispanic (% change since 2000)
Races - Native Hawaiian and Other Pacific Islander alone (%)
Races - Native Hawaiian and Other Pacific Islander alone (% change since 2000)
Races - Two or more races(%)
Races - Two or more races(% change since 2000)
Races - Other race alone (%)
Races - Other race alone (% change since 2000)
Racial diversity
Place of birth - Born in state of residence (%)
Place of birth - Born in state of residence (%) - White
Place of birth - Born in state of residence (%) - Black or African American
Place of birth - Born in state of residence (%) - Asian
Place of birth - Born in state of residence (%) - Hispanic or Latino
Place of birth - Born in state of residence (%) - American Indian and Alaska Native
Place of birth - Born in state of residence (%) - Multirace
Place of birth - Born in state of residence (%) - Other Race
Place of birth - Born in other state (%)
Place of birth - Born in other state (%) - White
Place of birth - Born in other state (%) - Black or African American
Place of birth - Born in other state (%) - Asian
Place of birth - Born in other state (%) - Hispanic or Latino
Place of birth - Born in other state (%) - American Indian and Alaska Native
Place of birth - Born in other state (%) - Multirace
Place of birth - Born in other state (%) - Other Race
Place of birth - Native, outside of US (%)
Place of birth - Native, outside of US (%) - White
Place of birth - Native, outside of US (%) - Black or African American
Place of birth - Native, outside of US (%) - Asian
Place of birth - Native, outside of US (%) - Hispanic or Latino
Place of birth - Native, outside of US (%) - American Indian and Alaska Native
Place of birth - Native, outside of US (%) - Multirace
Place of birth - Native, outside of US (%) - Other Race
Place of birth - Foreign born (%)
Place of birth - Foreign born (%) - White
Place of birth - Foreign born (%) - Black or African American
Place of birth - Foreign born (%) - Asian
Place of birth - Foreign born (%) - Hispanic or Latino
Place of birth - Foreign born (%) - American Indian and Alaska Native
Place of birth - Foreign born (%) - Multirace
Place of birth - Foreign born (%) - Other Race
Residents speaking English at home (%)
Residents speaking English at home - Born in the United States (%)
Residents speaking English at home - Native, born elsewhere (%)
Residents speaking English at home - Foreign born (%)
Residents speaking Spanish at home (%)
Residents speaking Spanish at home - Born in the United States (%)
Residents speaking Spanish at home - Native, born elsewhere (%)
Residents speaking Spanish at home - Foreign born (%)
Residents speaking other language at home (%)
Residents speaking other language at home - Born in the United States (%)
Residents speaking other language at home - Native, born elsewhere (%)
Residents speaking other language at home - Foreign born (%)
Marital status - Never married (%)
Marital status - Now married (%)
Marital status - Separated (%)
Marital status - Widowed (%)
Marital status - Divorced (%)
Ancestries Reported - Arab (%)
Ancestries Reported - Czech (%)
Ancestries Reported - Danish (%)
Ancestries Reported - Dutch (%)
Ancestries Reported - English (%)
Ancestries Reported - French (%)
Ancestries Reported - French Canadian (%)
Ancestries Reported - German (%)
Ancestries Reported - Greek (%)
Ancestries Reported - Hungarian (%)
Ancestries Reported - Irish (%)
Ancestries Reported - Italian (%)
Ancestries Reported - Lithuanian (%)
Ancestries Reported - Norwegian (%)
Ancestries Reported - Polish (%)
Ancestries Reported - Portuguese (%)
Ancestries Reported - Russian (%)
Ancestries Reported - Scotch-Irish (%)
Ancestries Reported - Scottish (%)
Ancestries Reported - Slovak (%)
Ancestries Reported - Subsaharan African (%)
Ancestries Reported - Swedish (%)
Ancestries Reported - Swiss (%)
Ancestries Reported - Ukrainian (%)
Ancestries Reported - United States (%)
Ancestries Reported - Welsh (%)
Ancestries Reported - West Indian (%)
Ancestries Reported - Other (%)
Geographical mobility - Same house 1 year ago (%)
Geographical mobility - Same house 1 year ago (%) - White
Geographical mobility - Same house 1 year ago (%) - Black or African American
Geographical mobility - Same house 1 year ago (%) - Asian
Geographical mobility - Same house 1 year ago (%) - Hispanic or Latino
Geographical mobility - Same house 1 year ago (%) - American Indian and Alaska Native
Geographical mobility - Same house 1 year ago (%) - Multirace
Geographical mobility - Same house 1 year ago (%) - Other Race
Geographical mobility - Moved within same county (%)
Geographical mobility - Moved within same county (%) - White
Geographical mobility - Moved within same county (%) - Black or African American
Geographical mobility - Moved within same county (%) - Asian
Geographical mobility - Moved within same county (%) - Hispanic or Latino
Geographical mobility - Moved within same county (%) - American Indian and Alaska Native
Geographical mobility - Moved within same county (%) - Multirace
Geographical mobility - Moved within same county (%) - Other Race
Geographical mobility - Moved from different county within same state (%)
Geographical mobility - Moved from different county within same state (%) - White
Geographical mobility - Moved from different county within same state (%) - Black or African American
Geographical mobility - Moved from different county within same state (%) - Asian
Geographical mobility - Moved from different county within same state (%) - Hispanic or Latino
Geographical mobility - Moved from different county within same state (%) - American Indian and Alaska Native
Geographical mobility - Moved from different county within same state (%) - Multirace
Geographical mobility - Moved from different county within same state (%) - Other Race
Geographical mobility - Moved from different state (%)
Geographical mobility - Moved from different state (%) - White
Geographical mobility - Moved from different state (%) - Black or African American
Geographical mobility - Moved from different state (%) - Asian
Geographical mobility - Moved from different state (%) - Hispanic or Latino
Geographical mobility - Moved from different state (%) - American Indian and Alaska Native
Geographical mobility - Moved from different state (%) - Multirace
Geographical mobility - Moved from different state (%) - Other Race
Geographical mobility - Moved from abroad (%)
Geographical mobility - Moved from abroad (%) - White
Geographical mobility - Moved from abroad (%) - Black or African American
Geographical mobility - Moved from abroad (%) - Asian
Geographical mobility - Moved from abroad (%) - Hispanic or Latino
Geographical mobility - Moved from abroad (%) - American Indian and Alaska Native
Geographical mobility - Moved from abroad (%) - Multirace
Geographical mobility - Moved from abroad (%) - Other Race
Place of birth for the foreign-born population - Ireland (%)
Place of birth for the foreign-born population - Denmark (%)
Place of birth for the foreign-born population - Norway (%)
Place of birth for the foreign-born population - Sweden (%)
Place of birth for the foreign-born population - United Kingdom (%)
Place of birth for the foreign-born population - England (%)
Place of birth for the foreign-born population - Scotland (%)
Place of birth for the foreign-born population - Other Northern Europe (%)
Place of birth for the foreign-born population - Austria (%)
Place of birth for the foreign-born population - Belgium (%)
Place of birth for the foreign-born population - France (%)
Place of birth for the foreign-born population - Germany (%)
Place of birth for the foreign-born population - Netherlands (%)
Place of birth for the foreign-born population - Switzerland (%)
Place of birth for the foreign-born population - Other Western Europe (%)
Place of birth for the foreign-born population - Greece (%)
Place of birth for the foreign-born population - Italy (%)
Place of birth for the foreign-born population - Portugal (%)
Place of birth for the foreign-born population - Spain (%)
Place of birth for the foreign-born population - Other Southern Europe (%)
Place of birth for the foreign-born population - Albania (%)
Place of birth for the foreign-born population - Belarus (%)
Place of birth for the foreign-born population - Bosnia and Herzegovina (%)
Place of birth for the foreign-born population - Bulgaria (%)
Place of birth for the foreign-born population - Croatia (%)
Place of birth for the foreign-born population - Czechoslovakia (%)
Place of birth for the foreign-born population - Hungary (%)
Place of birth for the foreign-born population - Latvia (%)
Place of birth for the foreign-born population - Lithuania (%)
Place of birth for the foreign-born population - North Macedonia (Macedonia) (%)
Place of birth for the foreign-born population - Moldova (%)
Place of birth for the foreign-born population - Poland (%)
Place of birth for the foreign-born population - Romania (%)
Place of birth for the foreign-born population - Russia (%)
Place of birth for the foreign-born population - Serbia (%)
Place of birth for the foreign-born population - Ukraine (%)
Place of birth for the foreign-born population - Other Eastern Europe (%)
Place of birth for the foreign-born population - China (%)
Place of birth for the foreign-born population - Hong Kong (%)
Place of birth for the foreign-born population - Taiwan (%)
Place of birth for the foreign-born population - Japan (%)
Place of birth for the foreign-born population - Korea (%)
Place of birth for the foreign-born population - Other Eastern Asia (%)
Place of birth for the foreign-born population - Afghanistan (%)
Place of birth for the foreign-born population - Bangladesh (%)
Place of birth for the foreign-born population - India (%)
Place of birth for the foreign-born population - Iran (%)
Place of birth for the foreign-born population - Kazakhstan (%)
Place of birth for the foreign-born population - Nepal (%)
Place of birth for the foreign-born population - Pakistan (%)
Place of birth for the foreign-born population - Sri Lanka (%)
Place of birth for the foreign-born population - Uzbekistan (%)
Place of birth for the foreign-born population - Other South Central Asia (%)
Place of birth for the foreign-born population - Burma (%)
Place of birth for the foreign-born population - Cambodia (%)
Place of birth for the foreign-born population - Indonesia (%)
Place of birth for the foreign-born population - Laos (%)
Place of birth for the foreign-born population - Malaysia (%)
Place of birth for the foreign-born population - Philippines (%)
Place of birth for the foreign-born population - Singapore (%)
Place of birth for the foreign-born population - Thailand (%)
Place of birth for the foreign-born population - Vietnam (%)
Place of birth for the foreign-born population - Other South Eastern Asia (%)
Place of birth for the foreign-born population - Armenia (%)
Place of birth for the foreign-born population - Iraq (%)
Place of birth for the foreign-born population - Israel (%)
Place of birth for the foreign-born population - Jordan (%)
Place of birth for the foreign-born population - Kuwait (%)
Place of birth for the foreign-born population - Lebanon (%)
Place of birth for the foreign-born population - Saudi Arabia (%)
Place of birth for the foreign-born population - Syria (%)
Place of birth for the foreign-born population - Turkey (%)
Place of birth for the foreign-born population - Yemen (%)
Place of birth for the foreign-born population - Other Western Asia (%)
Place of birth for the foreign-born population - Eritrea (%)
Place of birth for the foreign-born population - Ethiopia (%)
Place of birth for the foreign-born population - Kenya (%)
Place of birth for the foreign-born population - Somalia (%)
Place of birth for the foreign-born population - Uganda (%)
Place of birth for the foreign-born population - Zimbabwe (%)
Place of birth for the foreign-born population - Other Eastern Africa (%)
Place of birth for the foreign-born population - Cameroon (%)
Place of birth for the foreign-born population - Congo (%)
Place of birth for the foreign-born population - Democratic Republic of Congo (Zaire) (%)
Place of birth for the foreign-born population - Other Middle Africa (%)
Place of birth for the foreign-born population - Egypt (%)
Place of birth for the foreign-born population - Morocco (%)
Place of birth for the foreign-born population - Sudan (%)
Place of birth for the foreign-born population - Other Northern Africa (%)
Place of birth for the foreign-born population - South Africa (%)
Place of birth for the foreign-born population - Other Southern Africa (%)
Place of birth for the foreign-born population - Cabo Verde (%)
Place of birth for the foreign-born population - Ghana (%)
Place of birth for the foreign-born population - Liberia (%)
Place of birth for the foreign-born population - Nigeria (%)
Place of birth for the foreign-born population - Senegal (%)
Place of birth for the foreign-born population - Sierra Leone (%)
Place of birth for the foreign-born population - Other Western Africa (%)
Place of birth for the foreign-born population - Australia (%)
Place of birth for the foreign-born population - New Zealand (%)
Place of birth for the foreign-born population - Fiji (%)
Place of birth for the foreign-born population - Micronesia (%)
Place of birth for the foreign-born population - Bahamas (%)
Place of birth for the foreign-born population - Barbados (%)
Place of birth for the foreign-born population - Cuba (%)
Place of birth for the foreign-born population - Dominica (%)
Place of birth for the foreign-born population - Dominican Republic (%)
Place of birth for the foreign-born population - Grenada (%)
Place of birth for the foreign-born population - Haiti (%)
Place of birth for the foreign-born population - Jamaica (%)
Place of birth for the foreign-born population - St. Vincent and the Grenadines (%)
Place of birth for the foreign-born population - Trinidad and Tobago (%)
Place of birth for the foreign-born population - West Indies (%)
Place of birth for the foreign-born population - Other Caribbean (%)
Place of birth for the foreign-born population - Belize (%)
Place of birth for the foreign-born population - Costa Rica (%)
Place of birth for the foreign-born population - El Salvador (%)
Place of birth for the foreign-born population - Guatemala (%)
Place of birth for the foreign-born population - Honduras (%)
Place of birth for the foreign-born population - Mexico (%)
Place of birth for the foreign-born population - Nicaragua (%)
Place of birth for the foreign-born population - Panama (%)
Place of birth for the foreign-born population - Other Central America (%)
Place of birth for the foreign-born population - Argentina (%)
Place of birth for the foreign-born population - Bolivia (%)
Place of birth for the foreign-born population - Brazil (%)
Place of birth for the foreign-born population - Chile (%)
Place of birth for the foreign-born population - Colombia (%)
Place of birth for the foreign-born population - Ecuador (%)
Place of birth for the foreign-born population - Guyana (%)
Place of birth for the foreign-born population - Peru (%)
Place of birth for the foreign-born population - Uruguay (%)
Place of birth for the foreign-born population - Venezuela (%)
Place of birth for the foreign-born population - Other South America (%)
Place of birth for the foreign-born population - Canada (%)
Place of birth for the foreign-born population - Other Northern America (%)
Place of birth for the foreign-born population - Other (%)
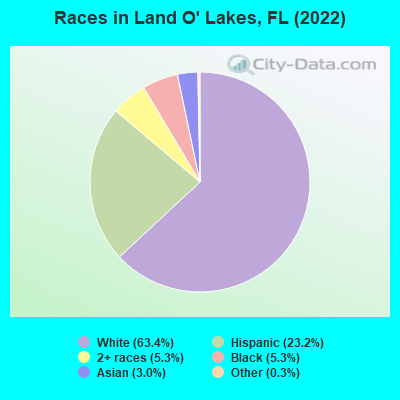
According to 2022 data, the most numerous races in Land O' Lakes, FL are White alone (27,688 residents), Hispanic (10,134 residents), and Black alone (2,304 residents). 76.9% of Land O' Lakes residents speak English at home. 11.0% of Land O' Lakes, FL residents are foreign-born (6.5% born in Latin America, 2.4% born in Asia, 1.7% born in Europe), which is 91.7% less than the foreign-born rate of 21.0% across the entire state of Florida.
Race distribution in Land O' Lakes
2000 2022
10,458,509 65.4% White alone 2,682,715 16.8% Hispanic 2,264,268 14.2% Black alone 261,693 1.6% Asian alone 236,954 1.5% Two or more races 42,358 0.3% American Indian alone 28,994 0.2% Other race alone 6,887 0.04% Native Hawaiian and Other
11,309,403 50.8% White alone 6,025,039 27.1% Hispanic 3,241,015 14.6% Black alone 861,630 3.9% Two or more races 623,692 2.8% Asian alone 152,054 0.7% Other race alone 22,504 0.1% American Indian alone 9,486 0.04% Native Hawaiian and Other
Income and house value in Land O' Lakes Median household income in 2022 $93,846 White non-Hispanic householders$84,442 Black householders$76,274 Asian householders$59,719 Some other race householders$132,274 Two or more races householders$108,582 Hispanic or Latino race householdersMedian 2022 house value $424,705 White Non-Hispanic householders$427,227 Black or African American householders$330,326 American Indian or Alaska Native householders $597,253 Asian householders$405,253 Native Hawaiian and other Pacific Islander householders$392,645 Some other race householders$469,733 Two or more races householders$439,475 Hispanic or Latino householders
Median age by race in Land O' Lakes
44.0 Median age for White residents42.6 45.4 34.7 Median age for Black or African American residents32.8 36.6 25.9 Median age for American Indian / Alaska Native residents39.0 -501,002,003.5 38.1 Median age for Asian residents28.9 42.6 -835,555,554.7 Median age for Native Hawaiian / Pacific Islander residents-858,307,848.3 -444,051,825.2 48.6 Median age for Other race residents43.0 55.9 30.4 Median age for Two or more races residents31.3 30.8 44.1 Median age for White alone residents43.3 47.2 36.4 Median age for Hispanic or Latino residents36.3 36.6
Owner/renter occupied households by race in Land O' Lakes
House owners and renters - White residents 9,810 82.4% Owner occupied2,101 17.6% Renter occupiedHouse owners and renters - Black or African American residents 585 81.1% Owner occupied136 18.9% Renter occupiedHouse owners and renters - American Indian / Alaska Native residents 7 100.0% Owner occupiedHouse owners and renters - Asian residents 383 90.5% Owner occupied40 9.5% Renter occupiedHouse owners and renters - Other race residents 612 69.1% Owner occupied274 30.9% Renter occupiedHouse owners and renters - Two or more races residents 1,417 76.7% Owner occupied430 23.3% Renter occupiedHouse owners and renters - White alone residents 9,005 82.1% Owner occupied1,959 17.9% Renter occupiedHouse owners and renters - Hispanic or Latino residents 2,341 81.3% Owner occupied537 18.7% Renter occupied
Language usage in Land O' Lakes
English speakers - Total 76.9% of residents of Land O' Lakes speak English at home.
17.8% of residents speak Spanish at home 4,103 55.3% Speak English very well3,318 44.7% Speak English less than very well6.1% of residents speak other language at home 2,047 80.1% Speak English very well508 19.9% Speak English less than very well
English speakers - Born in the United States 89.7% of residents of Land O' Lakes speak English at home.
6.7% of residents speak Spanish at home 1,037 81.2% Speak English very well240 18.8% Speak English less than very well4.0% of residents speak other language at home 748 100.0% Speak English very well
English speakers - Native, born elsewhere 15.9% of residents of Land O' Lakes speak English at home.
85.2% of residents speak Spanish at home 1,189 70.2% Speak English very well505 29.8% Speak English less than very well2.3% of residents speak other language at home 24 53.3% Speak English very well21 46.7% Speak English less than very well
English speakers - Foreign-born 20.5% of residents of Land O' Lakes speak English at home.
50.7% of residents speak Spanish at home 1,077 39.1% Speak English very well1,681 60.9% Speak English less than very well29.5% of residents speak other language at home 1,098 68.5% Speak English very well506 31.5% Speak English less than very well
White (Caucasian) - Speak only English Native:
90.7% (25,507)Foreign-born:
29.6% (405)
White (Caucasian) - Speak another language Native:
7.8% (2,179)Foreign-born:
70.3% (963)
Black or African American - Speak only English Native:
80.6% (1,510)Foreign-born:
95.2% (542)
Black or African American - Speak another language Native:
21.4% (401)Foreign-born:
8.5% (48)
Asian - Speak only English Native:
87.8% (478)Foreign-born:
26.4% (195)
Asian - Speak another language Native:
21.3% (116)Foreign-born:
74.6% (550)
Other race - Speak only English Native:
30.2% (412)Foreign-born:
3.1% (43)
Other race - Speak another language Native:
71.4% (977)Foreign-born:
96.8% (1,313)
Two or more races - Speak another language Native:
26.6% (1,167)Foreign-born:
100.0% (1,793)
White alone - Speak only English Native:
96.4% (24,518)Foreign-born:
39.6% (422)
White alone - Speak another language Native:
3.6% (920)Foreign-born:
60.2% (640)
Hispanic or Latino - Speak only English Native:
40.4% (2,771)Foreign-born:
1.9% (51)
Hispanic or Latino - Speak another language Native:
60.1% (4,123)Foreign-born:
100.0% (2,726)
Foreign-born residents in Land O' Lakes 4,786 residents are foreign born (6.5% Latin America , 2.4% Asia , 1.7% Europe ).
This city:
11.0%Florida:
21.1%
Marital status for residents in Land O' Lakes Marital status - White (Caucasian) population 15 years and over
Males 30.1% Never married56.9% Now married1.2% Separated3.8% Widowed8.0% DivorcedFemales 18.6% Never married57.1% Now married1.5% Separated7.0% Widowed15.8% DivorcedWomen who gave birth in the past 12 months Now married:
89.3% (143)Unmarried:
10.7% (17)
Women who did not give birth in the past 12 months Now married:
53.3% (3,070)Unmarried:
46.7% (2,687)
Marital status - Black or African American population 15 years and over
Males 45.0% Never married52.7% Now married0.0% Separated0.8% Widowed1.5% DivorcedFemales 53.0% Never married32.0% Now married0.4% Separated2.6% Widowed12.0% DivorcedWomen who gave birth in the past 12 months Now married:
45.2% (21)Unmarried:
54.8% (26)
Women who did not give birth in the past 12 months Now married:
14.5% (89)Unmarried:
85.5% (523)
Marital status - American Indian / Alaska Native population 15 years and over
Males 61.9% Never married14.3% Now married0.0% Separated0.0% Widowed23.8% DivorcedFemales 100.0% Never married0.0% Now married0.0% Separated0.0% Widowed0.0% DivorcedWomen who did not give birth in the past 12 months Now married:
0.0% (0)Unmarried:
100.0% (13)
Marital status - Asian population 15 years and over
Males 35.5% Never married61.2% Now married0.0% Separated3.3% Widowed0.0% DivorcedFemales 20.0% Never married71.5% Now married0.0% Separated3.9% Widowed4.6% DivorcedWomen who gave birth in the past 12 months Now married:
100.0% (9)Unmarried:
0.0% (0)
Women who did not give birth in the past 12 months Now married:
71.8% (213)Unmarried:
28.2% (84)
Marital status - Other race population 15 years and over
Males 31.4% Never married63.6% Now married0.0% Separated1.7% Widowed3.3% DivorcedFemales 20.0% Never married40.1% Now married7.4% Separated30.0% Widowed2.5% DivorcedWomen who did not give birth in the past 12 months Now married:
44.8% (261)Unmarried:
55.2% (321)
Marital status - Two or more races population 15 years and over
Males 54.3% Never married38.1% Now married0.0% Separated0.0% Widowed7.5% DivorcedFemales 43.6% Never married42.5% Now married0.0% Separated0.0% Widowed13.8% DivorcedWomen who gave birth in the past 12 months Now married:
100.0% (69)Unmarried:
0.0% (0)
Women who did not give birth in the past 12 months Now married:
26.9% (465)Unmarried:
73.1% (1,265)
Marital status - White alone, not Hispanic / Latino population 15 years and over
Males 29.4% Never married58.5% Now married1.2% Separated3.2% Widowed7.8% DivorcedFemales 17.6% Never married55.5% Now married1.8% Separated7.6% Widowed17.5% DivorcedWomen who gave birth in the past 12 months Now married:
88.5% (139)Unmarried:
11.5% (18)
Women who did not give birth in the past 12 months Now married:
50.1% (2,534)Unmarried:
49.9% (2,521)
Marital status - Hispanic or Latino population 15 years and over
Males 42.2% Never married46.4% Now married0.6% Separated4.0% Widowed6.8% DivorcedFemales 23.8% Never married56.6% Now married1.9% Separated9.3% Widowed8.4% DivorcedWomen who gave birth in the past 12 months Now married:
100.0% (67)Unmarried:
0.0% (0)
Women who did not give birth in the past 12 months Now married:
55.7% (1,318)Unmarried:
44.3% (1,050)
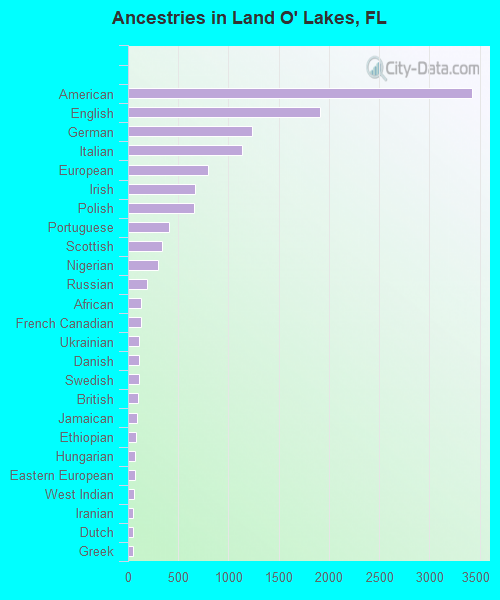
Ancestries in Land O' Lakes
3,422 16.0% American1,910 8.9% English1,238 5.8% German1,138 5.3% Italian797 3.7% European669 3.1% Irish657 3.1% Polish411 1.9% Portuguese342 1.6% Scottish295 1.4% Nigerian191 0.9% Russian126 0.6% African125 0.6% French Canadian114 0.5% Ukrainian112 0.5% Danish109 0.5% Swedish101 0.5% British87 0.4% Jamaican77 0.4% Ethiopian74 0.3% Hungarian65 0.3% Eastern European58 0.3% West Indian53 0.2% Iranian51 0.2% Dutch49 0.2% Greek47 0.2% Scotch-Irish46 0.2% Czech44 0.2% Lithuanian42 0.2% Egyptian38 0.2% Trinidadian and Tobagonian35 0.2% Cajun30 0.1% Slovak28 0.1% Romanian28 0.1% Cape Verdean27 0.1% French24 0.1% Canadian22 0.1% Armenian22 0.1% Haitian22 0.1% Austrian19 0.09% Welsh18 0.08% Belgian18 0.08% Brazilian16 0.07% Palestinian16 0.07% Ghanaian15 0.07% Australian14 0.07% Turkish12 0.06% Latvian12 0.06% Guyanese12 0.06% Swiss7 0.03% Norwegian6 0.03% Celtic
Geographical mobility in Land O' Lakes Same house 1 year ago 27,785 90.8% White (Caucasian)2,539 100.0% Black or African American46 93.6% American Indian / Alaska Native1,142 86.0% Asian2,498 84.4% Other race6,063 92.6% Two or more races25,352 92.0% White alone, not Hispanic / Latino8,801 87.3% Hispanic or LatinoMoved within same county 713 2.3% White / Caucasian85 6.4% Asian37 1.3% Other race247 3.8% Two or more races565 2.1% White alone, not Hispanic / Latino241 2.4% Hispanic or LatinoMoved within same state 971 3.2% White / Caucasian26 1.0% Black or African American4 8.1% American Indian / Alaska Native51 3.9% Asian55 1.9% Other race66 1.0% Two or more races708 2.6% White alone, not Hispanic / Latino456 4.5% Hispanic or LatinoMoved from different state 1,227 4.0% White / Caucasian161 5.4% Other race144 2.2% Two or more races975 3.5% White alone, not Hispanic / Latino476 4.7% Hispanic or LatinoMoved from abroad 26 0.1% White30 1.0% Other race32 0.1% White alone, not Hispanic / Latino16 0.2% Hispanic or Latino
Children Nativity (place of birth) in Land O' Lakes
Children under 6 years - Living with two parents Both parents native 1,271 100.0% NativeBoth parents foreign-born 183 100.0% NativeOne native, one foreign-born parent 423 100.0% NativeChildren under 6 years - Living with one parent Native parent 491 100.0% NativeForeign-born parent 46 37.9% Native76 62.1% Foreign-bornChildren 6 to 17 years - Living with two parents Both parents native 3,888 99.6% Native15 0.4% Foreign-bornBoth parents foreign-born 323 87.6% Native46 12.4% Foreign-bornOne native, one foreign-born parent 471 100.0% NativeChildren 6 to 17 years - Living with one parent Native parent 1,848 100.0% NativeForeign-born parent 359 47.4% Native398 52.6% Foreign-born
Grandparents responsible for own grandchildren in Land O' Lakes
Grandparents (30 to 59 years) White / Caucasian 38 49.0% Responsible for grandchildren40 51.0% Not responsible for grandchildrenBlack or African American 34 38.5% Responsible for grandchildren55 61.5% Not responsible for grandchildrenAsian 36 100.0% Not responsible for grandchildrenTwo or more races 85 35.4% Responsible for grandchildren156 64.6% Not responsible for grandchildrenWhite alone, not Hispanic / Latino 41 54.1% Responsible for grandchildren35 45.9% Not responsible for grandchildrenHispanic or Latino 44 32.9% Responsible for grandchildren90 67.1% Not responsible for grandchildrenGrandparents (60 years and over) White / Caucasian 117 30.5% Responsible for grandchildren268 69.5% Not responsible for grandchildrenBlack or African American 30 100.0% Not responsible for grandchildrenAsian 72 100.0% Not responsible for grandchildrenWhite alone, not Hispanic / Latino 123 43.1% Responsible for grandchildren162 56.9% Not responsible for grandchildrenHispanic or Latino 164 100.0% Not responsible for grandchildren