Races in Lake Magdalene, Florida (FL) Detailed Stats
Data:
Races - White alone (%)
Races - White alone (% change since 2000)
Races - Black alone (%)
Races - Black alone (% change since 2000)
Races - American Indian alone (%)
Races - American Indian alone (% change since 2000)
Races - Asian alone (%)
Races - Asian alone (% change since 2000)
Races - Hispanic (%)
Races - Hispanic (% change since 2000)
Races - Native Hawaiian and Other Pacific Islander alone (%)
Races - Native Hawaiian and Other Pacific Islander alone (% change since 2000)
Races - Two or more races(%)
Races - Two or more races(% change since 2000)
Races - Other race alone (%)
Races - Other race alone (% change since 2000)
Racial diversity
Place of birth - Born in state of residence (%)
Place of birth - Born in state of residence (%) - White
Place of birth - Born in state of residence (%) - Black or African American
Place of birth - Born in state of residence (%) - Asian
Place of birth - Born in state of residence (%) - Hispanic or Latino
Place of birth - Born in state of residence (%) - American Indian and Alaska Native
Place of birth - Born in state of residence (%) - Multirace
Place of birth - Born in state of residence (%) - Other Race
Place of birth - Born in other state (%)
Place of birth - Born in other state (%) - White
Place of birth - Born in other state (%) - Black or African American
Place of birth - Born in other state (%) - Asian
Place of birth - Born in other state (%) - Hispanic or Latino
Place of birth - Born in other state (%) - American Indian and Alaska Native
Place of birth - Born in other state (%) - Multirace
Place of birth - Born in other state (%) - Other Race
Place of birth - Native, outside of US (%)
Place of birth - Native, outside of US (%) - White
Place of birth - Native, outside of US (%) - Black or African American
Place of birth - Native, outside of US (%) - Asian
Place of birth - Native, outside of US (%) - Hispanic or Latino
Place of birth - Native, outside of US (%) - American Indian and Alaska Native
Place of birth - Native, outside of US (%) - Multirace
Place of birth - Native, outside of US (%) - Other Race
Place of birth - Foreign born (%)
Place of birth - Foreign born (%) - White
Place of birth - Foreign born (%) - Black or African American
Place of birth - Foreign born (%) - Asian
Place of birth - Foreign born (%) - Hispanic or Latino
Place of birth - Foreign born (%) - American Indian and Alaska Native
Place of birth - Foreign born (%) - Multirace
Place of birth - Foreign born (%) - Other Race
Residents speaking English at home (%)
Residents speaking English at home - Born in the United States (%)
Residents speaking English at home - Native, born elsewhere (%)
Residents speaking English at home - Foreign born (%)
Residents speaking Spanish at home (%)
Residents speaking Spanish at home - Born in the United States (%)
Residents speaking Spanish at home - Native, born elsewhere (%)
Residents speaking Spanish at home - Foreign born (%)
Residents speaking other language at home (%)
Residents speaking other language at home - Born in the United States (%)
Residents speaking other language at home - Native, born elsewhere (%)
Residents speaking other language at home - Foreign born (%)
Marital status - Never married (%)
Marital status - Now married (%)
Marital status - Separated (%)
Marital status - Widowed (%)
Marital status - Divorced (%)
Ancestries Reported - Arab (%)
Ancestries Reported - Czech (%)
Ancestries Reported - Danish (%)
Ancestries Reported - Dutch (%)
Ancestries Reported - English (%)
Ancestries Reported - French (%)
Ancestries Reported - French Canadian (%)
Ancestries Reported - German (%)
Ancestries Reported - Greek (%)
Ancestries Reported - Hungarian (%)
Ancestries Reported - Irish (%)
Ancestries Reported - Italian (%)
Ancestries Reported - Lithuanian (%)
Ancestries Reported - Norwegian (%)
Ancestries Reported - Polish (%)
Ancestries Reported - Portuguese (%)
Ancestries Reported - Russian (%)
Ancestries Reported - Scotch-Irish (%)
Ancestries Reported - Scottish (%)
Ancestries Reported - Slovak (%)
Ancestries Reported - Subsaharan African (%)
Ancestries Reported - Swedish (%)
Ancestries Reported - Swiss (%)
Ancestries Reported - Ukrainian (%)
Ancestries Reported - United States (%)
Ancestries Reported - Welsh (%)
Ancestries Reported - West Indian (%)
Ancestries Reported - Other (%)
Geographical mobility - Same house 1 year ago (%)
Geographical mobility - Same house 1 year ago (%) - White
Geographical mobility - Same house 1 year ago (%) - Black or African American
Geographical mobility - Same house 1 year ago (%) - Asian
Geographical mobility - Same house 1 year ago (%) - Hispanic or Latino
Geographical mobility - Same house 1 year ago (%) - American Indian and Alaska Native
Geographical mobility - Same house 1 year ago (%) - Multirace
Geographical mobility - Same house 1 year ago (%) - Other Race
Geographical mobility - Moved within same county (%)
Geographical mobility - Moved within same county (%) - White
Geographical mobility - Moved within same county (%) - Black or African American
Geographical mobility - Moved within same county (%) - Asian
Geographical mobility - Moved within same county (%) - Hispanic or Latino
Geographical mobility - Moved within same county (%) - American Indian and Alaska Native
Geographical mobility - Moved within same county (%) - Multirace
Geographical mobility - Moved within same county (%) - Other Race
Geographical mobility - Moved from different county within same state (%)
Geographical mobility - Moved from different county within same state (%) - White
Geographical mobility - Moved from different county within same state (%) - Black or African American
Geographical mobility - Moved from different county within same state (%) - Asian
Geographical mobility - Moved from different county within same state (%) - Hispanic or Latino
Geographical mobility - Moved from different county within same state (%) - American Indian and Alaska Native
Geographical mobility - Moved from different county within same state (%) - Multirace
Geographical mobility - Moved from different county within same state (%) - Other Race
Geographical mobility - Moved from different state (%)
Geographical mobility - Moved from different state (%) - White
Geographical mobility - Moved from different state (%) - Black or African American
Geographical mobility - Moved from different state (%) - Asian
Geographical mobility - Moved from different state (%) - Hispanic or Latino
Geographical mobility - Moved from different state (%) - American Indian and Alaska Native
Geographical mobility - Moved from different state (%) - Multirace
Geographical mobility - Moved from different state (%) - Other Race
Geographical mobility - Moved from abroad (%)
Geographical mobility - Moved from abroad (%) - White
Geographical mobility - Moved from abroad (%) - Black or African American
Geographical mobility - Moved from abroad (%) - Asian
Geographical mobility - Moved from abroad (%) - Hispanic or Latino
Geographical mobility - Moved from abroad (%) - American Indian and Alaska Native
Geographical mobility - Moved from abroad (%) - Multirace
Geographical mobility - Moved from abroad (%) - Other Race
Place of birth for the foreign-born population - Ireland (%)
Place of birth for the foreign-born population - Denmark (%)
Place of birth for the foreign-born population - Norway (%)
Place of birth for the foreign-born population - Sweden (%)
Place of birth for the foreign-born population - United Kingdom (%)
Place of birth for the foreign-born population - England (%)
Place of birth for the foreign-born population - Scotland (%)
Place of birth for the foreign-born population - Other Northern Europe (%)
Place of birth for the foreign-born population - Austria (%)
Place of birth for the foreign-born population - Belgium (%)
Place of birth for the foreign-born population - France (%)
Place of birth for the foreign-born population - Germany (%)
Place of birth for the foreign-born population - Netherlands (%)
Place of birth for the foreign-born population - Switzerland (%)
Place of birth for the foreign-born population - Other Western Europe (%)
Place of birth for the foreign-born population - Greece (%)
Place of birth for the foreign-born population - Italy (%)
Place of birth for the foreign-born population - Portugal (%)
Place of birth for the foreign-born population - Spain (%)
Place of birth for the foreign-born population - Other Southern Europe (%)
Place of birth for the foreign-born population - Albania (%)
Place of birth for the foreign-born population - Belarus (%)
Place of birth for the foreign-born population - Bosnia and Herzegovina (%)
Place of birth for the foreign-born population - Bulgaria (%)
Place of birth for the foreign-born population - Croatia (%)
Place of birth for the foreign-born population - Czechoslovakia (%)
Place of birth for the foreign-born population - Hungary (%)
Place of birth for the foreign-born population - Latvia (%)
Place of birth for the foreign-born population - Lithuania (%)
Place of birth for the foreign-born population - North Macedonia (Macedonia) (%)
Place of birth for the foreign-born population - Moldova (%)
Place of birth for the foreign-born population - Poland (%)
Place of birth for the foreign-born population - Romania (%)
Place of birth for the foreign-born population - Russia (%)
Place of birth for the foreign-born population - Serbia (%)
Place of birth for the foreign-born population - Ukraine (%)
Place of birth for the foreign-born population - Other Eastern Europe (%)
Place of birth for the foreign-born population - China (%)
Place of birth for the foreign-born population - Hong Kong (%)
Place of birth for the foreign-born population - Taiwan (%)
Place of birth for the foreign-born population - Japan (%)
Place of birth for the foreign-born population - Korea (%)
Place of birth for the foreign-born population - Other Eastern Asia (%)
Place of birth for the foreign-born population - Afghanistan (%)
Place of birth for the foreign-born population - Bangladesh (%)
Place of birth for the foreign-born population - India (%)
Place of birth for the foreign-born population - Iran (%)
Place of birth for the foreign-born population - Kazakhstan (%)
Place of birth for the foreign-born population - Nepal (%)
Place of birth for the foreign-born population - Pakistan (%)
Place of birth for the foreign-born population - Sri Lanka (%)
Place of birth for the foreign-born population - Uzbekistan (%)
Place of birth for the foreign-born population - Other South Central Asia (%)
Place of birth for the foreign-born population - Burma (%)
Place of birth for the foreign-born population - Cambodia (%)
Place of birth for the foreign-born population - Indonesia (%)
Place of birth for the foreign-born population - Laos (%)
Place of birth for the foreign-born population - Malaysia (%)
Place of birth for the foreign-born population - Philippines (%)
Place of birth for the foreign-born population - Singapore (%)
Place of birth for the foreign-born population - Thailand (%)
Place of birth for the foreign-born population - Vietnam (%)
Place of birth for the foreign-born population - Other South Eastern Asia (%)
Place of birth for the foreign-born population - Armenia (%)
Place of birth for the foreign-born population - Iraq (%)
Place of birth for the foreign-born population - Israel (%)
Place of birth for the foreign-born population - Jordan (%)
Place of birth for the foreign-born population - Kuwait (%)
Place of birth for the foreign-born population - Lebanon (%)
Place of birth for the foreign-born population - Saudi Arabia (%)
Place of birth for the foreign-born population - Syria (%)
Place of birth for the foreign-born population - Turkey (%)
Place of birth for the foreign-born population - Yemen (%)
Place of birth for the foreign-born population - Other Western Asia (%)
Place of birth for the foreign-born population - Eritrea (%)
Place of birth for the foreign-born population - Ethiopia (%)
Place of birth for the foreign-born population - Kenya (%)
Place of birth for the foreign-born population - Somalia (%)
Place of birth for the foreign-born population - Uganda (%)
Place of birth for the foreign-born population - Zimbabwe (%)
Place of birth for the foreign-born population - Other Eastern Africa (%)
Place of birth for the foreign-born population - Cameroon (%)
Place of birth for the foreign-born population - Congo (%)
Place of birth for the foreign-born population - Democratic Republic of Congo (Zaire) (%)
Place of birth for the foreign-born population - Other Middle Africa (%)
Place of birth for the foreign-born population - Egypt (%)
Place of birth for the foreign-born population - Morocco (%)
Place of birth for the foreign-born population - Sudan (%)
Place of birth for the foreign-born population - Other Northern Africa (%)
Place of birth for the foreign-born population - South Africa (%)
Place of birth for the foreign-born population - Other Southern Africa (%)
Place of birth for the foreign-born population - Cabo Verde (%)
Place of birth for the foreign-born population - Ghana (%)
Place of birth for the foreign-born population - Liberia (%)
Place of birth for the foreign-born population - Nigeria (%)
Place of birth for the foreign-born population - Senegal (%)
Place of birth for the foreign-born population - Sierra Leone (%)
Place of birth for the foreign-born population - Other Western Africa (%)
Place of birth for the foreign-born population - Australia (%)
Place of birth for the foreign-born population - New Zealand (%)
Place of birth for the foreign-born population - Fiji (%)
Place of birth for the foreign-born population - Micronesia (%)
Place of birth for the foreign-born population - Bahamas (%)
Place of birth for the foreign-born population - Barbados (%)
Place of birth for the foreign-born population - Cuba (%)
Place of birth for the foreign-born population - Dominica (%)
Place of birth for the foreign-born population - Dominican Republic (%)
Place of birth for the foreign-born population - Grenada (%)
Place of birth for the foreign-born population - Haiti (%)
Place of birth for the foreign-born population - Jamaica (%)
Place of birth for the foreign-born population - St. Vincent and the Grenadines (%)
Place of birth for the foreign-born population - Trinidad and Tobago (%)
Place of birth for the foreign-born population - West Indies (%)
Place of birth for the foreign-born population - Other Caribbean (%)
Place of birth for the foreign-born population - Belize (%)
Place of birth for the foreign-born population - Costa Rica (%)
Place of birth for the foreign-born population - El Salvador (%)
Place of birth for the foreign-born population - Guatemala (%)
Place of birth for the foreign-born population - Honduras (%)
Place of birth for the foreign-born population - Mexico (%)
Place of birth for the foreign-born population - Nicaragua (%)
Place of birth for the foreign-born population - Panama (%)
Place of birth for the foreign-born population - Other Central America (%)
Place of birth for the foreign-born population - Argentina (%)
Place of birth for the foreign-born population - Bolivia (%)
Place of birth for the foreign-born population - Brazil (%)
Place of birth for the foreign-born population - Chile (%)
Place of birth for the foreign-born population - Colombia (%)
Place of birth for the foreign-born population - Ecuador (%)
Place of birth for the foreign-born population - Guyana (%)
Place of birth for the foreign-born population - Peru (%)
Place of birth for the foreign-born population - Uruguay (%)
Place of birth for the foreign-born population - Venezuela (%)
Place of birth for the foreign-born population - Other South America (%)
Place of birth for the foreign-born population - Canada (%)
Place of birth for the foreign-born population - Other Northern America (%)
Place of birth for the foreign-born population - Other (%)
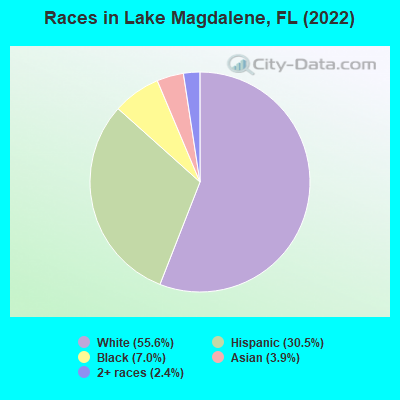
According to 2022 data, the most numerous races in Lake Magdalene, FL are White alone (18,065 residents), Hispanic (9,905 residents), and Black alone (2,283 residents). 75.0% of Lake Magdalene residents speak English at home. 16.9% of Lake Magdalene, FL residents are foreign-born (11.3% born in Latin America, 3.2% born in Asia), which is 23.9% less than the foreign-born rate of 21.0% across the entire state of Florida.
Race distribution in Lake Magdalene
2000 2022
10,458,509 65.4% White alone 2,682,715 16.8% Hispanic 2,264,268 14.2% Black alone 261,693 1.6% Asian alone 236,954 1.5% Two or more races 42,358 0.3% American Indian alone 28,994 0.2% Other race alone 6,887 0.04% Native Hawaiian and Other
11,309,403 50.8% White alone 6,025,039 27.1% Hispanic 3,241,015 14.6% Black alone 861,630 3.9% Two or more races 623,692 2.8% Asian alone 152,054 0.7% Other race alone 22,504 0.1% American Indian alone 9,486 0.04% Native Hawaiian and Other
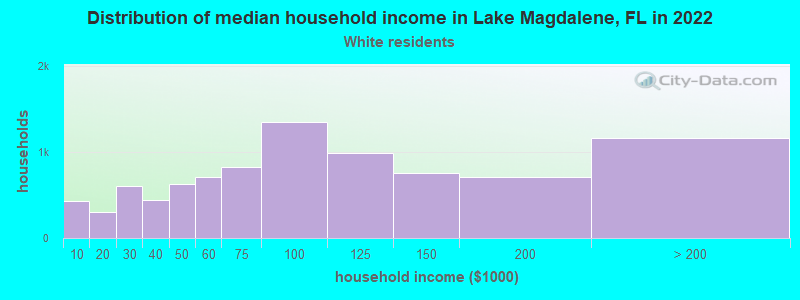
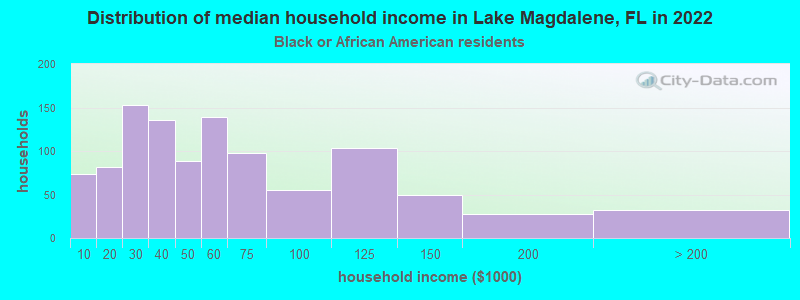
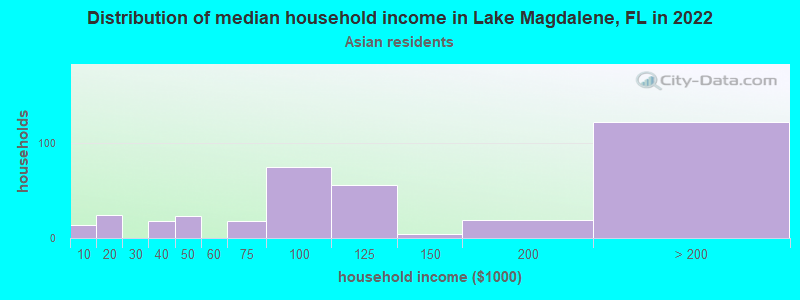
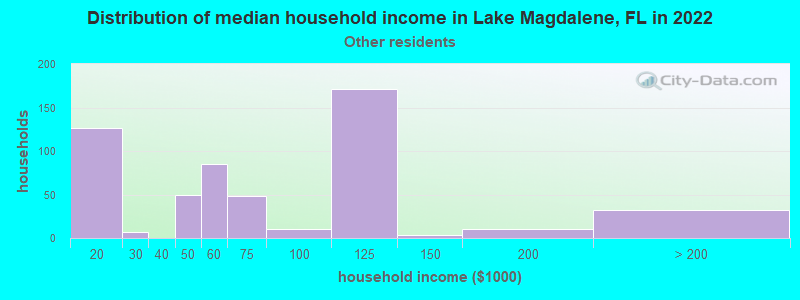
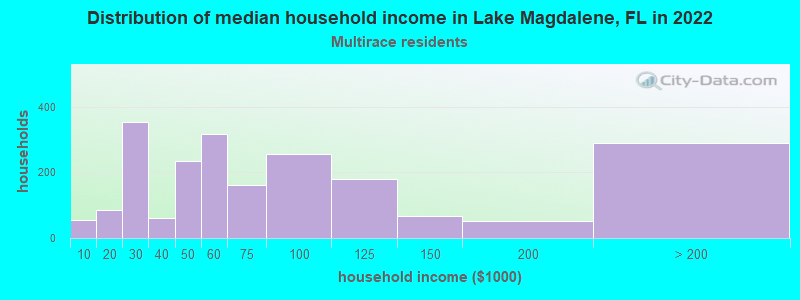
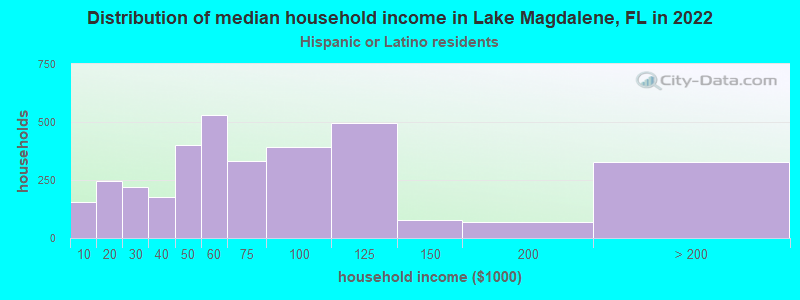
Income and house value in Lake Magdalene Median household income in 2022 $85,972 White non-Hispanic householders$44,966 Black householders$99,856 Asian householders$58,005 Some other race householders$58,345 Two or more races householders$59,899 Hispanic or Latino race householdersMedian 2022 house value $423,236 White Non-Hispanic householders$346,215 Black or African American householders$320,919 American Indian or Alaska Native householders $528,195 Asian householders$320,919 Some other race householders$402,470 Two or more races householders$392,654 Hispanic or Latino householders
Median age by race in Lake Magdalene
46.2 Median age for White residents45.3 48.4 34.0 Median age for Black or African American residents33.7 48.0 -670,487,105.3 Median age for American Indian / Alaska Native residents-676,245,210.1 -655,399,060.4 38.1 Median age for Asian residents34.8 39.5 -848,484,847.6 Median age for Native Hawaiian / Pacific Islander residents-776,729,559.0 -490,118,576.6 40.5 Median age for Other race residents40.0 43.1 32.0 Median age for Two or more races residents27.0 34.0 50.0 Median age for White alone residents47.9 51.5 33.3 Median age for Hispanic or Latino residents30.4 35.0
Owner/renter occupied households by race in Lake Magdalene
House owners and renters - White residents 6,878 76.4% Owner occupied2,126 23.6% Renter occupiedHouse owners and renters - Black or African American residents 400 39.2% Owner occupied621 60.8% Renter occupiedHouse owners and renters - Asian residents 304 80.5% Owner occupied74 19.5% Renter occupiedHouse owners and renters - Other race residents 218 41.3% Owner occupied310 58.7% Renter occupiedHouse owners and renters - Two or more races residents 1,614 75.3% Owner occupied530 24.7% Renter occupiedHouse owners and renters - White alone residents 6,417 78.1% Owner occupied1,804 21.9% Renter occupiedHouse owners and renters - Hispanic or Latino residents 2,201 63.0% Owner occupied1,294 37.0% Renter occupied
Language usage in Lake Magdalene
English speakers - Total 75.0% of residents of Lake Magdalene speak English at home.
18.7% of residents speak Spanish at home 3,080 54.8% Speak English very well2,543 45.2% Speak English less than very well6.3% of residents speak other language at home 1,196 63.6% Speak English very well684 36.4% Speak English less than very well
English speakers - Born in the United States 93.4% of residents of Lake Magdalene speak English at home.
4.9% of residents speak Spanish at home 471 81.1% Speak English very well110 18.9% Speak English less than very well1.9% of residents speak other language at home 206 91.6% Speak English very well19 8.4% Speak English less than very well
English speakers - Native, born elsewhere 46.5% of residents of Lake Magdalene speak English at home.
52.5% of residents speak Spanish at home 386 68.3% Speak English very well179 31.7% Speak English less than very well0.5% of residents speak other language at home 5 100.0% Speak English very well
English speakers - Foreign-born 16.8% of residents of Lake Magdalene speak English at home.
59.5% of residents speak Spanish at home 1,233 36.2% Speak English very well2,173 63.8% Speak English less than very well23.6% of residents speak other language at home 761 56.3% Speak English very well590 43.7% Speak English less than very well
White (Caucasian) - Speak only English Native:
96.7% (17,064)Foreign-born:
35.4% (383)
White (Caucasian) - Speak another language Native:
4.8% (845)Foreign-born:
67.7% (732)
Black or African American - Speak only English Native:
93.7% (1,751)Foreign-born:
79.7% (287)
Black or African American - Speak another language Native:
6.3% (117)Foreign-born:
19.8% (71)
Asian - Speak only English Native:
53.8% (181)Foreign-born:
18.0% (149)
Asian - Speak another language Native:
45.4% (152)Foreign-born:
82.0% (680)
Other race - Speak another language Native:
63.1% (178)Foreign-born:
100.0% (840)
Two or more races - Speak only English Native:
68.0% (2,405)Foreign-born:
4.6% (108)
Two or more races - Speak another language Native:
30.7% (1,087)Foreign-born:
96.3% (2,231)
White alone - Speak only English Native:
97.5% (16,010)Foreign-born:
50.0% (420)
White alone - Speak another language Native:
2.6% (419)Foreign-born:
51.1% (429)
Hispanic or Latino - Speak only English Native:
61.9% (3,162)Foreign-born:
3.0% (104)
Hispanic or Latino - Speak another language Native:
41.8% (2,138)Foreign-born:
97.2% (3,421)
Foreign-born residents in Lake Magdalene 5,508 residents are foreign born (11.3% Latin America , 3.2% Asia ).
This city:
16.9%Florida:
21.1%
Marital status for residents in Lake Magdalene Marital status - White (Caucasian) population 15 years and over
Males 27.0% Never married55.1% Now married2.7% Separated3.0% Widowed12.1% DivorcedFemales 23.3% Never married46.0% Now married1.6% Separated8.8% Widowed20.2% DivorcedWomen who gave birth in the past 12 months Now married:
74.9% (124)Unmarried:
25.1% (42)
Women who did not give birth in the past 12 months Now married:
49.0% (1,798)Unmarried:
51.0% (1,873)
Marital status - Black or African American population 15 years and over
Males 47.5% Never married36.3% Now married2.9% Separated2.1% Widowed11.2% DivorcedFemales 44.3% Never married25.2% Now married1.7% Separated15.1% Widowed13.7% DivorcedWomen who gave birth in the past 12 months Now married:
100.0% (16)Unmarried:
0.0% (0)
Women who did not give birth in the past 12 months Now married:
27.0% (128)Unmarried:
73.0% (346)
Marital status - Asian population 15 years and over
Males 23.6% Never married65.9% Now married4.3% Separated3.3% Widowed2.9% DivorcedFemales 16.1% Never married65.8% Now married6.0% Separated5.7% Widowed6.4% DivorcedWomen who gave birth in the past 12 months Now married:
85.7% (38)Unmarried:
14.3% (6)
Women who did not give birth in the past 12 months Now married:
75.5% (231)Unmarried:
24.5% (75)
Marital status - Other race population 15 years and over
Males 46.1% Never married47.8% Now married0.0% Separated0.0% Widowed6.1% DivorcedFemales 11.3% Never married70.9% Now married0.0% Separated2.8% Widowed15.0% DivorcedWomen who did not give birth in the past 12 months Now married:
72.3% (272)Unmarried:
27.7% (104)
Marital status - Two or more races population 15 years and over
Males 34.9% Never married46.9% Now married3.0% Separated1.0% Widowed14.3% DivorcedFemales 34.3% Never married41.7% Now married1.8% Separated8.6% Widowed13.7% DivorcedWomen who gave birth in the past 12 months Now married:
81.3% (260)Unmarried:
18.7% (60)
Women who did not give birth in the past 12 months Now married:
31.2% (335)Unmarried:
68.8% (739)
Marital status - White alone, not Hispanic / Latino population 15 years and over
Males 25.4% Never married55.7% Now married2.2% Separated3.0% Widowed13.7% DivorcedFemales 22.1% Never married46.9% Now married1.7% Separated9.7% Widowed19.6% DivorcedWomen who gave birth in the past 12 months Now married:
74.9% (147)Unmarried:
25.1% (49)
Women who did not give birth in the past 12 months Now married:
49.8% (1,612)Unmarried:
50.2% (1,624)
Marital status - Hispanic or Latino population 15 years and over
Males 36.1% Never married51.0% Now married3.8% Separated1.9% Widowed7.2% DivorcedFemales 26.8% Never married48.5% Now married1.2% Separated6.0% Widowed17.5% DivorcedWomen who gave birth in the past 12 months Now married:
80.9% (172)Unmarried:
19.1% (41)
Women who did not give birth in the past 12 months Now married:
50.1% (964)Unmarried:
49.9% (962)
Ancestries in Lake Magdalene
1,584 8.7% English1,391 7.7% Italian1,328 7.3% American1,166 6.4% Irish1,071 5.9% German270 1.5% Polish248 1.4% Turkish229 1.3% Eastern European167 0.9% European136 0.7% Scottish112 0.6% Swedish99 0.5% British83 0.5% Scotch-Irish80 0.4% Haitian80 0.4% Brazilian79 0.4% Jamaican71 0.4% Dutch65 0.4% French49 0.3% U.S. Virgin Islander43 0.2% Greek43 0.2% Norwegian38 0.2% Basque33 0.2% Canadian32 0.2% Bahamian32 0.2% Barbadian27 0.1% Lebanese27 0.1% French Canadian27 0.1% Ukrainian23 0.1% Russian21 0.1% Slavic19 0.1% Portuguese19 0.1% Moroccan18 0.10% Croatian15 0.08% Latvian15 0.08% Czech13 0.07% Hungarian12 0.07% Egyptian11 0.06% Northern European9 0.05% Iranian9 0.05% Romanian9 0.05% Swiss7 0.04% Austrian7 0.04% Welsh5 0.03% Finnish5 0.03% Danish2 0.01% Czechoslovakian
Geographical mobility in Lake Magdalene Same house 1 year ago 17,719 91.0% White (Caucasian)2,100 89.5% Black or African American1,044 84.5% Asian1,106 97.9% Other race6,333 92.2% Two or more races16,478 91.8% White alone, not Hispanic / Latino8,562 88.9% Hispanic or LatinoMoved within same county 1,218 6.3% White / Caucasian162 6.9% Black or African American107 8.7% Asian22 2.0% Other race346 5.0% Two or more races1,011 5.6% White alone, not Hispanic / Latino710 7.4% Hispanic or LatinoMoved within same state 242 1.2% White / Caucasian13 0.6% Black or African American15 1.2% Asian1 0.1% Other race30 0.4% Two or more races237 1.3% White alone, not Hispanic / Latino66 0.7% Hispanic or LatinoMoved from different state 207 1.1% White / Caucasian61 2.6% Black or African American5 0.5% Other race97 1.4% Two or more races169 0.9% White alone, not Hispanic / Latino120 1.2% Hispanic or LatinoMoved from abroad 41 0.2% White33 1.4% Black or African American17 1.4% Asian37 0.5% Two or more races26 0.1% White alone, not Hispanic / Latino114 1.2% Hispanic or Latino
Children Nativity (place of birth) in Lake Magdalene
Children under 6 years - Living with two parents Both parents native 1,750 100.0% NativeBoth parents foreign-born 214 92.9% Native16 7.1% Foreign-bornOne native, one foreign-born parent 134 100.0% NativeChildren under 6 years - Living with one parent Native parent 532 100.0% NativeForeign-born parent 176 100.0% NativeChildren 6 to 17 years - Living with two parents Both parents native 1,461 99.2% Native12 0.8% Foreign-bornBoth parents foreign-born 303 59.3% Native208 40.7% Foreign-bornOne native, one foreign-born parent 197 100.0% NativeChildren 6 to 17 years - Living with one parent Native parent 861 100.0% NativeForeign-born parent 315 58.9% Native220 41.1% Foreign-born
Grandparents responsible for own grandchildren in Lake Magdalene
Grandparents (30 to 59 years) White / Caucasian 10 29.4% Responsible for grandchildren23 70.6% Not responsible for grandchildrenBlack or African American 10 100.0% Not responsible for grandchildrenAsian 53 100.0% Not responsible for grandchildrenTwo or more races 36 100.0% Not responsible for grandchildrenWhite alone, not Hispanic / Latino 12 38.4% Responsible for grandchildren19 61.6% Not responsible for grandchildrenHispanic or Latino 13 100.0% Not responsible for grandchildrenGrandparents (60 years and over) White / Caucasian 98 41.7% Responsible for grandchildren137 58.3% Not responsible for grandchildrenAsian 71 100.0% Not responsible for grandchildrenTwo or more races 177 100.0% Not responsible for grandchildrenWhite alone, not Hispanic / Latino 24 15.1% Responsible for grandchildren133 84.9% Not responsible for grandchildrenHispanic or Latino 34 16.7% Responsible for grandchildren171 83.3% Not responsible for grandchildren