Races in Labelle, Texas (TX) Detailed Stats
Ancestries, Foreign-born residents, place of birth
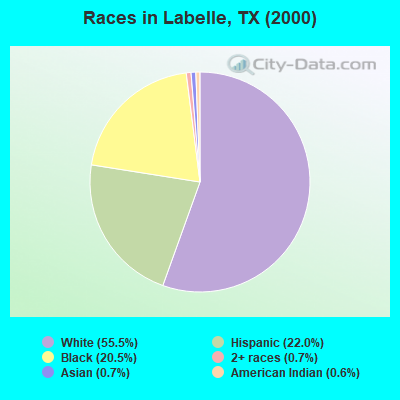
Race distribution in Labelle

- 6,31255.5%White alone
- 2,50522.0%Hispanic
- 2,33120.5%Black alone
- 770.7%Asian alone
- 790.7%Two or more races
- 650.6%American Indian alone
- 90.08%Native Hawaiian and Other
Pacific Islander alone - 20.02%Other race alone
2000
2022
-
- 10,933,31352.4%White alone
- 6,669,66632.0%Hispanic
- 2,364,25511.3%Black alone
- 554,4452.7%Asian alone
- 230,5671.1%Two or more races
- 68,8590.3%American Indian alone
- 19,9580.10%Other race alone
- 10,7570.05%Native Hawaiian and Other
Pacific Islander alone

-
- 12,070,64240.2%Hispanic
- 11,683,43038.9%White alone
- 3,508,70611.7%Black alone
- 1,608,1735.4%Asian alone
- 956,5603.2%Two or more races
- 125,7630.4%Other race alone
- 47,0230.2%American Indian alone
- 29,2750.10%Native Hawaiian and Other
Pacific Islander alone

Income and house value in Labelle
- Median household income in 2022
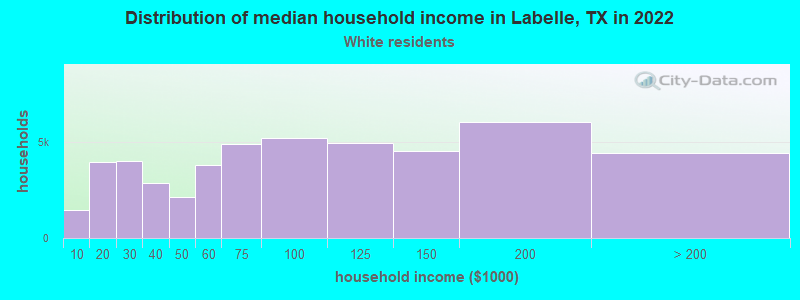
- $93,846White non-Hispanic householders
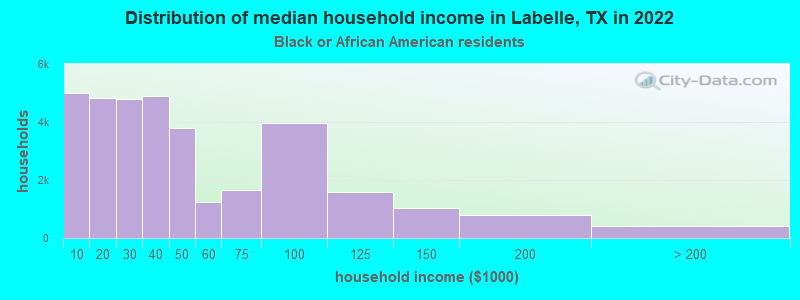
- $34,391Black householders
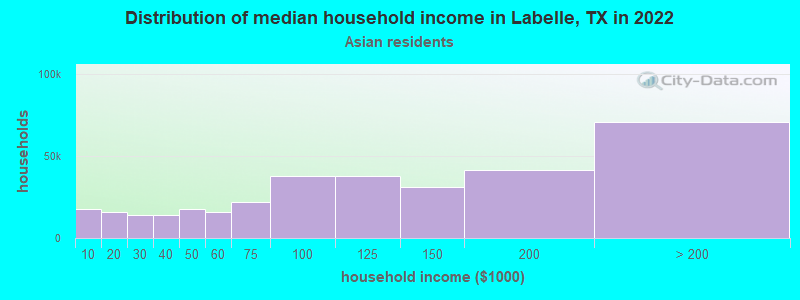
- $126,449Asian householders
- $75,786Some other race householders
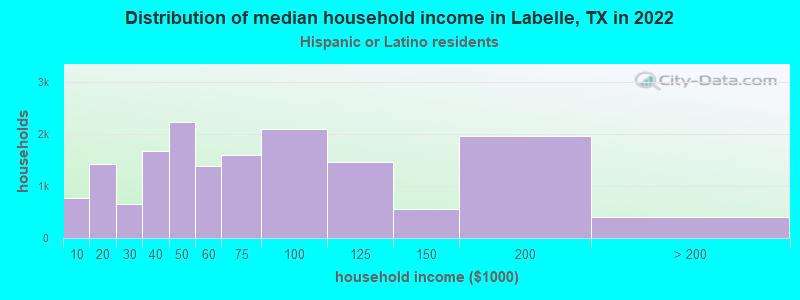
- $60,216Hispanic or Latino race householders
- Median 2022 house value
- $236,097White Non-Hispanic householders
- $75,849Black or African American householders
- $379,245Asian householders
- $141,768Hispanic or Latino householders
Household income for White non-Hispanic householders
Household income for Black householders
Household income for Asian householders
Household income for Hispanic or Latino race householders
Zip code: 77705