Races in Kingstowne, Virginia (VA) Detailed Stats
Data:
Races - White alone (%)
Races - White alone (% change since 2000)
Races - Black alone (%)
Races - Black alone (% change since 2000)
Races - American Indian alone (%)
Races - American Indian alone (% change since 2000)
Races - Asian alone (%)
Races - Asian alone (% change since 2000)
Races - Hispanic (%)
Races - Hispanic (% change since 2000)
Races - Native Hawaiian and Other Pacific Islander alone (%)
Races - Native Hawaiian and Other Pacific Islander alone (% change since 2000)
Races - Two or more races(%)
Races - Two or more races(% change since 2000)
Races - Other race alone (%)
Races - Other race alone (% change since 2000)
Racial diversity
Place of birth - Born in state of residence (%)
Place of birth - Born in state of residence (%) - White
Place of birth - Born in state of residence (%) - Black or African American
Place of birth - Born in state of residence (%) - Asian
Place of birth - Born in state of residence (%) - Hispanic or Latino
Place of birth - Born in state of residence (%) - American Indian and Alaska Native
Place of birth - Born in state of residence (%) - Multirace
Place of birth - Born in state of residence (%) - Other Race
Place of birth - Born in other state (%)
Place of birth - Born in other state (%) - White
Place of birth - Born in other state (%) - Black or African American
Place of birth - Born in other state (%) - Asian
Place of birth - Born in other state (%) - Hispanic or Latino
Place of birth - Born in other state (%) - American Indian and Alaska Native
Place of birth - Born in other state (%) - Multirace
Place of birth - Born in other state (%) - Other Race
Place of birth - Native, outside of US (%)
Place of birth - Native, outside of US (%) - White
Place of birth - Native, outside of US (%) - Black or African American
Place of birth - Native, outside of US (%) - Asian
Place of birth - Native, outside of US (%) - Hispanic or Latino
Place of birth - Native, outside of US (%) - American Indian and Alaska Native
Place of birth - Native, outside of US (%) - Multirace
Place of birth - Native, outside of US (%) - Other Race
Place of birth - Foreign born (%)
Place of birth - Foreign born (%) - White
Place of birth - Foreign born (%) - Black or African American
Place of birth - Foreign born (%) - Asian
Place of birth - Foreign born (%) - Hispanic or Latino
Place of birth - Foreign born (%) - American Indian and Alaska Native
Place of birth - Foreign born (%) - Multirace
Place of birth - Foreign born (%) - Other Race
Residents speaking English at home (%)
Residents speaking English at home - Born in the United States (%)
Residents speaking English at home - Native, born elsewhere (%)
Residents speaking English at home - Foreign born (%)
Residents speaking Spanish at home (%)
Residents speaking Spanish at home - Born in the United States (%)
Residents speaking Spanish at home - Native, born elsewhere (%)
Residents speaking Spanish at home - Foreign born (%)
Residents speaking other language at home (%)
Residents speaking other language at home - Born in the United States (%)
Residents speaking other language at home - Native, born elsewhere (%)
Residents speaking other language at home - Foreign born (%)
Marital status - Never married (%)
Marital status - Now married (%)
Marital status - Separated (%)
Marital status - Widowed (%)
Marital status - Divorced (%)
Ancestries Reported - Arab (%)
Ancestries Reported - Czech (%)
Ancestries Reported - Danish (%)
Ancestries Reported - Dutch (%)
Ancestries Reported - English (%)
Ancestries Reported - French (%)
Ancestries Reported - French Canadian (%)
Ancestries Reported - German (%)
Ancestries Reported - Greek (%)
Ancestries Reported - Hungarian (%)
Ancestries Reported - Irish (%)
Ancestries Reported - Italian (%)
Ancestries Reported - Lithuanian (%)
Ancestries Reported - Norwegian (%)
Ancestries Reported - Polish (%)
Ancestries Reported - Portuguese (%)
Ancestries Reported - Russian (%)
Ancestries Reported - Scotch-Irish (%)
Ancestries Reported - Scottish (%)
Ancestries Reported - Slovak (%)
Ancestries Reported - Subsaharan African (%)
Ancestries Reported - Swedish (%)
Ancestries Reported - Swiss (%)
Ancestries Reported - Ukrainian (%)
Ancestries Reported - United States (%)
Ancestries Reported - Welsh (%)
Ancestries Reported - West Indian (%)
Ancestries Reported - Other (%)
Geographical mobility - Same house 1 year ago (%)
Geographical mobility - Same house 1 year ago (%) - White
Geographical mobility - Same house 1 year ago (%) - Black or African American
Geographical mobility - Same house 1 year ago (%) - Asian
Geographical mobility - Same house 1 year ago (%) - Hispanic or Latino
Geographical mobility - Same house 1 year ago (%) - American Indian and Alaska Native
Geographical mobility - Same house 1 year ago (%) - Multirace
Geographical mobility - Same house 1 year ago (%) - Other Race
Geographical mobility - Moved within same county (%)
Geographical mobility - Moved within same county (%) - White
Geographical mobility - Moved within same county (%) - Black or African American
Geographical mobility - Moved within same county (%) - Asian
Geographical mobility - Moved within same county (%) - Hispanic or Latino
Geographical mobility - Moved within same county (%) - American Indian and Alaska Native
Geographical mobility - Moved within same county (%) - Multirace
Geographical mobility - Moved within same county (%) - Other Race
Geographical mobility - Moved from different county within same state (%)
Geographical mobility - Moved from different county within same state (%) - White
Geographical mobility - Moved from different county within same state (%) - Black or African American
Geographical mobility - Moved from different county within same state (%) - Asian
Geographical mobility - Moved from different county within same state (%) - Hispanic or Latino
Geographical mobility - Moved from different county within same state (%) - American Indian and Alaska Native
Geographical mobility - Moved from different county within same state (%) - Multirace
Geographical mobility - Moved from different county within same state (%) - Other Race
Geographical mobility - Moved from different state (%)
Geographical mobility - Moved from different state (%) - White
Geographical mobility - Moved from different state (%) - Black or African American
Geographical mobility - Moved from different state (%) - Asian
Geographical mobility - Moved from different state (%) - Hispanic or Latino
Geographical mobility - Moved from different state (%) - American Indian and Alaska Native
Geographical mobility - Moved from different state (%) - Multirace
Geographical mobility - Moved from different state (%) - Other Race
Geographical mobility - Moved from abroad (%)
Geographical mobility - Moved from abroad (%) - White
Geographical mobility - Moved from abroad (%) - Black or African American
Geographical mobility - Moved from abroad (%) - Asian
Geographical mobility - Moved from abroad (%) - Hispanic or Latino
Geographical mobility - Moved from abroad (%) - American Indian and Alaska Native
Geographical mobility - Moved from abroad (%) - Multirace
Geographical mobility - Moved from abroad (%) - Other Race
Place of birth for the foreign-born population - Ireland (%)
Place of birth for the foreign-born population - Denmark (%)
Place of birth for the foreign-born population - Norway (%)
Place of birth for the foreign-born population - Sweden (%)
Place of birth for the foreign-born population - United Kingdom (%)
Place of birth for the foreign-born population - England (%)
Place of birth for the foreign-born population - Scotland (%)
Place of birth for the foreign-born population - Other Northern Europe (%)
Place of birth for the foreign-born population - Austria (%)
Place of birth for the foreign-born population - Belgium (%)
Place of birth for the foreign-born population - France (%)
Place of birth for the foreign-born population - Germany (%)
Place of birth for the foreign-born population - Netherlands (%)
Place of birth for the foreign-born population - Switzerland (%)
Place of birth for the foreign-born population - Other Western Europe (%)
Place of birth for the foreign-born population - Greece (%)
Place of birth for the foreign-born population - Italy (%)
Place of birth for the foreign-born population - Portugal (%)
Place of birth for the foreign-born population - Spain (%)
Place of birth for the foreign-born population - Other Southern Europe (%)
Place of birth for the foreign-born population - Albania (%)
Place of birth for the foreign-born population - Belarus (%)
Place of birth for the foreign-born population - Bosnia and Herzegovina (%)
Place of birth for the foreign-born population - Bulgaria (%)
Place of birth for the foreign-born population - Croatia (%)
Place of birth for the foreign-born population - Czechoslovakia (%)
Place of birth for the foreign-born population - Hungary (%)
Place of birth for the foreign-born population - Latvia (%)
Place of birth for the foreign-born population - Lithuania (%)
Place of birth for the foreign-born population - North Macedonia (Macedonia) (%)
Place of birth for the foreign-born population - Moldova (%)
Place of birth for the foreign-born population - Poland (%)
Place of birth for the foreign-born population - Romania (%)
Place of birth for the foreign-born population - Russia (%)
Place of birth for the foreign-born population - Serbia (%)
Place of birth for the foreign-born population - Ukraine (%)
Place of birth for the foreign-born population - Other Eastern Europe (%)
Place of birth for the foreign-born population - China (%)
Place of birth for the foreign-born population - Hong Kong (%)
Place of birth for the foreign-born population - Taiwan (%)
Place of birth for the foreign-born population - Japan (%)
Place of birth for the foreign-born population - Korea (%)
Place of birth for the foreign-born population - Other Eastern Asia (%)
Place of birth for the foreign-born population - Afghanistan (%)
Place of birth for the foreign-born population - Bangladesh (%)
Place of birth for the foreign-born population - India (%)
Place of birth for the foreign-born population - Iran (%)
Place of birth for the foreign-born population - Kazakhstan (%)
Place of birth for the foreign-born population - Nepal (%)
Place of birth for the foreign-born population - Pakistan (%)
Place of birth for the foreign-born population - Sri Lanka (%)
Place of birth for the foreign-born population - Uzbekistan (%)
Place of birth for the foreign-born population - Other South Central Asia (%)
Place of birth for the foreign-born population - Burma (%)
Place of birth for the foreign-born population - Cambodia (%)
Place of birth for the foreign-born population - Indonesia (%)
Place of birth for the foreign-born population - Laos (%)
Place of birth for the foreign-born population - Malaysia (%)
Place of birth for the foreign-born population - Philippines (%)
Place of birth for the foreign-born population - Singapore (%)
Place of birth for the foreign-born population - Thailand (%)
Place of birth for the foreign-born population - Vietnam (%)
Place of birth for the foreign-born population - Other South Eastern Asia (%)
Place of birth for the foreign-born population - Armenia (%)
Place of birth for the foreign-born population - Iraq (%)
Place of birth for the foreign-born population - Israel (%)
Place of birth for the foreign-born population - Jordan (%)
Place of birth for the foreign-born population - Kuwait (%)
Place of birth for the foreign-born population - Lebanon (%)
Place of birth for the foreign-born population - Saudi Arabia (%)
Place of birth for the foreign-born population - Syria (%)
Place of birth for the foreign-born population - Turkey (%)
Place of birth for the foreign-born population - Yemen (%)
Place of birth for the foreign-born population - Other Western Asia (%)
Place of birth for the foreign-born population - Eritrea (%)
Place of birth for the foreign-born population - Ethiopia (%)
Place of birth for the foreign-born population - Kenya (%)
Place of birth for the foreign-born population - Somalia (%)
Place of birth for the foreign-born population - Uganda (%)
Place of birth for the foreign-born population - Zimbabwe (%)
Place of birth for the foreign-born population - Other Eastern Africa (%)
Place of birth for the foreign-born population - Cameroon (%)
Place of birth for the foreign-born population - Congo (%)
Place of birth for the foreign-born population - Democratic Republic of Congo (Zaire) (%)
Place of birth for the foreign-born population - Other Middle Africa (%)
Place of birth for the foreign-born population - Egypt (%)
Place of birth for the foreign-born population - Morocco (%)
Place of birth for the foreign-born population - Sudan (%)
Place of birth for the foreign-born population - Other Northern Africa (%)
Place of birth for the foreign-born population - South Africa (%)
Place of birth for the foreign-born population - Other Southern Africa (%)
Place of birth for the foreign-born population - Cabo Verde (%)
Place of birth for the foreign-born population - Ghana (%)
Place of birth for the foreign-born population - Liberia (%)
Place of birth for the foreign-born population - Nigeria (%)
Place of birth for the foreign-born population - Senegal (%)
Place of birth for the foreign-born population - Sierra Leone (%)
Place of birth for the foreign-born population - Other Western Africa (%)
Place of birth for the foreign-born population - Australia (%)
Place of birth for the foreign-born population - New Zealand (%)
Place of birth for the foreign-born population - Fiji (%)
Place of birth for the foreign-born population - Micronesia (%)
Place of birth for the foreign-born population - Bahamas (%)
Place of birth for the foreign-born population - Barbados (%)
Place of birth for the foreign-born population - Cuba (%)
Place of birth for the foreign-born population - Dominica (%)
Place of birth for the foreign-born population - Dominican Republic (%)
Place of birth for the foreign-born population - Grenada (%)
Place of birth for the foreign-born population - Haiti (%)
Place of birth for the foreign-born population - Jamaica (%)
Place of birth for the foreign-born population - St. Vincent and the Grenadines (%)
Place of birth for the foreign-born population - Trinidad and Tobago (%)
Place of birth for the foreign-born population - West Indies (%)
Place of birth for the foreign-born population - Other Caribbean (%)
Place of birth for the foreign-born population - Belize (%)
Place of birth for the foreign-born population - Costa Rica (%)
Place of birth for the foreign-born population - El Salvador (%)
Place of birth for the foreign-born population - Guatemala (%)
Place of birth for the foreign-born population - Honduras (%)
Place of birth for the foreign-born population - Mexico (%)
Place of birth for the foreign-born population - Nicaragua (%)
Place of birth for the foreign-born population - Panama (%)
Place of birth for the foreign-born population - Other Central America (%)
Place of birth for the foreign-born population - Argentina (%)
Place of birth for the foreign-born population - Bolivia (%)
Place of birth for the foreign-born population - Brazil (%)
Place of birth for the foreign-born population - Chile (%)
Place of birth for the foreign-born population - Colombia (%)
Place of birth for the foreign-born population - Ecuador (%)
Place of birth for the foreign-born population - Guyana (%)
Place of birth for the foreign-born population - Peru (%)
Place of birth for the foreign-born population - Uruguay (%)
Place of birth for the foreign-born population - Venezuela (%)
Place of birth for the foreign-born population - Other South America (%)
Place of birth for the foreign-born population - Canada (%)
Place of birth for the foreign-born population - Other Northern America (%)
Place of birth for the foreign-born population - Other (%)
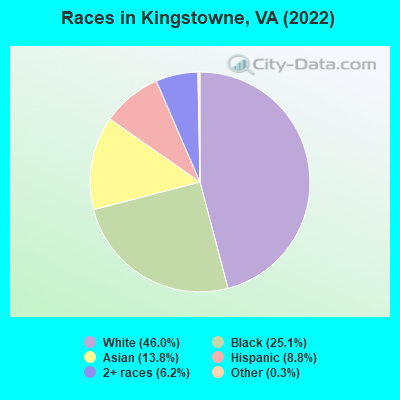
According to 2022 data, the most numerous races in Kingstowne, VA are White alone (8,329 residents), Black alone (4,551 residents), and Hispanic (1,603 residents). 71.3% of Kingstowne residents speak English at home.
Race distribution in Kingstowne 8,329 46.0% White alone 4,551 25.1% Black alone 2,496 13.8% Asian alone 1,603 8.8% Hispanic 1,129 6.2% Two or more races 52 0.3% Other race alone
2000 2022
4,965,637 70.2% White alone 1,376,378 19.4% Black alone 329,540 4.7% Hispanic 259,277 3.7% Asian alone 114,022 1.6% Two or more races 18,596 0.3% American Indian alone 11,685 0.2% Other race alone 3,380 0.05% Native Hawaiian and Other
5,095,130 58.7% White alone 1,594,785 18.4% Black alone 905,750 10.4% Hispanic 602,881 6.9% Asian alone 406,047 4.7% Two or more races 60,419 0.7% Other race alone 11,738 0.1% American Indian alone 6,869 0.08% Native Hawaiian and Other
Income and house value in Kingstowne Median household income in 2022 $155,190 White non-Hispanic householders$125,833 Black householders$97,728 Asian householders$88,245 Two or more races householders$132,147 Hispanic or Latino race householders
Median age by race in Kingstowne
42.8 Median age for White residents43.6 42.2 39.6 Median age for Black or African American residents37.2 42.4 -754,182,753.4 Median age for American Indian / Alaska Native residents-964,539,006.1 -669,005,847.3 41.5 Median age for Asian residents41.5 41.3 -666,666,666.0 Median age for Native Hawaiian / Pacific Islander residents-558,791,801.0 -584,518,166.9 25.7 Median age for Other race residents33.6 15.4 19.7 Median age for Two or more races residents26.3 14.4 42.5 Median age for White alone residents43.4 41.6 33.7 Median age for Hispanic or Latino residents33.5 38.4
Owner/renter occupied households by race in Kingstowne
House owners and renters - White residents 3,078 72.2% Owner occupied1,187 27.8% Renter occupiedHouse owners and renters - Black or African American residents 947 56.0% Owner occupied745 44.0% Renter occupiedHouse owners and renters - American Indian / Alaska Native residents 16 100.0% Renter occupiedHouse owners and renters - Asian residents 607 80.4% Owner occupied148 19.6% Renter occupiedHouse owners and renters - Other race residents 87 86.6% Owner occupied13 13.4% Renter occupiedHouse owners and renters - Two or more races residents 250 54.7% Owner occupied207 45.3% Renter occupiedHouse owners and renters - White alone residents 2,973 70.7% Owner occupied1,235 29.3% Renter occupiedHouse owners and renters - Hispanic or Latino residents 323 70.2% Owner occupied138 29.8% Renter occupied
Language usage in Kingstowne
English speakers - Total 71.3% of residents of Kingstowne speak English at home.
4.8% of residents speak Spanish at home 676 84.0% Speak English very well129 16.0% Speak English less than very well24.3% of residents speak other language at home 2,921 71.0% Speak English very well1,194 29.0% Speak English less than very well
English speakers - Born in the United States 94.5% of residents of Kingstowne speak English at home.
2.9% of residents speak Spanish at home 178 77.1% Speak English very well53 22.9% Speak English less than very well2.7% of residents speak other language at home 188 87.4% Speak English very well27 12.6% Speak English less than very well
English speakers - Native, born elsewhere 59.4% of residents of Kingstowne speak English at home.
11.5% of residents speak Spanish at home 82 100.0% Speak English very well31.2% of residents speak other language at home 105 47.3% Speak English very well117 52.7% Speak English less than very well
English speakers - Foreign-born 13.8% of residents of Kingstowne speak English at home.
10.5% of residents speak Spanish at home 361 79.5% Speak English very well93 20.5% Speak English less than very well75.0% of residents speak other language at home 2,152 66.5% Speak English very well1,082 33.5% Speak English less than very well
White (Caucasian) - Speak only English Native:
98.1% (6,936)Foreign-born:
24.9% (225)
White (Caucasian) - Speak another language Native:
3.2% (226)Foreign-born:
74.8% (676)
Black or African American - Speak only English Native:
95.6% (3,035)Foreign-born:
16.9% (197)
Black or African American - Speak another language Native:
2.9% (92)Foreign-born:
81.4% (947)
Asian - Speak only English Native:
47.6% (440)Foreign-born:
9.8% (151)
Asian - Speak another language Native:
52.6% (486)Foreign-born:
89.7% (1,380)
Other race - Speak another language Native:
6.8% (12)Foreign-born:
98.2% (78)
Two or more races - Speak another language Native:
42.9% (506)Foreign-born:
100.0% (418)
White alone - Speak only English Native:
96.9% (6,689)Foreign-born:
23.3% (223)
White alone - Speak another language Native:
3.3% (230)Foreign-born:
76.0% (726)
Hispanic or Latino - Speak only English Native:
72.4% (667)Foreign-born:
4.3% (21)
Hispanic or Latino - Speak another language Native:
32.2% (297)Foreign-born:
95.7% (472)
Foreign-born residents in Kingstowne
Marital status for residents in Kingstowne Marital status - White (Caucasian) population 15 years and over
Males 29.4% Never married61.5% Now married0.5% Separated0.6% Widowed7.9% DivorcedFemales 27.2% Never married51.3% Now married0.6% Separated5.9% Widowed15.0% DivorcedWomen who gave birth in the past 12 months Now married:
100.0% (135)Unmarried:
0.0% (0)
Women who did not give birth in the past 12 months Now married:
49.9% (920)Unmarried:
50.1% (924)
Marital status - Black or African American population 15 years and over
Males 45.0% Never married38.3% Now married0.7% Separated2.1% Widowed14.0% DivorcedFemales 35.3% Never married37.9% Now married0.0% Separated5.9% Widowed21.0% DivorcedWomen who gave birth in the past 12 months Now married:
100.0% (18)Unmarried:
0.0% (0)
Women who did not give birth in the past 12 months Now married:
25.4% (238)Unmarried:
74.6% (700)
Marital status - Asian population 15 years and over
Males 36.2% Never married47.6% Now married0.0% Separated0.0% Widowed16.2% DivorcedFemales 25.5% Never married57.6% Now married0.8% Separated5.8% Widowed10.2% DivorcedWomen who gave birth in the past 12 months Now married:
100.0% (16)Unmarried:
0.0% (0)
Women who did not give birth in the past 12 months Now married:
53.2% (387)Unmarried:
46.8% (341)
Marital status - Other race population 15 years and over
Males 9.7% Never married68.0% Now married0.0% Separated0.0% Widowed22.3% DivorcedFemales 62.7% Never married17.6% Now married0.0% Separated0.0% Widowed19.6% DivorcedWomen who did not give birth in the past 12 months Now married:
22.0% (11)Unmarried:
78.0% (39)
Marital status - Two or more races population 15 years and over
Males 46.5% Never married36.0% Now married0.0% Separated0.0% Widowed17.5% DivorcedFemales 18.9% Never married49.5% Now married2.1% Separated15.3% Widowed14.2% DivorcedWomen who gave birth in the past 12 months Now married:
42.5% (23)Unmarried:
57.5% (31)
Women who did not give birth in the past 12 months Now married:
59.7% (185)Unmarried:
40.3% (124)
Marital status - White alone, not Hispanic / Latino population 15 years and over
Males 30.1% Never married60.3% Now married0.6% Separated0.7% Widowed8.4% DivorcedFemales 26.9% Never married50.9% Now married0.7% Separated5.8% Widowed15.7% DivorcedWomen who gave birth in the past 12 months Now married:
100.0% (138)Unmarried:
0.0% (0)
Women who did not give birth in the past 12 months Now married:
50.3% (942)Unmarried:
49.7% (932)
Marital status - Hispanic or Latino population 15 years and over
Males 24.1% Never married64.8% Now married0.0% Separated0.0% Widowed11.0% DivorcedFemales 26.8% Never married50.1% Now married1.7% Separated13.6% Widowed7.9% DivorcedWomen who gave birth in the past 12 months Now married:
100.0% (18)Unmarried:
0.0% (0)
Women who did not give birth in the past 12 months Now married:
50.2% (126)Unmarried:
49.8% (125)
Ancestries in Kingstowne
686 6.7% Ethiopian554 5.4% American441 4.3% European350 3.4% English280 2.7% Afghan280 2.7% German245 2.4% Irish234 2.3% Italian231 2.3% African172 1.7% Moroccan171 1.7% Albanian114 1.1% Egyptian98 1.0% Sudanese73 0.7% Scotch-Irish65 0.6% Yugoslavian61 0.6% Scottish60 0.6% Polish57 0.6% Jamaican56 0.5% Lebanese55 0.5% Romanian49 0.5% Eastern European46 0.4% Iraqi42 0.4% Norwegian36 0.4% Swedish35 0.3% French32 0.3% Greek31 0.3% Canadian30 0.3% Dutch30 0.3% Iranian29 0.3% Israeli26 0.3% Russian23 0.2% Armenian22 0.2% Arab22 0.2% Nigerian21 0.2% Scandinavian21 0.2% Barbadian19 0.2% Palestinian17 0.2% British16 0.2% Slovak15 0.1% Croatian14 0.1% French Canadian13 0.1% Bulgarian12 0.1% Hungarian12 0.1% Belizean12 0.1% Lithuanian11 0.1% Finnish10 0.10% Haitian8 0.08% Latvian6 0.06% Turkish
Geographical mobility in Kingstowne Same house 1 year ago 7,353 87.7% White (Caucasian)4,288 94.6% Black or African American2,219 88.7% Asian239 72.5% Other race1,673 87.6% Two or more races7,208 87.0% White alone, not Hispanic / Latino1,302 85.2% Hispanic or LatinoMoved within same county 347 4.1% White / Caucasian10 0.2% Black or African American23 100.0% American Indian / Alaska Native63 2.5% Asian37 11.4% Other race60 3.1% Two or more races364 4.4% White alone, not Hispanic / Latino117 7.7% Hispanic or LatinoMoved within same state 126 1.5% White / Caucasian96 2.1% Black or African American53 2.1% Asian9 2.8% Other race49 2.6% Two or more races133 1.6% White alone, not Hispanic / LatinoMoved from different state 468 5.6% White / Caucasian288 6.3% Black or African American132 5.3% Asian25 7.7% Other race73 3.8% Two or more races498 6.0% White alone, not Hispanic / Latino80 5.3% Hispanic or LatinoMoved from abroad 80 1.0% White70 0.8% White alone, not Hispanic / Latino26 1.7% Hispanic or Latino
Children Nativity (place of birth) in Kingstowne
Children under 6 years - Living with two parents Both parents native 599 100.0% NativeBoth parents foreign-born 374 100.0% NativeOne native, one foreign-born parent 115 100.0% NativeChildren under 6 years - Living with one parent Native parent 211 100.0% NativeForeign-born parent 42 63.6% Native24 36.4% Foreign-bornChildren 6 to 17 years - Living with two parents Both parents native 776 100.0% NativeBoth parents foreign-born 788 82.2% Native171 17.8% Foreign-bornOne native, one foreign-born parent 161 100.0% NativeChildren 6 to 17 years - Living with one parent Native parent 745 100.0% NativeForeign-born parent 126 53.9% Native108 46.1% Foreign-born
Grandparents responsible for own grandchildren in Kingstowne
Grandparents (30 to 59 years) White / Caucasian 15 100.0% Not responsible for grandchildrenBlack or African American 13 100.0% Not responsible for grandchildrenWhite alone, not Hispanic / Latino 34 100.0% Not responsible for grandchildren
Grandparents (60 years and over) White / Caucasian 49 100.0% Not responsible for grandchildrenWhite alone, not Hispanic / Latino 40 100.0% Not responsible for grandchildren