Races in Kings Park West, Virginia (VA) Detailed Stats
Data:
Races - White alone (%)
Races - White alone (% change since 2000)
Races - Black alone (%)
Races - Black alone (% change since 2000)
Races - American Indian alone (%)
Races - American Indian alone (% change since 2000)
Races - Asian alone (%)
Races - Asian alone (% change since 2000)
Races - Hispanic (%)
Races - Hispanic (% change since 2000)
Races - Native Hawaiian and Other Pacific Islander alone (%)
Races - Native Hawaiian and Other Pacific Islander alone (% change since 2000)
Races - Two or more races(%)
Races - Two or more races(% change since 2000)
Races - Other race alone (%)
Races - Other race alone (% change since 2000)
Racial diversity
Place of birth - Born in state of residence (%)
Place of birth - Born in state of residence (%) - White
Place of birth - Born in state of residence (%) - Black or African American
Place of birth - Born in state of residence (%) - Asian
Place of birth - Born in state of residence (%) - Hispanic or Latino
Place of birth - Born in state of residence (%) - American Indian and Alaska Native
Place of birth - Born in state of residence (%) - Multirace
Place of birth - Born in state of residence (%) - Other Race
Place of birth - Born in other state (%)
Place of birth - Born in other state (%) - White
Place of birth - Born in other state (%) - Black or African American
Place of birth - Born in other state (%) - Asian
Place of birth - Born in other state (%) - Hispanic or Latino
Place of birth - Born in other state (%) - American Indian and Alaska Native
Place of birth - Born in other state (%) - Multirace
Place of birth - Born in other state (%) - Other Race
Place of birth - Native, outside of US (%)
Place of birth - Native, outside of US (%) - White
Place of birth - Native, outside of US (%) - Black or African American
Place of birth - Native, outside of US (%) - Asian
Place of birth - Native, outside of US (%) - Hispanic or Latino
Place of birth - Native, outside of US (%) - American Indian and Alaska Native
Place of birth - Native, outside of US (%) - Multirace
Place of birth - Native, outside of US (%) - Other Race
Place of birth - Foreign born (%)
Place of birth - Foreign born (%) - White
Place of birth - Foreign born (%) - Black or African American
Place of birth - Foreign born (%) - Asian
Place of birth - Foreign born (%) - Hispanic or Latino
Place of birth - Foreign born (%) - American Indian and Alaska Native
Place of birth - Foreign born (%) - Multirace
Place of birth - Foreign born (%) - Other Race
Residents speaking English at home (%)
Residents speaking English at home - Born in the United States (%)
Residents speaking English at home - Native, born elsewhere (%)
Residents speaking English at home - Foreign born (%)
Residents speaking Spanish at home (%)
Residents speaking Spanish at home - Born in the United States (%)
Residents speaking Spanish at home - Native, born elsewhere (%)
Residents speaking Spanish at home - Foreign born (%)
Residents speaking other language at home (%)
Residents speaking other language at home - Born in the United States (%)
Residents speaking other language at home - Native, born elsewhere (%)
Residents speaking other language at home - Foreign born (%)
Marital status - Never married (%)
Marital status - Now married (%)
Marital status - Separated (%)
Marital status - Widowed (%)
Marital status - Divorced (%)
Ancestries Reported - Arab (%)
Ancestries Reported - Czech (%)
Ancestries Reported - Danish (%)
Ancestries Reported - Dutch (%)
Ancestries Reported - English (%)
Ancestries Reported - French (%)
Ancestries Reported - French Canadian (%)
Ancestries Reported - German (%)
Ancestries Reported - Greek (%)
Ancestries Reported - Hungarian (%)
Ancestries Reported - Irish (%)
Ancestries Reported - Italian (%)
Ancestries Reported - Lithuanian (%)
Ancestries Reported - Norwegian (%)
Ancestries Reported - Polish (%)
Ancestries Reported - Portuguese (%)
Ancestries Reported - Russian (%)
Ancestries Reported - Scotch-Irish (%)
Ancestries Reported - Scottish (%)
Ancestries Reported - Slovak (%)
Ancestries Reported - Subsaharan African (%)
Ancestries Reported - Swedish (%)
Ancestries Reported - Swiss (%)
Ancestries Reported - Ukrainian (%)
Ancestries Reported - United States (%)
Ancestries Reported - Welsh (%)
Ancestries Reported - West Indian (%)
Ancestries Reported - Other (%)
Geographical mobility - Same house 1 year ago (%)
Geographical mobility - Same house 1 year ago (%) - White
Geographical mobility - Same house 1 year ago (%) - Black or African American
Geographical mobility - Same house 1 year ago (%) - Asian
Geographical mobility - Same house 1 year ago (%) - Hispanic or Latino
Geographical mobility - Same house 1 year ago (%) - American Indian and Alaska Native
Geographical mobility - Same house 1 year ago (%) - Multirace
Geographical mobility - Same house 1 year ago (%) - Other Race
Geographical mobility - Moved within same county (%)
Geographical mobility - Moved within same county (%) - White
Geographical mobility - Moved within same county (%) - Black or African American
Geographical mobility - Moved within same county (%) - Asian
Geographical mobility - Moved within same county (%) - Hispanic or Latino
Geographical mobility - Moved within same county (%) - American Indian and Alaska Native
Geographical mobility - Moved within same county (%) - Multirace
Geographical mobility - Moved within same county (%) - Other Race
Geographical mobility - Moved from different county within same state (%)
Geographical mobility - Moved from different county within same state (%) - White
Geographical mobility - Moved from different county within same state (%) - Black or African American
Geographical mobility - Moved from different county within same state (%) - Asian
Geographical mobility - Moved from different county within same state (%) - Hispanic or Latino
Geographical mobility - Moved from different county within same state (%) - American Indian and Alaska Native
Geographical mobility - Moved from different county within same state (%) - Multirace
Geographical mobility - Moved from different county within same state (%) - Other Race
Geographical mobility - Moved from different state (%)
Geographical mobility - Moved from different state (%) - White
Geographical mobility - Moved from different state (%) - Black or African American
Geographical mobility - Moved from different state (%) - Asian
Geographical mobility - Moved from different state (%) - Hispanic or Latino
Geographical mobility - Moved from different state (%) - American Indian and Alaska Native
Geographical mobility - Moved from different state (%) - Multirace
Geographical mobility - Moved from different state (%) - Other Race
Geographical mobility - Moved from abroad (%)
Geographical mobility - Moved from abroad (%) - White
Geographical mobility - Moved from abroad (%) - Black or African American
Geographical mobility - Moved from abroad (%) - Asian
Geographical mobility - Moved from abroad (%) - Hispanic or Latino
Geographical mobility - Moved from abroad (%) - American Indian and Alaska Native
Geographical mobility - Moved from abroad (%) - Multirace
Geographical mobility - Moved from abroad (%) - Other Race
Place of birth for the foreign-born population - Ireland (%)
Place of birth for the foreign-born population - Denmark (%)
Place of birth for the foreign-born population - Norway (%)
Place of birth for the foreign-born population - Sweden (%)
Place of birth for the foreign-born population - United Kingdom (%)
Place of birth for the foreign-born population - England (%)
Place of birth for the foreign-born population - Scotland (%)
Place of birth for the foreign-born population - Other Northern Europe (%)
Place of birth for the foreign-born population - Austria (%)
Place of birth for the foreign-born population - Belgium (%)
Place of birth for the foreign-born population - France (%)
Place of birth for the foreign-born population - Germany (%)
Place of birth for the foreign-born population - Netherlands (%)
Place of birth for the foreign-born population - Switzerland (%)
Place of birth for the foreign-born population - Other Western Europe (%)
Place of birth for the foreign-born population - Greece (%)
Place of birth for the foreign-born population - Italy (%)
Place of birth for the foreign-born population - Portugal (%)
Place of birth for the foreign-born population - Spain (%)
Place of birth for the foreign-born population - Other Southern Europe (%)
Place of birth for the foreign-born population - Albania (%)
Place of birth for the foreign-born population - Belarus (%)
Place of birth for the foreign-born population - Bosnia and Herzegovina (%)
Place of birth for the foreign-born population - Bulgaria (%)
Place of birth for the foreign-born population - Croatia (%)
Place of birth for the foreign-born population - Czechoslovakia (%)
Place of birth for the foreign-born population - Hungary (%)
Place of birth for the foreign-born population - Latvia (%)
Place of birth for the foreign-born population - Lithuania (%)
Place of birth for the foreign-born population - North Macedonia (Macedonia) (%)
Place of birth for the foreign-born population - Moldova (%)
Place of birth for the foreign-born population - Poland (%)
Place of birth for the foreign-born population - Romania (%)
Place of birth for the foreign-born population - Russia (%)
Place of birth for the foreign-born population - Serbia (%)
Place of birth for the foreign-born population - Ukraine (%)
Place of birth for the foreign-born population - Other Eastern Europe (%)
Place of birth for the foreign-born population - China (%)
Place of birth for the foreign-born population - Hong Kong (%)
Place of birth for the foreign-born population - Taiwan (%)
Place of birth for the foreign-born population - Japan (%)
Place of birth for the foreign-born population - Korea (%)
Place of birth for the foreign-born population - Other Eastern Asia (%)
Place of birth for the foreign-born population - Afghanistan (%)
Place of birth for the foreign-born population - Bangladesh (%)
Place of birth for the foreign-born population - India (%)
Place of birth for the foreign-born population - Iran (%)
Place of birth for the foreign-born population - Kazakhstan (%)
Place of birth for the foreign-born population - Nepal (%)
Place of birth for the foreign-born population - Pakistan (%)
Place of birth for the foreign-born population - Sri Lanka (%)
Place of birth for the foreign-born population - Uzbekistan (%)
Place of birth for the foreign-born population - Other South Central Asia (%)
Place of birth for the foreign-born population - Burma (%)
Place of birth for the foreign-born population - Cambodia (%)
Place of birth for the foreign-born population - Indonesia (%)
Place of birth for the foreign-born population - Laos (%)
Place of birth for the foreign-born population - Malaysia (%)
Place of birth for the foreign-born population - Philippines (%)
Place of birth for the foreign-born population - Singapore (%)
Place of birth for the foreign-born population - Thailand (%)
Place of birth for the foreign-born population - Vietnam (%)
Place of birth for the foreign-born population - Other South Eastern Asia (%)
Place of birth for the foreign-born population - Armenia (%)
Place of birth for the foreign-born population - Iraq (%)
Place of birth for the foreign-born population - Israel (%)
Place of birth for the foreign-born population - Jordan (%)
Place of birth for the foreign-born population - Kuwait (%)
Place of birth for the foreign-born population - Lebanon (%)
Place of birth for the foreign-born population - Saudi Arabia (%)
Place of birth for the foreign-born population - Syria (%)
Place of birth for the foreign-born population - Turkey (%)
Place of birth for the foreign-born population - Yemen (%)
Place of birth for the foreign-born population - Other Western Asia (%)
Place of birth for the foreign-born population - Eritrea (%)
Place of birth for the foreign-born population - Ethiopia (%)
Place of birth for the foreign-born population - Kenya (%)
Place of birth for the foreign-born population - Somalia (%)
Place of birth for the foreign-born population - Uganda (%)
Place of birth for the foreign-born population - Zimbabwe (%)
Place of birth for the foreign-born population - Other Eastern Africa (%)
Place of birth for the foreign-born population - Cameroon (%)
Place of birth for the foreign-born population - Congo (%)
Place of birth for the foreign-born population - Democratic Republic of Congo (Zaire) (%)
Place of birth for the foreign-born population - Other Middle Africa (%)
Place of birth for the foreign-born population - Egypt (%)
Place of birth for the foreign-born population - Morocco (%)
Place of birth for the foreign-born population - Sudan (%)
Place of birth for the foreign-born population - Other Northern Africa (%)
Place of birth for the foreign-born population - South Africa (%)
Place of birth for the foreign-born population - Other Southern Africa (%)
Place of birth for the foreign-born population - Cabo Verde (%)
Place of birth for the foreign-born population - Ghana (%)
Place of birth for the foreign-born population - Liberia (%)
Place of birth for the foreign-born population - Nigeria (%)
Place of birth for the foreign-born population - Senegal (%)
Place of birth for the foreign-born population - Sierra Leone (%)
Place of birth for the foreign-born population - Other Western Africa (%)
Place of birth for the foreign-born population - Australia (%)
Place of birth for the foreign-born population - New Zealand (%)
Place of birth for the foreign-born population - Fiji (%)
Place of birth for the foreign-born population - Micronesia (%)
Place of birth for the foreign-born population - Bahamas (%)
Place of birth for the foreign-born population - Barbados (%)
Place of birth for the foreign-born population - Cuba (%)
Place of birth for the foreign-born population - Dominica (%)
Place of birth for the foreign-born population - Dominican Republic (%)
Place of birth for the foreign-born population - Grenada (%)
Place of birth for the foreign-born population - Haiti (%)
Place of birth for the foreign-born population - Jamaica (%)
Place of birth for the foreign-born population - St. Vincent and the Grenadines (%)
Place of birth for the foreign-born population - Trinidad and Tobago (%)
Place of birth for the foreign-born population - West Indies (%)
Place of birth for the foreign-born population - Other Caribbean (%)
Place of birth for the foreign-born population - Belize (%)
Place of birth for the foreign-born population - Costa Rica (%)
Place of birth for the foreign-born population - El Salvador (%)
Place of birth for the foreign-born population - Guatemala (%)
Place of birth for the foreign-born population - Honduras (%)
Place of birth for the foreign-born population - Mexico (%)
Place of birth for the foreign-born population - Nicaragua (%)
Place of birth for the foreign-born population - Panama (%)
Place of birth for the foreign-born population - Other Central America (%)
Place of birth for the foreign-born population - Argentina (%)
Place of birth for the foreign-born population - Bolivia (%)
Place of birth for the foreign-born population - Brazil (%)
Place of birth for the foreign-born population - Chile (%)
Place of birth for the foreign-born population - Colombia (%)
Place of birth for the foreign-born population - Ecuador (%)
Place of birth for the foreign-born population - Guyana (%)
Place of birth for the foreign-born population - Peru (%)
Place of birth for the foreign-born population - Uruguay (%)
Place of birth for the foreign-born population - Venezuela (%)
Place of birth for the foreign-born population - Other South America (%)
Place of birth for the foreign-born population - Canada (%)
Place of birth for the foreign-born population - Other Northern America (%)
Place of birth for the foreign-born population - Other (%)
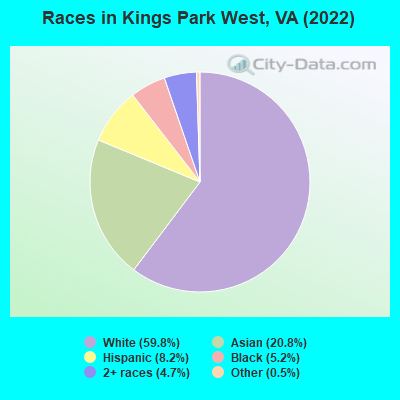
According to 2022 data, the most numerous races in Kings Park West, VA are White alone (7,874 residents), Black alone (680 residents), and Hispanic (1,081 residents). 71.2% of Kings Park West residents speak English at home.
Race distribution in Kings Park West 7,874 59.8% White alone 2,740 20.8% Asian alone 1,081 8.2% Hispanic 680 5.2% Black alone 616 4.7% Two or more races 63 0.5% Other race alone 6 0.05% Native Hawaiian and Other
2000 2022
4,965,637 70.2% White alone 1,376,378 19.4% Black alone 329,540 4.7% Hispanic 259,277 3.7% Asian alone 114,022 1.6% Two or more races 18,596 0.3% American Indian alone 11,685 0.2% Other race alone 3,380 0.05% Native Hawaiian and Other
5,095,130 58.7% White alone 1,594,785 18.4% Black alone 905,750 10.4% Hispanic 602,881 6.9% Asian alone 406,047 4.7% Two or more races 60,419 0.7% Other race alone 11,738 0.1% American Indian alone 6,869 0.08% Native Hawaiian and Other
Income and house value in Kings Park West Median household income in 2022 $168,146 White non-Hispanic householders$128,519 Black householders$131,075 Asian householders$102,158 Some other race householders$189,256 Two or more races householders$188,574 Hispanic or Latino race householders
Median age by race in Kings Park West
45.2 Median age for White residents42.8 48.8 30.1 Median age for Black or African American residents28.6 30.9 -754,182,753.4 Median age for American Indian / Alaska Native residents-964,539,006.1 -669,005,847.3 43.1 Median age for Asian residents33.5 46.4 -666,666,666.0 Median age for Native Hawaiian / Pacific Islander residents-558,791,801.0 -584,518,166.9 52.1 Median age for Other race residents27.1 59.4 19.9 Median age for Two or more races residents20.4 19.5 45.2 Median age for White alone residents42.6 48.6 41.2 Median age for Hispanic or Latino residents40.9 41.8
Owner/renter occupied households by race in Kings Park West
House owners and renters - White residents 2,565 87.4% Owner occupied371 12.6% Renter occupiedHouse owners and renters - Black or African American residents 72 61.5% Owner occupied45 38.5% Renter occupiedHouse owners and renters - Asian residents 736 88.5% Owner occupied95 11.5% Renter occupiedHouse owners and renters - Native Hawaiian / Pacific Islander residents 7 100.0% Owner occupiedHouse owners and renters - Other race residents 40 100.0% Owner occupiedHouse owners and renters - Two or more races residents 298 90.7% Owner occupied30 9.3% Renter occupiedHouse owners and renters - White alone residents 2,548 87.1% Owner occupied378 12.9% Renter occupiedHouse owners and renters - Hispanic or Latino residents 268 88.2% Owner occupied36 11.8% Renter occupied
Language usage in Kings Park West
English speakers - Total 71.2% of residents of Kings Park West speak English at home.
6.4% of residents speak Spanish at home 573 71.7% Speak English very well226 28.3% Speak English less than very well22.7% of residents speak other language at home 1,705 59.6% Speak English very well1,157 40.4% Speak English less than very well
English speakers - Born in the United States 94.3% of residents of Kings Park West speak English at home.
1.5% of residents speak Spanish at home 64 71.9% Speak English very well25 28.1% Speak English less than very well4.2% of residents speak other language at home 249 100.0% Speak English very well
English speakers - Native, born elsewhere 72.1% of residents of Kings Park West speak English at home.
22.4% of residents speak Spanish at home 39 39.8% Speak English very well59 60.2% Speak English less than very well3.4% of residents speak other language at home 15 100.0% Speak English very well
English speakers - Foreign-born 11.3% of residents of Kings Park West speak English at home.
11.9% of residents speak Spanish at home 219 61.5% Speak English very well137 38.5% Speak English less than very well76.2% of residents speak other language at home 1,202 52.9% Speak English very well1,069 47.1% Speak English less than very well
White (Caucasian) - Speak only English Native:
95.5% (6,968)Foreign-born:
22.8% (97)
White (Caucasian) - Speak another language Native:
5.0% (367)Foreign-born:
76.2% (326)
Black or African American - Speak only English Native:
93.9% (330)Foreign-born:
19.1% (49)
Black or African American - Speak another language Native:
5.0% (18)Foreign-born:
79.8% (207)
Asian - Speak only English Native:
44.2% (345)Foreign-born:
8.0% (153)
Asian - Speak another language Native:
56.2% (439)Foreign-born:
91.3% (1,747)
Other race - Speak another language Native:
27.1% (21)Foreign-born:
98.2% (27)
Two or more races - Speak only English Native:
86.3% (807)Foreign-born:
11.5% (32)
Two or more races - Speak another language Native:
12.8% (120)Foreign-born:
88.4% (243)
White alone - Speak only English Native:
95.2% (6,914)Foreign-born:
25.7% (100)
White alone - Speak another language Native:
4.8% (350)Foreign-born:
74.0% (287)
Hispanic or Latino - Speak only English Native:
68.3% (448)Foreign-born:
3.0% (12)
Hispanic or Latino - Speak another language Native:
35.5% (233)Foreign-born:
96.9% (387)
Foreign-born residents in Kings Park West
Marital status for residents in Kings Park West Marital status - White (Caucasian) population 15 years and over
Males 40.4% Never married54.6% Now married1.3% Separated1.6% Widowed2.1% DivorcedFemales 27.1% Never married59.6% Now married0.5% Separated4.6% Widowed8.3% DivorcedWomen who gave birth in the past 12 months Now married:
80.0% (39)Unmarried:
20.0% (10)
Women who did not give birth in the past 12 months Now married:
48.3% (738)Unmarried:
51.7% (790)
Marital status - Black or African American population 15 years and over
Males 51.9% Never married37.0% Now married0.0% Separated0.0% Widowed11.1% DivorcedFemales 37.2% Never married54.3% Now married0.0% Separated0.4% Widowed8.2% DivorcedWomen who gave birth in the past 12 months Now married:
100.0% (10)Unmarried:
0.0% (0)
Women who did not give birth in the past 12 months Now married:
40.2% (75)Unmarried:
59.8% (112)
Marital status - Asian population 15 years and over
Males 43.0% Never married55.2% Now married0.7% Separated0.4% Widowed0.7% DivorcedFemales 28.6% Never married55.4% Now married0.6% Separated7.1% Widowed8.3% DivorcedWomen who gave birth in the past 12 months Now married:
100.0% (31)Unmarried:
0.0% (0)
Women who did not give birth in the past 12 months Now married:
51.3% (371)Unmarried:
48.7% (352)
Marital status - Other race population 15 years and over
Males 71.4% Never married28.6% Now married0.0% Separated0.0% Widowed0.0% DivorcedFemales 47.5% Never married37.3% Now married0.0% Separated0.0% Widowed15.3% DivorcedWomen who gave birth in the past 12 months Now married:
100.0% (10)Unmarried:
0.0% (0)
Women who did not give birth in the past 12 months Now married:
100.0% (7)Unmarried:
0.0% (0)
Marital status - Two or more races population 15 years and over
Males 42.9% Never married51.0% Now married0.0% Separated0.0% Widowed6.2% DivorcedFemales 30.9% Never married64.3% Now married0.0% Separated2.8% Widowed2.0% DivorcedWomen who did not give birth in the past 12 months Now married:
47.6% (94)Unmarried:
52.4% (103)
Marital status - White alone, not Hispanic / Latino population 15 years and over
Males 40.4% Never married54.6% Now married1.1% Separated1.7% Widowed2.1% DivorcedFemales 27.5% Never married58.6% Now married0.5% Separated4.9% Widowed8.6% DivorcedWomen who gave birth in the past 12 months Now married:
80.0% (43)Unmarried:
20.0% (11)
Women who did not give birth in the past 12 months Now married:
46.4% (712)Unmarried:
53.6% (822)
Marital status - Hispanic or Latino population 15 years and over
Males 34.9% Never married56.8% Now married1.8% Separated0.0% Widowed6.4% DivorcedFemales 25.1% Never married68.3% Now married0.0% Separated1.8% Widowed4.9% DivorcedWomen who gave birth in the past 12 months Now married:
100.0% (8)Unmarried:
0.0% (0)
Women who did not give birth in the past 12 months Now married:
55.2% (126)Unmarried:
44.8% (102)
Ancestries in Kings Park West
601 9.5% Irish488 7.7% English434 6.8% American412 6.5% German236 3.7% European156 2.5% Italian114 1.8% Ethiopian110 1.7% Eastern European101 1.6% Palestinian84 1.3% Nigerian72 1.1% African66 1.0% Polish53 0.8% French45 0.7% Armenian44 0.7% West Indian42 0.7% Swedish40 0.6% Greek38 0.6% Romanian38 0.6% Slavic37 0.6% Swiss36 0.6% Dutch36 0.6% Scottish27 0.4% Egyptian23 0.4% Norwegian23 0.4% Danish21 0.3% British19 0.3% Moroccan19 0.3% Arab19 0.3% South African17 0.3% Scotch-Irish14 0.2% French Canadian14 0.2% Iranian9 0.1% Northern European8 0.1% Somali6 0.09% Cypriot5 0.08% Ghanaian5 0.08% Czech4 0.06% Latvian3 0.05% Bulgarian
Geographical mobility in Kings Park West Same house 1 year ago 6,930 89.6% White (Caucasian)580 85.7% Black or African American2,544 92.9% Asian8 95.3% Native Hawaiian / Pacific Islander75 55.2% Other race1,198 86.5% Two or more races6,975 89.4% White alone, not Hispanic / Latino1,001 92.4% Hispanic or LatinoMoved within same county 347 4.5% White / Caucasian51 7.6% Black or African American127 4.6% Asian149 10.8% Two or more races339 4.3% White alone, not Hispanic / Latino48 4.4% Hispanic or LatinoMoved within same state 312 4.0% White / Caucasian19 2.8% Black or African American26 19.0% Other race330 4.2% White alone, not Hispanic / LatinoMoved from different state 117 1.5% White / Caucasian44 1.6% Asian124 1.6% White alone, not Hispanic / LatinoMoved from abroad 31 0.4% White31 22.8% Other race21 1.5% Two or more races35 0.4% White alone, not Hispanic / Latino15 1.4% Hispanic or Latino
Children Nativity (place of birth) in Kings Park West
Children under 6 years - Living with two parents Both parents native 361 100.0% NativeBoth parents foreign-born 122 95.1% Native6 4.9% Foreign-bornOne native, one foreign-born parent 50 100.0% NativeChildren under 6 years - Living with one parent Native parent 21 100.0% NativeForeign-born parent 50 100.0% NativeChildren 6 to 17 years - Living with two parents Both parents native 1,027 99.5% Native5 0.5% Foreign-bornBoth parents foreign-born 349 92.5% Native28 7.5% Foreign-bornOne native, one foreign-born parent 197 100.0% NativeChildren 6 to 17 years - Living with one parent Native parent 172 100.0% NativeForeign-born parent 96 53.4% Native83 46.6% Foreign-born
Grandparents responsible for own grandchildren in Kings Park West
Grandparents (30 to 59 years) Asian 4 100.0% Responsible for grandchildren
Grandparents (60 years and over) Asian 2 3.9% Responsible for grandchildren40 96.1% Not responsible for grandchildren