Races in Kaufman, Texas (TX) Detailed Stats
Data:
Races - White alone (%)
Races - White alone (% change since 2000)
Races - Black alone (%)
Races - Black alone (% change since 2000)
Races - American Indian alone (%)
Races - American Indian alone (% change since 2000)
Races - Asian alone (%)
Races - Asian alone (% change since 2000)
Races - Hispanic (%)
Races - Hispanic (% change since 2000)
Races - Native Hawaiian and Other Pacific Islander alone (%)
Races - Native Hawaiian and Other Pacific Islander alone (% change since 2000)
Races - Two or more races(%)
Races - Two or more races(% change since 2000)
Races - Other race alone (%)
Races - Other race alone (% change since 2000)
Racial diversity
Place of birth - Born in state of residence (%)
Place of birth - Born in state of residence (%) - White
Place of birth - Born in state of residence (%) - Black or African American
Place of birth - Born in state of residence (%) - Asian
Place of birth - Born in state of residence (%) - Hispanic or Latino
Place of birth - Born in state of residence (%) - American Indian and Alaska Native
Place of birth - Born in state of residence (%) - Multirace
Place of birth - Born in state of residence (%) - Other Race
Place of birth - Born in other state (%)
Place of birth - Born in other state (%) - White
Place of birth - Born in other state (%) - Black or African American
Place of birth - Born in other state (%) - Asian
Place of birth - Born in other state (%) - Hispanic or Latino
Place of birth - Born in other state (%) - American Indian and Alaska Native
Place of birth - Born in other state (%) - Multirace
Place of birth - Born in other state (%) - Other Race
Place of birth - Native, outside of US (%)
Place of birth - Native, outside of US (%) - White
Place of birth - Native, outside of US (%) - Black or African American
Place of birth - Native, outside of US (%) - Asian
Place of birth - Native, outside of US (%) - Hispanic or Latino
Place of birth - Native, outside of US (%) - American Indian and Alaska Native
Place of birth - Native, outside of US (%) - Multirace
Place of birth - Native, outside of US (%) - Other Race
Place of birth - Foreign born (%)
Place of birth - Foreign born (%) - White
Place of birth - Foreign born (%) - Black or African American
Place of birth - Foreign born (%) - Asian
Place of birth - Foreign born (%) - Hispanic or Latino
Place of birth - Foreign born (%) - American Indian and Alaska Native
Place of birth - Foreign born (%) - Multirace
Place of birth - Foreign born (%) - Other Race
Residents speaking English at home (%)
Residents speaking English at home - Born in the United States (%)
Residents speaking English at home - Native, born elsewhere (%)
Residents speaking English at home - Foreign born (%)
Residents speaking Spanish at home (%)
Residents speaking Spanish at home - Born in the United States (%)
Residents speaking Spanish at home - Native, born elsewhere (%)
Residents speaking Spanish at home - Foreign born (%)
Residents speaking other language at home (%)
Residents speaking other language at home - Born in the United States (%)
Residents speaking other language at home - Native, born elsewhere (%)
Residents speaking other language at home - Foreign born (%)
Marital status - Never married (%)
Marital status - Now married (%)
Marital status - Separated (%)
Marital status - Widowed (%)
Marital status - Divorced (%)
Ancestries Reported - Arab (%)
Ancestries Reported - Czech (%)
Ancestries Reported - Danish (%)
Ancestries Reported - Dutch (%)
Ancestries Reported - English (%)
Ancestries Reported - French (%)
Ancestries Reported - French Canadian (%)
Ancestries Reported - German (%)
Ancestries Reported - Greek (%)
Ancestries Reported - Hungarian (%)
Ancestries Reported - Irish (%)
Ancestries Reported - Italian (%)
Ancestries Reported - Lithuanian (%)
Ancestries Reported - Norwegian (%)
Ancestries Reported - Polish (%)
Ancestries Reported - Portuguese (%)
Ancestries Reported - Russian (%)
Ancestries Reported - Scotch-Irish (%)
Ancestries Reported - Scottish (%)
Ancestries Reported - Slovak (%)
Ancestries Reported - Subsaharan African (%)
Ancestries Reported - Swedish (%)
Ancestries Reported - Swiss (%)
Ancestries Reported - Ukrainian (%)
Ancestries Reported - United States (%)
Ancestries Reported - Welsh (%)
Ancestries Reported - West Indian (%)
Ancestries Reported - Other (%)
Geographical mobility - Same house 1 year ago (%)
Geographical mobility - Same house 1 year ago (%) - White
Geographical mobility - Same house 1 year ago (%) - Black or African American
Geographical mobility - Same house 1 year ago (%) - Asian
Geographical mobility - Same house 1 year ago (%) - Hispanic or Latino
Geographical mobility - Same house 1 year ago (%) - American Indian and Alaska Native
Geographical mobility - Same house 1 year ago (%) - Multirace
Geographical mobility - Same house 1 year ago (%) - Other Race
Geographical mobility - Moved within same county (%)
Geographical mobility - Moved within same county (%) - White
Geographical mobility - Moved within same county (%) - Black or African American
Geographical mobility - Moved within same county (%) - Asian
Geographical mobility - Moved within same county (%) - Hispanic or Latino
Geographical mobility - Moved within same county (%) - American Indian and Alaska Native
Geographical mobility - Moved within same county (%) - Multirace
Geographical mobility - Moved within same county (%) - Other Race
Geographical mobility - Moved from different county within same state (%)
Geographical mobility - Moved from different county within same state (%) - White
Geographical mobility - Moved from different county within same state (%) - Black or African American
Geographical mobility - Moved from different county within same state (%) - Asian
Geographical mobility - Moved from different county within same state (%) - Hispanic or Latino
Geographical mobility - Moved from different county within same state (%) - American Indian and Alaska Native
Geographical mobility - Moved from different county within same state (%) - Multirace
Geographical mobility - Moved from different county within same state (%) - Other Race
Geographical mobility - Moved from different state (%)
Geographical mobility - Moved from different state (%) - White
Geographical mobility - Moved from different state (%) - Black or African American
Geographical mobility - Moved from different state (%) - Asian
Geographical mobility - Moved from different state (%) - Hispanic or Latino
Geographical mobility - Moved from different state (%) - American Indian and Alaska Native
Geographical mobility - Moved from different state (%) - Multirace
Geographical mobility - Moved from different state (%) - Other Race
Geographical mobility - Moved from abroad (%)
Geographical mobility - Moved from abroad (%) - White
Geographical mobility - Moved from abroad (%) - Black or African American
Geographical mobility - Moved from abroad (%) - Asian
Geographical mobility - Moved from abroad (%) - Hispanic or Latino
Geographical mobility - Moved from abroad (%) - American Indian and Alaska Native
Geographical mobility - Moved from abroad (%) - Multirace
Geographical mobility - Moved from abroad (%) - Other Race
Place of birth for the foreign-born population - Ireland (%)
Place of birth for the foreign-born population - Denmark (%)
Place of birth for the foreign-born population - Norway (%)
Place of birth for the foreign-born population - Sweden (%)
Place of birth for the foreign-born population - United Kingdom (%)
Place of birth for the foreign-born population - England (%)
Place of birth for the foreign-born population - Scotland (%)
Place of birth for the foreign-born population - Other Northern Europe (%)
Place of birth for the foreign-born population - Austria (%)
Place of birth for the foreign-born population - Belgium (%)
Place of birth for the foreign-born population - France (%)
Place of birth for the foreign-born population - Germany (%)
Place of birth for the foreign-born population - Netherlands (%)
Place of birth for the foreign-born population - Switzerland (%)
Place of birth for the foreign-born population - Other Western Europe (%)
Place of birth for the foreign-born population - Greece (%)
Place of birth for the foreign-born population - Italy (%)
Place of birth for the foreign-born population - Portugal (%)
Place of birth for the foreign-born population - Spain (%)
Place of birth for the foreign-born population - Other Southern Europe (%)
Place of birth for the foreign-born population - Albania (%)
Place of birth for the foreign-born population - Belarus (%)
Place of birth for the foreign-born population - Bosnia and Herzegovina (%)
Place of birth for the foreign-born population - Bulgaria (%)
Place of birth for the foreign-born population - Croatia (%)
Place of birth for the foreign-born population - Czechoslovakia (%)
Place of birth for the foreign-born population - Hungary (%)
Place of birth for the foreign-born population - Latvia (%)
Place of birth for the foreign-born population - Lithuania (%)
Place of birth for the foreign-born population - North Macedonia (Macedonia) (%)
Place of birth for the foreign-born population - Moldova (%)
Place of birth for the foreign-born population - Poland (%)
Place of birth for the foreign-born population - Romania (%)
Place of birth for the foreign-born population - Russia (%)
Place of birth for the foreign-born population - Serbia (%)
Place of birth for the foreign-born population - Ukraine (%)
Place of birth for the foreign-born population - Other Eastern Europe (%)
Place of birth for the foreign-born population - China (%)
Place of birth for the foreign-born population - Hong Kong (%)
Place of birth for the foreign-born population - Taiwan (%)
Place of birth for the foreign-born population - Japan (%)
Place of birth for the foreign-born population - Korea (%)
Place of birth for the foreign-born population - Other Eastern Asia (%)
Place of birth for the foreign-born population - Afghanistan (%)
Place of birth for the foreign-born population - Bangladesh (%)
Place of birth for the foreign-born population - India (%)
Place of birth for the foreign-born population - Iran (%)
Place of birth for the foreign-born population - Kazakhstan (%)
Place of birth for the foreign-born population - Nepal (%)
Place of birth for the foreign-born population - Pakistan (%)
Place of birth for the foreign-born population - Sri Lanka (%)
Place of birth for the foreign-born population - Uzbekistan (%)
Place of birth for the foreign-born population - Other South Central Asia (%)
Place of birth for the foreign-born population - Burma (%)
Place of birth for the foreign-born population - Cambodia (%)
Place of birth for the foreign-born population - Indonesia (%)
Place of birth for the foreign-born population - Laos (%)
Place of birth for the foreign-born population - Malaysia (%)
Place of birth for the foreign-born population - Philippines (%)
Place of birth for the foreign-born population - Singapore (%)
Place of birth for the foreign-born population - Thailand (%)
Place of birth for the foreign-born population - Vietnam (%)
Place of birth for the foreign-born population - Other South Eastern Asia (%)
Place of birth for the foreign-born population - Armenia (%)
Place of birth for the foreign-born population - Iraq (%)
Place of birth for the foreign-born population - Israel (%)
Place of birth for the foreign-born population - Jordan (%)
Place of birth for the foreign-born population - Kuwait (%)
Place of birth for the foreign-born population - Lebanon (%)
Place of birth for the foreign-born population - Saudi Arabia (%)
Place of birth for the foreign-born population - Syria (%)
Place of birth for the foreign-born population - Turkey (%)
Place of birth for the foreign-born population - Yemen (%)
Place of birth for the foreign-born population - Other Western Asia (%)
Place of birth for the foreign-born population - Eritrea (%)
Place of birth for the foreign-born population - Ethiopia (%)
Place of birth for the foreign-born population - Kenya (%)
Place of birth for the foreign-born population - Somalia (%)
Place of birth for the foreign-born population - Uganda (%)
Place of birth for the foreign-born population - Zimbabwe (%)
Place of birth for the foreign-born population - Other Eastern Africa (%)
Place of birth for the foreign-born population - Cameroon (%)
Place of birth for the foreign-born population - Congo (%)
Place of birth for the foreign-born population - Democratic Republic of Congo (Zaire) (%)
Place of birth for the foreign-born population - Other Middle Africa (%)
Place of birth for the foreign-born population - Egypt (%)
Place of birth for the foreign-born population - Morocco (%)
Place of birth for the foreign-born population - Sudan (%)
Place of birth for the foreign-born population - Other Northern Africa (%)
Place of birth for the foreign-born population - South Africa (%)
Place of birth for the foreign-born population - Other Southern Africa (%)
Place of birth for the foreign-born population - Cabo Verde (%)
Place of birth for the foreign-born population - Ghana (%)
Place of birth for the foreign-born population - Liberia (%)
Place of birth for the foreign-born population - Nigeria (%)
Place of birth for the foreign-born population - Senegal (%)
Place of birth for the foreign-born population - Sierra Leone (%)
Place of birth for the foreign-born population - Other Western Africa (%)
Place of birth for the foreign-born population - Australia (%)
Place of birth for the foreign-born population - New Zealand (%)
Place of birth for the foreign-born population - Fiji (%)
Place of birth for the foreign-born population - Micronesia (%)
Place of birth for the foreign-born population - Bahamas (%)
Place of birth for the foreign-born population - Barbados (%)
Place of birth for the foreign-born population - Cuba (%)
Place of birth for the foreign-born population - Dominica (%)
Place of birth for the foreign-born population - Dominican Republic (%)
Place of birth for the foreign-born population - Grenada (%)
Place of birth for the foreign-born population - Haiti (%)
Place of birth for the foreign-born population - Jamaica (%)
Place of birth for the foreign-born population - St. Vincent and the Grenadines (%)
Place of birth for the foreign-born population - Trinidad and Tobago (%)
Place of birth for the foreign-born population - West Indies (%)
Place of birth for the foreign-born population - Other Caribbean (%)
Place of birth for the foreign-born population - Belize (%)
Place of birth for the foreign-born population - Costa Rica (%)
Place of birth for the foreign-born population - El Salvador (%)
Place of birth for the foreign-born population - Guatemala (%)
Place of birth for the foreign-born population - Honduras (%)
Place of birth for the foreign-born population - Mexico (%)
Place of birth for the foreign-born population - Nicaragua (%)
Place of birth for the foreign-born population - Panama (%)
Place of birth for the foreign-born population - Other Central America (%)
Place of birth for the foreign-born population - Argentina (%)
Place of birth for the foreign-born population - Bolivia (%)
Place of birth for the foreign-born population - Brazil (%)
Place of birth for the foreign-born population - Chile (%)
Place of birth for the foreign-born population - Colombia (%)
Place of birth for the foreign-born population - Ecuador (%)
Place of birth for the foreign-born population - Guyana (%)
Place of birth for the foreign-born population - Peru (%)
Place of birth for the foreign-born population - Uruguay (%)
Place of birth for the foreign-born population - Venezuela (%)
Place of birth for the foreign-born population - Other South America (%)
Place of birth for the foreign-born population - Canada (%)
Place of birth for the foreign-born population - Other Northern America (%)
Place of birth for the foreign-born population - Other (%)
Latest news about races in Kaufman, TX collected exclusively by city-data.com from local newspapers, TV, and radio stations
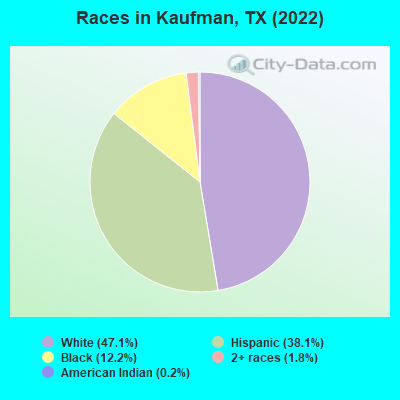
According to 2022 data, the most numerous races in Kaufman, TX are Hispanic (3,301 residents), White alone (4,077 residents), and Black alone (1,058 residents). 68.8% of Kaufman residents speak English at home. 7.9% of Kaufman, TX residents are foreign-born (8.7% born in Latin America), which is 114.5% less than the foreign-born rate of 17.0% across the entire state of Texas.
Race distribution in Kaufman
2000 2022
10,933,313 52.4% White alone 6,669,666 32.0% Hispanic 2,364,255 11.3% Black alone 554,445 2.7% Asian alone 230,567 1.1% Two or more races 68,859 0.3% American Indian alone 19,958 0.10% Other race alone 10,757 0.05% Native Hawaiian and Other
12,070,642 40.2% Hispanic 11,683,430 38.9% White alone 3,508,706 11.7% Black alone 1,608,173 5.4% Asian alone 956,560 3.2% Two or more races 125,763 0.4% Other race alone 47,023 0.2% American Indian alone 29,275 0.10% Native Hawaiian and Other
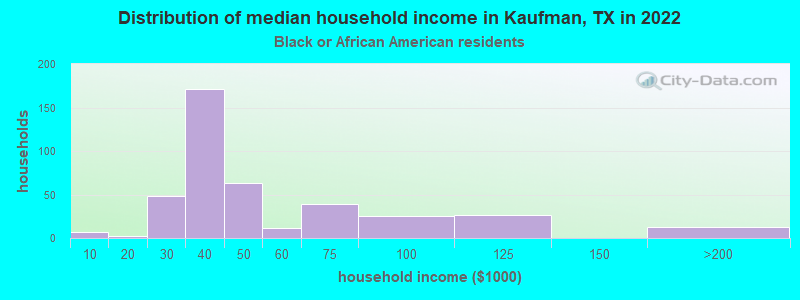
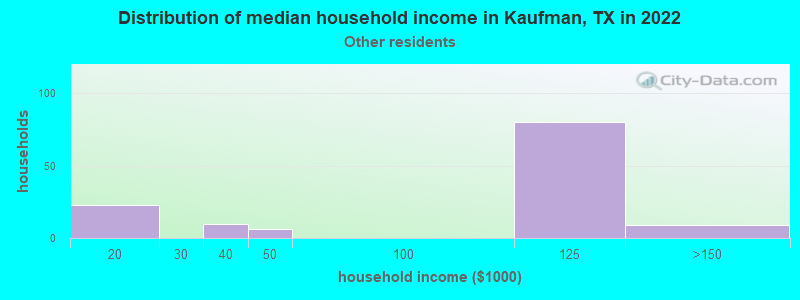
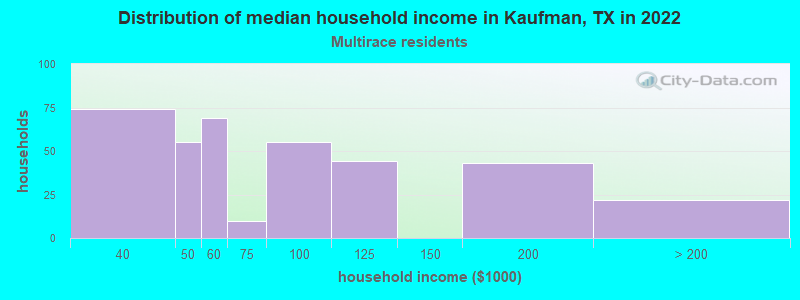
Income and house value in Kaufman Median household income in 2022 $83,840 White non-Hispanic householders$48,970 Black householders$118,640 Some other race householders$61,629 Hispanic or Latino race householdersMedian 2022 house value $207,684 White Non-Hispanic householders$162,853 Black or African American householders $180,542 Asian householders$129,307 Some other race householders$149,435 Two or more races householders$128,087 Hispanic or Latino householders
Median age by race in Kaufman
30.5 Median age for White residents34.0 28.0 42.0 Median age for Black or African American residents42.3 34.8 55.8 Median age for American Indian / Alaska Native residents-682,445,758.7 -684,418,145.3 -712,301,586.6 Median age for Asian residents-694,995,277.9 -468,354,429.9 -581,560,283.1 Median age for Native Hawaiian / Pacific Islander residents-666,666,666.0 -577,777,777.2 39.1 Median age for Other race residents36.7 40.2 23.6 Median age for Two or more races residents25.4 23.9 34.7 Median age for White alone residents36.9 30.9 21.3 Median age for Hispanic or Latino residents21.6 21.7
Owner/renter occupied households by race in Kaufman
House owners and renters - White residents 632 41.7% Owner occupied883 58.3% Renter occupiedHouse owners and renters - Black or African American residents 134 32.5% Owner occupied278 67.5% Renter occupiedHouse owners and renters - Other race residents 124 77.3% Owner occupied36 22.7% Renter occupiedHouse owners and renters - Two or more races residents 84 24.2% Owner occupied262 75.8% Renter occupiedHouse owners and renters - White alone residents 540 39.0% Owner occupied845 61.0% Renter occupiedHouse owners and renters - Hispanic or Latino residents 318 57.1% Owner occupied238 42.9% Renter occupied
Language usage in Kaufman
English speakers - Total 68.8% of residents of Kaufman speak English at home.
31.7% of residents speak Spanish at home 1,917 75.6% Speak English very well618 24.4% Speak English less than very well0.5% of residents speak other language at home 41 100.0% Speak English very well
English speakers - Born in the United States 83.4% of residents of Kaufman speak English at home.
17.7% of residents speak Spanish at home 167 93.8% Speak English very well11 6.2% Speak English less than very well
English speakers - Native, born elsewhere 32.0% of residents of Kaufman speak English at home.
72.0% of residents speak Spanish at home 18 100.0% Speak English very well
English speakers - Foreign-born 2.3% of residents of Kaufman speak English at home.
95.0% of residents speak Spanish at home 504 45.3% Speak English very well608 54.7% Speak English less than very well0.9% of residents speak other language at home 10 100.0% Speak English very well
White (Caucasian) - Speak another language Native:
7.9% (339)Foreign-born:
100.0% (223)
Black or African American - Speak another language Native:
1.2% (12)Foreign-born:
67.0% (11)
Other race - Speak only English Native:
32.0% (148)Foreign-born:
7.4% (17)
Other race - Speak another language Native:
68.0% (315)Foreign-born:
92.7% (210)
Two or more races - Speak another language Native:
55.5% (552)Foreign-born:
100.0% (422)
Hispanic or Latino - Speak only English Native:
31.0% (578)Foreign-born:
1.5% (17)
Hispanic or Latino - Speak another language Native:
70.6% (1,317)Foreign-born:
99.6% (1,119)
Foreign-born residents in Kaufman 686 residents are foreign born (8.7% Latin America ).
This city:
7.9%Texas:
17.1%
Marital status for residents in Kaufman Marital status - White (Caucasian) population 15 years and over
Males 35.5% Never married41.6% Now married2.6% Separated7.6% Widowed12.8% DivorcedFemales 24.0% Never married38.3% Now married3.8% Separated12.0% Widowed21.9% DivorcedWomen who gave birth in the past 12 months Now married:
39.5% (27)Unmarried:
60.5% (41)
Women who did not give birth in the past 12 months Now married:
48.0% (485)Unmarried:
52.0% (525)
Marital status - Black or African American population 15 years and over
Males 62.8% Never married11.0% Now married0.0% Separated3.3% Widowed22.9% DivorcedFemales 41.1% Never married13.2% Now married5.1% Separated22.8% Widowed17.8% DivorcedWomen who did not give birth in the past 12 months Now married:
0.0% (0)Unmarried:
100.0% (113)
Marital status - American Indian / Alaska Native population 15 years and over
Males 0.0% Never married100.0% Now married0.0% Separated0.0% Widowed0.0% DivorcedFemales 0.0% Never married58.3% Now married0.0% Separated41.7% Widowed0.0% DivorcedWomen who did not give birth in the past 12 months Now married:
100.0% (10)Unmarried:
0.0% (0)
Marital status - Other race population 15 years and over
Males 52.5% Never married42.9% Now married0.0% Separated0.5% Widowed4.0% DivorcedFemales 27.0% Never married55.6% Now married0.0% Separated6.2% Widowed11.2% DivorcedWomen who did not give birth in the past 12 months Now married:
50.5% (112)Unmarried:
49.5% (110)
Marital status - Two or more races population 15 years and over
Males 53.6% Never married40.5% Now married4.3% Separated0.0% Widowed1.7% DivorcedFemales 66.4% Never married19.8% Now married3.7% Separated0.0% Widowed10.2% DivorcedWomen who did not give birth in the past 12 months Now married:
22.8% (123)Unmarried:
77.2% (415)
Marital status - White alone, not Hispanic / Latino population 15 years and over
Males 35.3% Never married38.4% Now married3.3% Separated8.9% Widowed14.1% DivorcedFemales 24.7% Never married32.8% Now married4.6% Separated12.9% Widowed25.1% DivorcedWomen who gave birth in the past 12 months Now married:
27.0% (17)Unmarried:
73.0% (47)
Women who did not give birth in the past 12 months Now married:
41.8% (375)Unmarried:
58.2% (522)
Marital status - Hispanic or Latino population 15 years and over
Males 42.3% Never married49.7% Now married1.7% Separated1.2% Widowed5.1% DivorcedFemales 39.9% Never married46.0% Now married1.3% Separated4.1% Widowed8.7% DivorcedWomen who gave birth in the past 12 months Now married:
100.0% (17)Unmarried:
0.0% (0)
Women who did not give birth in the past 12 months Now married:
45.3% (374)Unmarried:
54.7% (451)
Ancestries in Kaufman
456 13.3% English275 8.0% American207 6.0% Irish190 5.5% German48 1.4% European32 0.9% Scotch-Irish30 0.9% French11 0.3% British8 0.2% Kenyan6 0.2% Scottish
Children Nativity (place of birth) in Kaufman
Children under 6 years - Living with two parents Both parents native 201 100.0% NativeBoth parents foreign-born 15 100.0% NativeOne native, one foreign-born parent 80 100.0% NativeChildren under 6 years - Living with one parent Native parent 301 100.0% NativeForeign-born parent 147 100.0% NativeChildren 6 to 17 years - Living with two parents Both parents native 642 100.0% Native0 0.0% Foreign-bornBoth parents foreign-born 136 75.9% Native43 24.1% Foreign-bornOne native, one foreign-born parent 203 100.0% NativeChildren 6 to 17 years - Living with one parent Native parent 858 100.0% NativeForeign-born parent 101 43.2% Native132 56.8% Foreign-born
Place of birth for residents in Kaufman 677 Americas677 Latin America677 Central America8 Africa8 Eastern Africa
Grandparents responsible for own grandchildren in Kaufman
Grandparents (30 to 59 years) White / Caucasian 33 86.1% Responsible for grandchildren5 13.9% Not responsible for grandchildrenBlack or African American 29 100.0% Responsible for grandchildrenTwo or more races 41 100.0% Not responsible for grandchildrenWhite alone, not Hispanic / Latino 17 75.1% Responsible for grandchildren6 24.9% Not responsible for grandchildrenHispanic or Latino 24 100.0% Not responsible for grandchildrenGrandparents (60 years and over) White / Caucasian 33 46.2% Responsible for grandchildren38 53.8% Not responsible for grandchildrenBlack or African American 8 100.0% Not responsible for grandchildrenWhite alone, not Hispanic / Latino 38 45.8% Responsible for grandchildren45 54.2% Not responsible for grandchildrenHispanic or Latino 11 100.0% Not responsible for grandchildren