Races in Jericho, New York (NY) Detailed Stats
Data:
Races - White alone (%)
Races - White alone (% change since 2000)
Races - Black alone (%)
Races - Black alone (% change since 2000)
Races - American Indian alone (%)
Races - American Indian alone (% change since 2000)
Races - Asian alone (%)
Races - Asian alone (% change since 2000)
Races - Hispanic (%)
Races - Hispanic (% change since 2000)
Races - Native Hawaiian and Other Pacific Islander alone (%)
Races - Native Hawaiian and Other Pacific Islander alone (% change since 2000)
Races - Two or more races(%)
Races - Two or more races(% change since 2000)
Races - Other race alone (%)
Races - Other race alone (% change since 2000)
Racial diversity
Place of birth - Born in state of residence (%)
Place of birth - Born in state of residence (%) - White
Place of birth - Born in state of residence (%) - Black or African American
Place of birth - Born in state of residence (%) - Asian
Place of birth - Born in state of residence (%) - Hispanic or Latino
Place of birth - Born in state of residence (%) - American Indian and Alaska Native
Place of birth - Born in state of residence (%) - Multirace
Place of birth - Born in state of residence (%) - Other Race
Place of birth - Born in other state (%)
Place of birth - Born in other state (%) - White
Place of birth - Born in other state (%) - Black or African American
Place of birth - Born in other state (%) - Asian
Place of birth - Born in other state (%) - Hispanic or Latino
Place of birth - Born in other state (%) - American Indian and Alaska Native
Place of birth - Born in other state (%) - Multirace
Place of birth - Born in other state (%) - Other Race
Place of birth - Native, outside of US (%)
Place of birth - Native, outside of US (%) - White
Place of birth - Native, outside of US (%) - Black or African American
Place of birth - Native, outside of US (%) - Asian
Place of birth - Native, outside of US (%) - Hispanic or Latino
Place of birth - Native, outside of US (%) - American Indian and Alaska Native
Place of birth - Native, outside of US (%) - Multirace
Place of birth - Native, outside of US (%) - Other Race
Place of birth - Foreign born (%)
Place of birth - Foreign born (%) - White
Place of birth - Foreign born (%) - Black or African American
Place of birth - Foreign born (%) - Asian
Place of birth - Foreign born (%) - Hispanic or Latino
Place of birth - Foreign born (%) - American Indian and Alaska Native
Place of birth - Foreign born (%) - Multirace
Place of birth - Foreign born (%) - Other Race
Residents speaking English at home (%)
Residents speaking English at home - Born in the United States (%)
Residents speaking English at home - Native, born elsewhere (%)
Residents speaking English at home - Foreign born (%)
Residents speaking Spanish at home (%)
Residents speaking Spanish at home - Born in the United States (%)
Residents speaking Spanish at home - Native, born elsewhere (%)
Residents speaking Spanish at home - Foreign born (%)
Residents speaking other language at home (%)
Residents speaking other language at home - Born in the United States (%)
Residents speaking other language at home - Native, born elsewhere (%)
Residents speaking other language at home - Foreign born (%)
Marital status - Never married (%)
Marital status - Now married (%)
Marital status - Separated (%)
Marital status - Widowed (%)
Marital status - Divorced (%)
Ancestries Reported - Arab (%)
Ancestries Reported - Czech (%)
Ancestries Reported - Danish (%)
Ancestries Reported - Dutch (%)
Ancestries Reported - English (%)
Ancestries Reported - French (%)
Ancestries Reported - French Canadian (%)
Ancestries Reported - German (%)
Ancestries Reported - Greek (%)
Ancestries Reported - Hungarian (%)
Ancestries Reported - Irish (%)
Ancestries Reported - Italian (%)
Ancestries Reported - Lithuanian (%)
Ancestries Reported - Norwegian (%)
Ancestries Reported - Polish (%)
Ancestries Reported - Portuguese (%)
Ancestries Reported - Russian (%)
Ancestries Reported - Scotch-Irish (%)
Ancestries Reported - Scottish (%)
Ancestries Reported - Slovak (%)
Ancestries Reported - Subsaharan African (%)
Ancestries Reported - Swedish (%)
Ancestries Reported - Swiss (%)
Ancestries Reported - Ukrainian (%)
Ancestries Reported - United States (%)
Ancestries Reported - Welsh (%)
Ancestries Reported - West Indian (%)
Ancestries Reported - Other (%)
Geographical mobility - Same house 1 year ago (%)
Geographical mobility - Same house 1 year ago (%) - White
Geographical mobility - Same house 1 year ago (%) - Black or African American
Geographical mobility - Same house 1 year ago (%) - Asian
Geographical mobility - Same house 1 year ago (%) - Hispanic or Latino
Geographical mobility - Same house 1 year ago (%) - American Indian and Alaska Native
Geographical mobility - Same house 1 year ago (%) - Multirace
Geographical mobility - Same house 1 year ago (%) - Other Race
Geographical mobility - Moved within same county (%)
Geographical mobility - Moved within same county (%) - White
Geographical mobility - Moved within same county (%) - Black or African American
Geographical mobility - Moved within same county (%) - Asian
Geographical mobility - Moved within same county (%) - Hispanic or Latino
Geographical mobility - Moved within same county (%) - American Indian and Alaska Native
Geographical mobility - Moved within same county (%) - Multirace
Geographical mobility - Moved within same county (%) - Other Race
Geographical mobility - Moved from different county within same state (%)
Geographical mobility - Moved from different county within same state (%) - White
Geographical mobility - Moved from different county within same state (%) - Black or African American
Geographical mobility - Moved from different county within same state (%) - Asian
Geographical mobility - Moved from different county within same state (%) - Hispanic or Latino
Geographical mobility - Moved from different county within same state (%) - American Indian and Alaska Native
Geographical mobility - Moved from different county within same state (%) - Multirace
Geographical mobility - Moved from different county within same state (%) - Other Race
Geographical mobility - Moved from different state (%)
Geographical mobility - Moved from different state (%) - White
Geographical mobility - Moved from different state (%) - Black or African American
Geographical mobility - Moved from different state (%) - Asian
Geographical mobility - Moved from different state (%) - Hispanic or Latino
Geographical mobility - Moved from different state (%) - American Indian and Alaska Native
Geographical mobility - Moved from different state (%) - Multirace
Geographical mobility - Moved from different state (%) - Other Race
Geographical mobility - Moved from abroad (%)
Geographical mobility - Moved from abroad (%) - White
Geographical mobility - Moved from abroad (%) - Black or African American
Geographical mobility - Moved from abroad (%) - Asian
Geographical mobility - Moved from abroad (%) - Hispanic or Latino
Geographical mobility - Moved from abroad (%) - American Indian and Alaska Native
Geographical mobility - Moved from abroad (%) - Multirace
Geographical mobility - Moved from abroad (%) - Other Race
Place of birth for the foreign-born population - Ireland (%)
Place of birth for the foreign-born population - Denmark (%)
Place of birth for the foreign-born population - Norway (%)
Place of birth for the foreign-born population - Sweden (%)
Place of birth for the foreign-born population - United Kingdom (%)
Place of birth for the foreign-born population - England (%)
Place of birth for the foreign-born population - Scotland (%)
Place of birth for the foreign-born population - Other Northern Europe (%)
Place of birth for the foreign-born population - Austria (%)
Place of birth for the foreign-born population - Belgium (%)
Place of birth for the foreign-born population - France (%)
Place of birth for the foreign-born population - Germany (%)
Place of birth for the foreign-born population - Netherlands (%)
Place of birth for the foreign-born population - Switzerland (%)
Place of birth for the foreign-born population - Other Western Europe (%)
Place of birth for the foreign-born population - Greece (%)
Place of birth for the foreign-born population - Italy (%)
Place of birth for the foreign-born population - Portugal (%)
Place of birth for the foreign-born population - Spain (%)
Place of birth for the foreign-born population - Other Southern Europe (%)
Place of birth for the foreign-born population - Albania (%)
Place of birth for the foreign-born population - Belarus (%)
Place of birth for the foreign-born population - Bosnia and Herzegovina (%)
Place of birth for the foreign-born population - Bulgaria (%)
Place of birth for the foreign-born population - Croatia (%)
Place of birth for the foreign-born population - Czechoslovakia (%)
Place of birth for the foreign-born population - Hungary (%)
Place of birth for the foreign-born population - Latvia (%)
Place of birth for the foreign-born population - Lithuania (%)
Place of birth for the foreign-born population - North Macedonia (Macedonia) (%)
Place of birth for the foreign-born population - Moldova (%)
Place of birth for the foreign-born population - Poland (%)
Place of birth for the foreign-born population - Romania (%)
Place of birth for the foreign-born population - Russia (%)
Place of birth for the foreign-born population - Serbia (%)
Place of birth for the foreign-born population - Ukraine (%)
Place of birth for the foreign-born population - Other Eastern Europe (%)
Place of birth for the foreign-born population - China (%)
Place of birth for the foreign-born population - Hong Kong (%)
Place of birth for the foreign-born population - Taiwan (%)
Place of birth for the foreign-born population - Japan (%)
Place of birth for the foreign-born population - Korea (%)
Place of birth for the foreign-born population - Other Eastern Asia (%)
Place of birth for the foreign-born population - Afghanistan (%)
Place of birth for the foreign-born population - Bangladesh (%)
Place of birth for the foreign-born population - India (%)
Place of birth for the foreign-born population - Iran (%)
Place of birth for the foreign-born population - Kazakhstan (%)
Place of birth for the foreign-born population - Nepal (%)
Place of birth for the foreign-born population - Pakistan (%)
Place of birth for the foreign-born population - Sri Lanka (%)
Place of birth for the foreign-born population - Uzbekistan (%)
Place of birth for the foreign-born population - Other South Central Asia (%)
Place of birth for the foreign-born population - Burma (%)
Place of birth for the foreign-born population - Cambodia (%)
Place of birth for the foreign-born population - Indonesia (%)
Place of birth for the foreign-born population - Laos (%)
Place of birth for the foreign-born population - Malaysia (%)
Place of birth for the foreign-born population - Philippines (%)
Place of birth for the foreign-born population - Singapore (%)
Place of birth for the foreign-born population - Thailand (%)
Place of birth for the foreign-born population - Vietnam (%)
Place of birth for the foreign-born population - Other South Eastern Asia (%)
Place of birth for the foreign-born population - Armenia (%)
Place of birth for the foreign-born population - Iraq (%)
Place of birth for the foreign-born population - Israel (%)
Place of birth for the foreign-born population - Jordan (%)
Place of birth for the foreign-born population - Kuwait (%)
Place of birth for the foreign-born population - Lebanon (%)
Place of birth for the foreign-born population - Saudi Arabia (%)
Place of birth for the foreign-born population - Syria (%)
Place of birth for the foreign-born population - Turkey (%)
Place of birth for the foreign-born population - Yemen (%)
Place of birth for the foreign-born population - Other Western Asia (%)
Place of birth for the foreign-born population - Eritrea (%)
Place of birth for the foreign-born population - Ethiopia (%)
Place of birth for the foreign-born population - Kenya (%)
Place of birth for the foreign-born population - Somalia (%)
Place of birth for the foreign-born population - Uganda (%)
Place of birth for the foreign-born population - Zimbabwe (%)
Place of birth for the foreign-born population - Other Eastern Africa (%)
Place of birth for the foreign-born population - Cameroon (%)
Place of birth for the foreign-born population - Congo (%)
Place of birth for the foreign-born population - Democratic Republic of Congo (Zaire) (%)
Place of birth for the foreign-born population - Other Middle Africa (%)
Place of birth for the foreign-born population - Egypt (%)
Place of birth for the foreign-born population - Morocco (%)
Place of birth for the foreign-born population - Sudan (%)
Place of birth for the foreign-born population - Other Northern Africa (%)
Place of birth for the foreign-born population - South Africa (%)
Place of birth for the foreign-born population - Other Southern Africa (%)
Place of birth for the foreign-born population - Cabo Verde (%)
Place of birth for the foreign-born population - Ghana (%)
Place of birth for the foreign-born population - Liberia (%)
Place of birth for the foreign-born population - Nigeria (%)
Place of birth for the foreign-born population - Senegal (%)
Place of birth for the foreign-born population - Sierra Leone (%)
Place of birth for the foreign-born population - Other Western Africa (%)
Place of birth for the foreign-born population - Australia (%)
Place of birth for the foreign-born population - New Zealand (%)
Place of birth for the foreign-born population - Fiji (%)
Place of birth for the foreign-born population - Micronesia (%)
Place of birth for the foreign-born population - Bahamas (%)
Place of birth for the foreign-born population - Barbados (%)
Place of birth for the foreign-born population - Cuba (%)
Place of birth for the foreign-born population - Dominica (%)
Place of birth for the foreign-born population - Dominican Republic (%)
Place of birth for the foreign-born population - Grenada (%)
Place of birth for the foreign-born population - Haiti (%)
Place of birth for the foreign-born population - Jamaica (%)
Place of birth for the foreign-born population - St. Vincent and the Grenadines (%)
Place of birth for the foreign-born population - Trinidad and Tobago (%)
Place of birth for the foreign-born population - West Indies (%)
Place of birth for the foreign-born population - Other Caribbean (%)
Place of birth for the foreign-born population - Belize (%)
Place of birth for the foreign-born population - Costa Rica (%)
Place of birth for the foreign-born population - El Salvador (%)
Place of birth for the foreign-born population - Guatemala (%)
Place of birth for the foreign-born population - Honduras (%)
Place of birth for the foreign-born population - Mexico (%)
Place of birth for the foreign-born population - Nicaragua (%)
Place of birth for the foreign-born population - Panama (%)
Place of birth for the foreign-born population - Other Central America (%)
Place of birth for the foreign-born population - Argentina (%)
Place of birth for the foreign-born population - Bolivia (%)
Place of birth for the foreign-born population - Brazil (%)
Place of birth for the foreign-born population - Chile (%)
Place of birth for the foreign-born population - Colombia (%)
Place of birth for the foreign-born population - Ecuador (%)
Place of birth for the foreign-born population - Guyana (%)
Place of birth for the foreign-born population - Peru (%)
Place of birth for the foreign-born population - Uruguay (%)
Place of birth for the foreign-born population - Venezuela (%)
Place of birth for the foreign-born population - Other South America (%)
Place of birth for the foreign-born population - Canada (%)
Place of birth for the foreign-born population - Other Northern America (%)
Place of birth for the foreign-born population - Other (%)
Latest news about races in Jericho, NY collected exclusively by city-data.com from local newspapers, TV, and radio stations
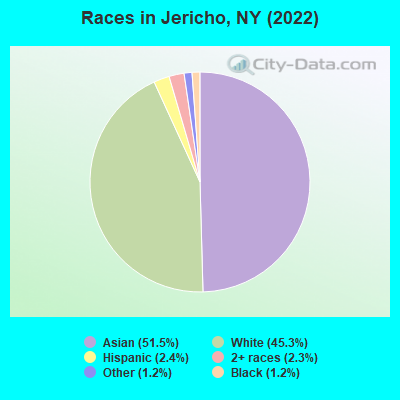
According to 2022 data, the most numerous races in Jericho, NY are White alone (6,439 residents), Hispanic (346 residents), and Black alone (168 residents). 55.8% of Jericho residents speak English at home. 33.8% of Jericho, NY residents are foreign-born (29.5% born in Asia), which is 34.9% greater than the foreign-born rate of 22.0% across the entire state of New York.
Race distribution in Jericho
2000 2022
11,760,981 62.0% White alone 2,867,583 15.1% Hispanic 2,812,623 14.8% Black alone 1,035,926 5.5% Asian alone 366,116 1.9% Two or more races 75,499 0.4% Other race alone 52,499 0.3% American Indian alone 5,230 0.03% Native Hawaiian and Other
10,408,933 52.9% White alone 3,867,299 19.7% Hispanic 2,633,840 13.4% Black alone 1,776,286 9.0% Asian alone 732,670 3.7% Two or more races 216,110 1.1% Other race alone 35,082 0.2% American Indian alone 6,931 0.04% Native Hawaiian and Other
Income and house value in Jericho Median household income in 2022 $165,851 White non-Hispanic householders$166,258 Asian householders$175,746 Two or more races householdersMedian 2022 house value $933,399 White Non-Hispanic householders$658,672 Black or African American householders $835,436 Asian householders$838,310 Some other race householders$728,611 Hispanic or Latino householders
Median age by race in Jericho
56.4 Median age for White residents56.8 56.5 57.3 Median age for Black or African American residents56.3 73.4 -855,158,729.3 Median age for American Indian / Alaska Native residents-607,543,322.5 -837,121,211.3 36.1 Median age for Asian residents38.6 35.3 -487,992,314.6 Median age for Native Hawaiian / Pacific Islander residents-477,502,295.2 -497,387,669.3 12.4 Median age for Other race residents24.7 11.7 27.4 Median age for Two or more races residents16.0 45.1 55.7 Median age for White alone residents55.8 55.8 46.1 Median age for Hispanic or Latino residents46.9 24.4
Owner/renter occupied households by race in Jericho
House owners and renters - White residents 1,961 82.8% Owner occupied409 17.2% Renter occupiedHouse owners and renters - Black or African American residents 34 61.0% Owner occupied22 39.0% Renter occupiedHouse owners and renters - Asian residents 1,594 82.8% Owner occupied331 17.2% Renter occupiedHouse owners and renters - Other race residents 9 100.0% Owner occupiedHouse owners and renters - Two or more races residents 135 100.0% Owner occupiedHouse owners and renters - White alone residents 1,998 82.5% Owner occupied422 17.5% Renter occupiedHouse owners and renters - Hispanic or Latino residents 42 72.2% Owner occupied16 27.8% Renter occupied
Language usage in Jericho
English speakers - Total 55.8% of residents of Jericho speak English at home.
1.1% of residents speak Spanish at home 119 77.8% Speak English very well34 22.2% Speak English less than very well44.7% of residents speak other language at home 4,140 68.0% Speak English very well1,952 32.0% Speak English less than very well
English speakers - Born in the United States 74.6% of residents of Jericho speak English at home.
1.0% of residents speak Spanish at home 6 100.0% Speak English less than very well20.7% of residents speak other language at home 73 57.5% Speak English very well54 42.5% Speak English less than very well
English speakers - Native, born elsewhere 40.7% of residents of Jericho speak English at home.
61.9% of residents speak other language at home 73 100.0% Speak English very well
English speakers - Foreign-born 13.0% of residents of Jericho speak English at home.
0.6% of residents speak Spanish at home 22 73.3% Speak English very well8 26.7% Speak English less than very well92.1% of residents speak other language at home 2,803 61.6% Speak English very well1,745 38.4% Speak English less than very well
White (Caucasian) - Speak only English Native:
96.3% (5,692)Foreign-born:
11.8% (42)
White (Caucasian) - Speak another language Native:
4.4% (258)Foreign-born:
84.4% (303)
Black or African American - Speak only English Native:
99.1% (84)Foreign-born:
60.8% (49)
Asian - Speak only English Native:
33.1% (672)Foreign-born:
11.1% (540)
Asian - Speak another language Native:
65.7% (1,333)Foreign-born:
89.1% (4,342)
Two or more races - Speak only English Native:
79.1% (296)Foreign-born:
4.4% (5)
Two or more races - Speak another language Native:
17.6% (66)Foreign-born:
97.7% (106)
White alone - Speak only English Native:
95.5% (5,657)Foreign-born:
9.8% (45)
White alone - Speak another language Native:
4.6% (273)Foreign-born:
90.8% (414)
Hispanic or Latino - Speak another language Native:
39.3% (117)Foreign-born:
100.0% (18)
Foreign-born residents in Jericho 4,804 residents are foreign born (29.5% Asia ).
This city:
33.8%New York:
22.6%
Marital status for residents in Jericho Marital status - White (Caucasian) population 15 years and over
Males 32.6% Never married62.4% Now married0.0% Separated3.4% Widowed1.6% DivorcedFemales 29.6% Never married55.7% Now married0.4% Separated8.8% Widowed5.4% DivorcedWomen who gave birth in the past 12 months Now married:
100.0% (8)Unmarried:
0.0% (0)
Women who did not give birth in the past 12 months Now married:
27.0% (275)Unmarried:
73.0% (745)
Marital status - Black or African American population 15 years and over
Males 62.1% Never married11.7% Now married0.0% Separated6.8% Widowed19.4% DivorcedFemales 20.3% Never married35.9% Now married40.6% Separated0.0% Widowed3.1% DivorcedWomen who did not give birth in the past 12 months Now married:
80.0% (11)Unmarried:
20.0% (3)
Marital status - Asian population 15 years and over
Males 19.0% Never married78.3% Now married0.0% Separated0.1% Widowed2.6% DivorcedFemales 20.9% Never married71.2% Now married1.0% Separated5.0% Widowed1.9% DivorcedWomen who gave birth in the past 12 months Now married:
100.0% (59)Unmarried:
0.0% (0)
Women who did not give birth in the past 12 months Now married:
66.6% (1,332)Unmarried:
33.4% (667)
Marital status - Other race population 15 years and over
Males 100.0% Never married0.0% Now married0.0% Separated0.0% Widowed0.0% DivorcedFemales 81.1% Never married0.0% Now married18.9% Separated0.0% Widowed0.0% DivorcedWomen who did not give birth in the past 12 months Now married:
33.3% (8)Unmarried:
66.7% (16)
Marital status - Two or more races population 15 years and over
Males 48.5% Never married22.3% Now married0.0% Separated13.1% Widowed16.2% DivorcedFemales 7.2% Never married81.3% Now married0.0% Separated3.6% Widowed7.9% DivorcedWomen who gave birth in the past 12 months Now married:
100.0% (27)Unmarried:
0.0% (0)
Women who did not give birth in the past 12 months Now married:
91.5% (98)Unmarried:
8.5% (9)
Marital status - White alone, not Hispanic / Latino population 15 years and over
Males 31.8% Never married64.5% Now married0.0% Separated2.1% Widowed1.7% DivorcedFemales 29.6% Never married55.6% Now married0.4% Separated8.9% Widowed5.5% DivorcedWomen who gave birth in the past 12 months Now married:
100.0% (9)Unmarried:
0.0% (0)
Women who did not give birth in the past 12 months Now married:
26.2% (280)Unmarried:
73.8% (789)
Marital status - Hispanic or Latino population 15 years and over
Males 59.7% Never married0.0% Now married0.0% Separated31.6% Widowed8.7% DivorcedFemales 48.2% Never married38.6% Now married0.0% Separated0.0% Widowed13.3% DivorcedWomen who did not give birth in the past 12 months Now married:
48.9% (23)Unmarried:
51.1% (24)
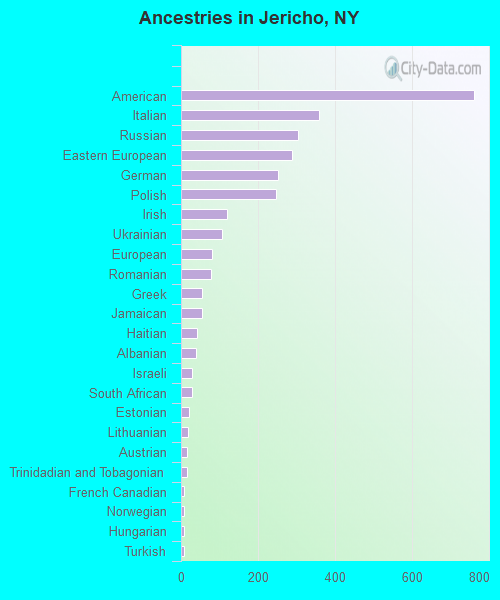
Ancestries in Jericho
763 8.8% American359 4.1% Italian305 3.5% Russian290 3.3% Eastern European252 2.9% German247 2.8% Polish119 1.4% Irish107 1.2% Ukrainian80 0.9% European77 0.9% Romanian55 0.6% Greek54 0.6% Jamaican41 0.5% Haitian38 0.4% Albanian29 0.3% Israeli28 0.3% South African21 0.2% Estonian17 0.2% Lithuanian15 0.2% Austrian15 0.2% Trinidadian and Tobagonian9 0.1% French Canadian9 0.1% Norwegian8 0.09% Hungarian8 0.09% Turkish4 0.05% Yugoslavian
Children Nativity (place of birth) in Jericho
Children under 6 years - Living with two parents Both parents native 85 100.0% NativeBoth parents foreign-born 432 93.2% Native32 6.8% Foreign-bornOne native, one foreign-born parent 32 100.0% NativeChildren under 6 years - Living with one parent Native parent 114 100.0% NativeForeign-born parent 48 100.0% NativeChildren 6 to 17 years - Living with two parents Both parents native 504 100.0% NativeBoth parents foreign-born 1,360 81.3% Native313 18.7% Foreign-bornOne native, one foreign-born parent 168 100.0% NativeChildren 6 to 17 years - Living with one parent Native parent 77 100.0% NativeForeign-born parent 180 49.2% Native186 50.8% Foreign-born
Grandparents responsible for own grandchildren in Jericho
Grandparents (30 to 59 years) White / Caucasian 6 100.0% Not responsible for grandchildrenAsian 13 45.1% Responsible for grandchildren16 54.9% Not responsible for grandchildrenWhite alone, not Hispanic / Latino 4 100.0% Not responsible for grandchildrenGrandparents (60 years and over) White / Caucasian 21 100.0% Not responsible for grandchildrenAsian 24 8.1% Responsible for grandchildren271 91.9% Not responsible for grandchildrenWhite alone, not Hispanic / Latino 22 100.0% Not responsible for grandchildren