Races in Jacksonville, Florida (FL) Detailed Stats
Data:
Races - White alone (%)
Races - White alone (% change since 2000)
Races - Black alone (%)
Races - Black alone (% change since 2000)
Races - American Indian alone (%)
Races - American Indian alone (% change since 2000)
Races - Asian alone (%)
Races - Asian alone (% change since 2000)
Races - Hispanic (%)
Races - Hispanic (% change since 2000)
Races - Native Hawaiian and Other Pacific Islander alone (%)
Races - Native Hawaiian and Other Pacific Islander alone (% change since 2000)
Races - Two or more races(%)
Races - Two or more races(% change since 2000)
Races - Other race alone (%)
Races - Other race alone (% change since 2000)
Racial diversity
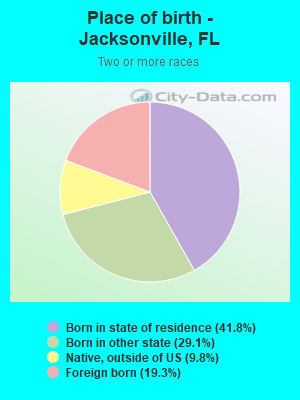
Place of birth - Born in state of residence (%)
Place of birth - Born in state of residence (%) - White
Place of birth - Born in state of residence (%) - Black or African American
Place of birth - Born in state of residence (%) - Asian
Place of birth - Born in state of residence (%) - Hispanic or Latino
Place of birth - Born in state of residence (%) - American Indian and Alaska Native
Place of birth - Born in state of residence (%) - Multirace
Place of birth - Born in state of residence (%) - Other Race
Place of birth - Born in other state (%)
Place of birth - Born in other state (%) - White
Place of birth - Born in other state (%) - Black or African American
Place of birth - Born in other state (%) - Asian
Place of birth - Born in other state (%) - Hispanic or Latino
Place of birth - Born in other state (%) - American Indian and Alaska Native
Place of birth - Born in other state (%) - Multirace
Place of birth - Born in other state (%) - Other Race
Place of birth - Native, outside of US (%)
Place of birth - Native, outside of US (%) - White
Place of birth - Native, outside of US (%) - Black or African American
Place of birth - Native, outside of US (%) - Asian
Place of birth - Native, outside of US (%) - Hispanic or Latino
Place of birth - Native, outside of US (%) - American Indian and Alaska Native
Place of birth - Native, outside of US (%) - Multirace
Place of birth - Native, outside of US (%) - Other Race
Place of birth - Foreign born (%)
Place of birth - Foreign born (%) - White
Place of birth - Foreign born (%) - Black or African American
Place of birth - Foreign born (%) - Asian
Place of birth - Foreign born (%) - Hispanic or Latino
Place of birth - Foreign born (%) - American Indian and Alaska Native
Place of birth - Foreign born (%) - Multirace
Place of birth - Foreign born (%) - Other Race
Residents speaking English at home (%)
Residents speaking English at home - Born in the United States (%)
Residents speaking English at home - Native, born elsewhere (%)
Residents speaking English at home - Foreign born (%)
Residents speaking Spanish at home (%)
Residents speaking Spanish at home - Born in the United States (%)
Residents speaking Spanish at home - Native, born elsewhere (%)
Residents speaking Spanish at home - Foreign born (%)
Residents speaking other language at home (%)
Residents speaking other language at home - Born in the United States (%)
Residents speaking other language at home - Native, born elsewhere (%)
Residents speaking other language at home - Foreign born (%)
Marital status - Never married (%)
Marital status - Now married (%)
Marital status - Separated (%)
Marital status - Widowed (%)
Marital status - Divorced (%)
Ancestries Reported - Arab (%)
Ancestries Reported - Czech (%)
Ancestries Reported - Danish (%)
Ancestries Reported - Dutch (%)
Ancestries Reported - English (%)
Ancestries Reported - French (%)
Ancestries Reported - French Canadian (%)
Ancestries Reported - German (%)
Ancestries Reported - Greek (%)
Ancestries Reported - Hungarian (%)
Ancestries Reported - Irish (%)
Ancestries Reported - Italian (%)
Ancestries Reported - Lithuanian (%)
Ancestries Reported - Norwegian (%)
Ancestries Reported - Polish (%)
Ancestries Reported - Portuguese (%)
Ancestries Reported - Russian (%)
Ancestries Reported - Scotch-Irish (%)
Ancestries Reported - Scottish (%)
Ancestries Reported - Slovak (%)
Ancestries Reported - Subsaharan African (%)
Ancestries Reported - Swedish (%)
Ancestries Reported - Swiss (%)
Ancestries Reported - Ukrainian (%)
Ancestries Reported - United States (%)
Ancestries Reported - Welsh (%)
Ancestries Reported - West Indian (%)
Ancestries Reported - Other (%)
Geographical mobility - Same house 1 year ago (%)
Geographical mobility - Same house 1 year ago (%) - White
Geographical mobility - Same house 1 year ago (%) - Black or African American
Geographical mobility - Same house 1 year ago (%) - Asian
Geographical mobility - Same house 1 year ago (%) - Hispanic or Latino
Geographical mobility - Same house 1 year ago (%) - American Indian and Alaska Native
Geographical mobility - Same house 1 year ago (%) - Multirace
Geographical mobility - Same house 1 year ago (%) - Other Race
Geographical mobility - Moved within same county (%)
Geographical mobility - Moved within same county (%) - White
Geographical mobility - Moved within same county (%) - Black or African American
Geographical mobility - Moved within same county (%) - Asian
Geographical mobility - Moved within same county (%) - Hispanic or Latino
Geographical mobility - Moved within same county (%) - American Indian and Alaska Native
Geographical mobility - Moved within same county (%) - Multirace
Geographical mobility - Moved within same county (%) - Other Race
Geographical mobility - Moved from different county within same state (%)
Geographical mobility - Moved from different county within same state (%) - White
Geographical mobility - Moved from different county within same state (%) - Black or African American
Geographical mobility - Moved from different county within same state (%) - Asian
Geographical mobility - Moved from different county within same state (%) - Hispanic or Latino
Geographical mobility - Moved from different county within same state (%) - American Indian and Alaska Native
Geographical mobility - Moved from different county within same state (%) - Multirace
Geographical mobility - Moved from different county within same state (%) - Other Race
Geographical mobility - Moved from different state (%)
Geographical mobility - Moved from different state (%) - White
Geographical mobility - Moved from different state (%) - Black or African American
Geographical mobility - Moved from different state (%) - Asian
Geographical mobility - Moved from different state (%) - Hispanic or Latino
Geographical mobility - Moved from different state (%) - American Indian and Alaska Native
Geographical mobility - Moved from different state (%) - Multirace
Geographical mobility - Moved from different state (%) - Other Race
Geographical mobility - Moved from abroad (%)
Geographical mobility - Moved from abroad (%) - White
Geographical mobility - Moved from abroad (%) - Black or African American
Geographical mobility - Moved from abroad (%) - Asian
Geographical mobility - Moved from abroad (%) - Hispanic or Latino
Geographical mobility - Moved from abroad (%) - American Indian and Alaska Native
Geographical mobility - Moved from abroad (%) - Multirace
Geographical mobility - Moved from abroad (%) - Other Race
Place of birth for the foreign-born population - Ireland (%)
Place of birth for the foreign-born population - Denmark (%)
Place of birth for the foreign-born population - Norway (%)
Place of birth for the foreign-born population - Sweden (%)
Place of birth for the foreign-born population - United Kingdom (%)
Place of birth for the foreign-born population - England (%)
Place of birth for the foreign-born population - Scotland (%)
Place of birth for the foreign-born population - Other Northern Europe (%)
Place of birth for the foreign-born population - Austria (%)
Place of birth for the foreign-born population - Belgium (%)
Place of birth for the foreign-born population - France (%)
Place of birth for the foreign-born population - Germany (%)
Place of birth for the foreign-born population - Netherlands (%)
Place of birth for the foreign-born population - Switzerland (%)
Place of birth for the foreign-born population - Other Western Europe (%)
Place of birth for the foreign-born population - Greece (%)
Place of birth for the foreign-born population - Italy (%)
Place of birth for the foreign-born population - Portugal (%)
Place of birth for the foreign-born population - Spain (%)
Place of birth for the foreign-born population - Other Southern Europe (%)
Place of birth for the foreign-born population - Albania (%)
Place of birth for the foreign-born population - Belarus (%)
Place of birth for the foreign-born population - Bosnia and Herzegovina (%)
Place of birth for the foreign-born population - Bulgaria (%)
Place of birth for the foreign-born population - Croatia (%)
Place of birth for the foreign-born population - Czechoslovakia (%)
Place of birth for the foreign-born population - Hungary (%)
Place of birth for the foreign-born population - Latvia (%)
Place of birth for the foreign-born population - Lithuania (%)
Place of birth for the foreign-born population - North Macedonia (Macedonia) (%)
Place of birth for the foreign-born population - Moldova (%)
Place of birth for the foreign-born population - Poland (%)
Place of birth for the foreign-born population - Romania (%)
Place of birth for the foreign-born population - Russia (%)
Place of birth for the foreign-born population - Serbia (%)
Place of birth for the foreign-born population - Ukraine (%)
Place of birth for the foreign-born population - Other Eastern Europe (%)
Place of birth for the foreign-born population - China (%)
Place of birth for the foreign-born population - Hong Kong (%)
Place of birth for the foreign-born population - Taiwan (%)
Place of birth for the foreign-born population - Japan (%)
Place of birth for the foreign-born population - Korea (%)
Place of birth for the foreign-born population - Other Eastern Asia (%)
Place of birth for the foreign-born population - Afghanistan (%)
Place of birth for the foreign-born population - Bangladesh (%)
Place of birth for the foreign-born population - India (%)
Place of birth for the foreign-born population - Iran (%)
Place of birth for the foreign-born population - Kazakhstan (%)
Place of birth for the foreign-born population - Nepal (%)
Place of birth for the foreign-born population - Pakistan (%)
Place of birth for the foreign-born population - Sri Lanka (%)
Place of birth for the foreign-born population - Uzbekistan (%)
Place of birth for the foreign-born population - Other South Central Asia (%)
Place of birth for the foreign-born population - Burma (%)
Place of birth for the foreign-born population - Cambodia (%)
Place of birth for the foreign-born population - Indonesia (%)
Place of birth for the foreign-born population - Laos (%)
Place of birth for the foreign-born population - Malaysia (%)
Place of birth for the foreign-born population - Philippines (%)
Place of birth for the foreign-born population - Singapore (%)
Place of birth for the foreign-born population - Thailand (%)
Place of birth for the foreign-born population - Vietnam (%)
Place of birth for the foreign-born population - Other South Eastern Asia (%)
Place of birth for the foreign-born population - Armenia (%)
Place of birth for the foreign-born population - Iraq (%)
Place of birth for the foreign-born population - Israel (%)
Place of birth for the foreign-born population - Jordan (%)
Place of birth for the foreign-born population - Kuwait (%)
Place of birth for the foreign-born population - Lebanon (%)
Place of birth for the foreign-born population - Saudi Arabia (%)
Place of birth for the foreign-born population - Syria (%)
Place of birth for the foreign-born population - Turkey (%)
Place of birth for the foreign-born population - Yemen (%)
Place of birth for the foreign-born population - Other Western Asia (%)
Place of birth for the foreign-born population - Eritrea (%)
Place of birth for the foreign-born population - Ethiopia (%)
Place of birth for the foreign-born population - Kenya (%)
Place of birth for the foreign-born population - Somalia (%)
Place of birth for the foreign-born population - Uganda (%)
Place of birth for the foreign-born population - Zimbabwe (%)
Place of birth for the foreign-born population - Other Eastern Africa (%)
Place of birth for the foreign-born population - Cameroon (%)
Place of birth for the foreign-born population - Congo (%)
Place of birth for the foreign-born population - Democratic Republic of Congo (Zaire) (%)
Place of birth for the foreign-born population - Other Middle Africa (%)
Place of birth for the foreign-born population - Egypt (%)
Place of birth for the foreign-born population - Morocco (%)
Place of birth for the foreign-born population - Sudan (%)
Place of birth for the foreign-born population - Other Northern Africa (%)
Place of birth for the foreign-born population - South Africa (%)
Place of birth for the foreign-born population - Other Southern Africa (%)
Place of birth for the foreign-born population - Cabo Verde (%)
Place of birth for the foreign-born population - Ghana (%)
Place of birth for the foreign-born population - Liberia (%)
Place of birth for the foreign-born population - Nigeria (%)
Place of birth for the foreign-born population - Senegal (%)
Place of birth for the foreign-born population - Sierra Leone (%)
Place of birth for the foreign-born population - Other Western Africa (%)
Place of birth for the foreign-born population - Australia (%)
Place of birth for the foreign-born population - New Zealand (%)
Place of birth for the foreign-born population - Fiji (%)
Place of birth for the foreign-born population - Micronesia (%)
Place of birth for the foreign-born population - Bahamas (%)
Place of birth for the foreign-born population - Barbados (%)
Place of birth for the foreign-born population - Cuba (%)
Place of birth for the foreign-born population - Dominica (%)
Place of birth for the foreign-born population - Dominican Republic (%)
Place of birth for the foreign-born population - Grenada (%)
Place of birth for the foreign-born population - Haiti (%)
Place of birth for the foreign-born population - Jamaica (%)
Place of birth for the foreign-born population - St. Vincent and the Grenadines (%)
Place of birth for the foreign-born population - Trinidad and Tobago (%)
Place of birth for the foreign-born population - West Indies (%)
Place of birth for the foreign-born population - Other Caribbean (%)
Place of birth for the foreign-born population - Belize (%)
Place of birth for the foreign-born population - Costa Rica (%)
Place of birth for the foreign-born population - El Salvador (%)
Place of birth for the foreign-born population - Guatemala (%)
Place of birth for the foreign-born population - Honduras (%)
Place of birth for the foreign-born population - Mexico (%)
Place of birth for the foreign-born population - Nicaragua (%)
Place of birth for the foreign-born population - Panama (%)
Place of birth for the foreign-born population - Other Central America (%)
Place of birth for the foreign-born population - Argentina (%)
Place of birth for the foreign-born population - Bolivia (%)
Place of birth for the foreign-born population - Brazil (%)
Place of birth for the foreign-born population - Chile (%)
Place of birth for the foreign-born population - Colombia (%)
Place of birth for the foreign-born population - Ecuador (%)
Place of birth for the foreign-born population - Guyana (%)
Place of birth for the foreign-born population - Peru (%)
Place of birth for the foreign-born population - Uruguay (%)
Place of birth for the foreign-born population - Venezuela (%)
Place of birth for the foreign-born population - Other South America (%)
Place of birth for the foreign-born population - Canada (%)
Place of birth for the foreign-born population - Other Northern America (%)
Place of birth for the foreign-born population - Other (%)
Latest news about races in Jacksonville, FL collected exclusively by city-data.com from local newspapers, TV, and radio stations
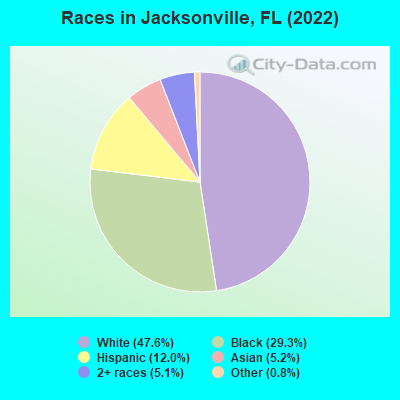
According to 2022 data, the most numerous races in Jacksonville, FL are White alone (462,406 residents), Hispanic (116,218 residents), and Black alone (284,127 residents). 82.5% of Jacksonville residents speak English at home. 12.4% of Jacksonville, FL residents are foreign-born (5.3% born in Latin America, 4.2% born in Asia, 1.8% born in Europe), which is 69.0% less than the foreign-born rate of 21.0% across the entire state of Florida.
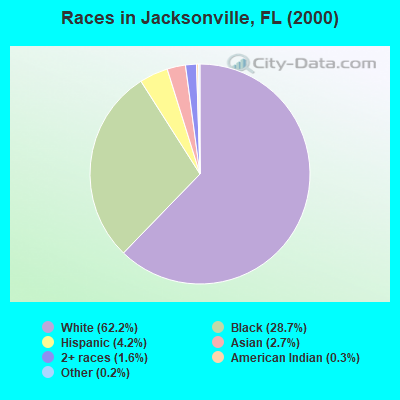
Race distribution in Jacksonville
2000 2022
457,478 62.2% White alone 211,252 28.7% Black alone 30,594 4.2% Hispanic 20,165 2.7% Asian alone 12,092 1.6% Two or more races 2,264 0.3% American Indian alone 1,358 0.2% Other race alone 414 0.06% Native Hawaiian and Other
462,406 47.6% White alone 284,127 29.3% Black alone 116,218 12.0% Hispanic 50,086 5.2% Asian alone 49,150 5.1% Two or more races 8,252 0.8% Other race alone 729 0.08% American Indian alone 347 0.04% Native Hawaiian and Other
2000 2022
10,458,509 65.4% White alone 2,682,715 16.8% Hispanic 2,264,268 14.2% Black alone 261,693 1.6% Asian alone 236,954 1.5% Two or more races 42,358 0.3% American Indian alone 28,994 0.2% Other race alone 6,887 0.04% Native Hawaiian and Other
11,309,403 50.8% White alone 6,025,039 27.1% Hispanic 3,241,015 14.6% Black alone 861,630 3.9% Two or more races 623,692 2.8% Asian alone 152,054 0.7% Other race alone 22,504 0.1% American Indian alone 9,486 0.04% Native Hawaiian and Other
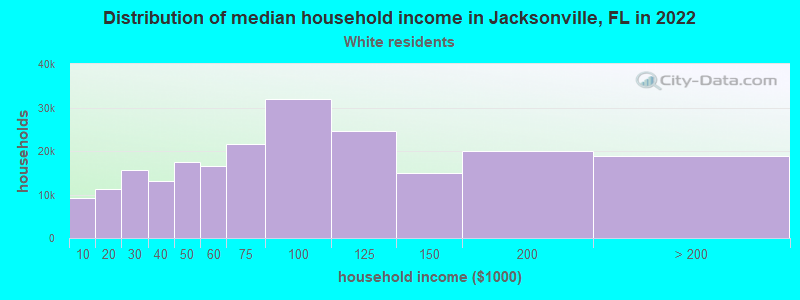
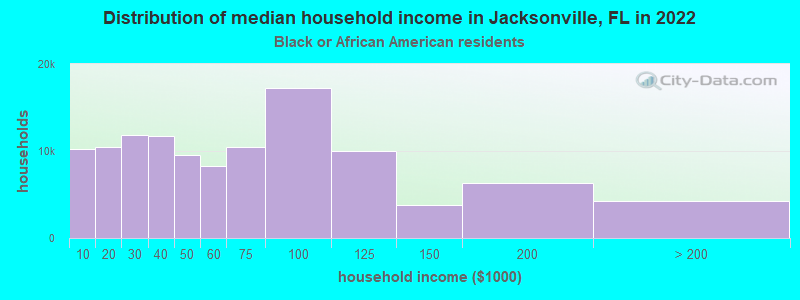
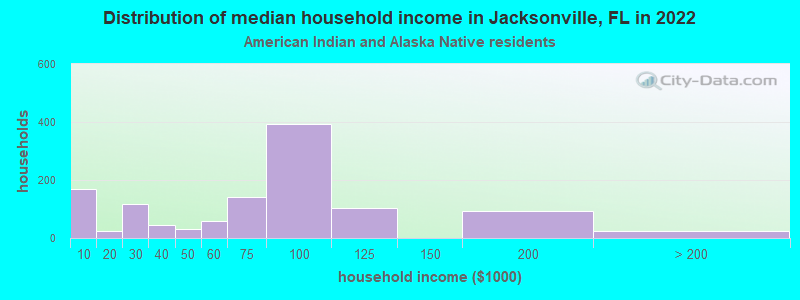
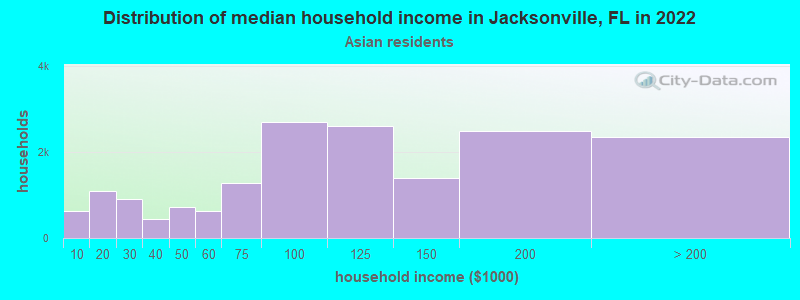
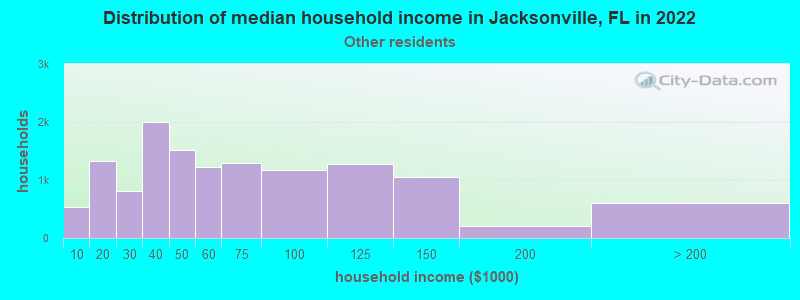
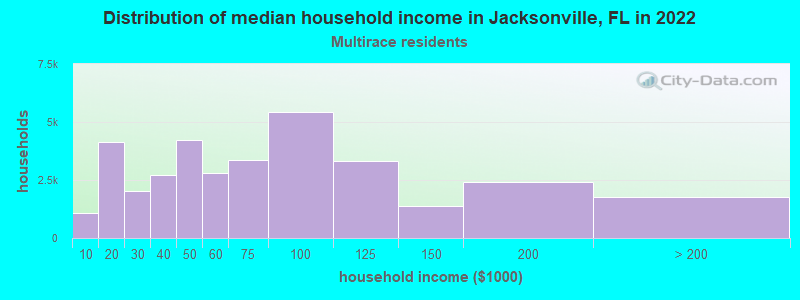
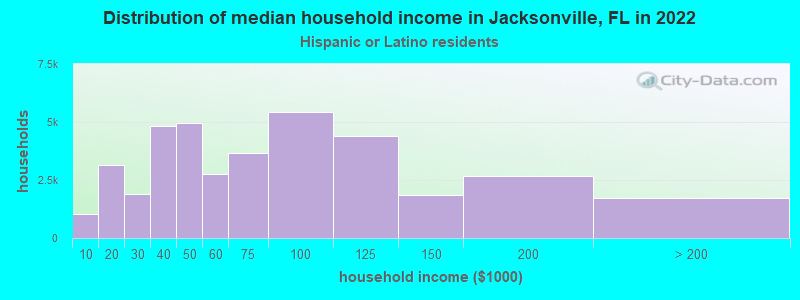
Income and house value in Jacksonville Median household income in 2022 $77,003 White non-Hispanic householders$53,287 Black householders$91,682 American Indian and Alaska Native householders$100,810 Asian householders$52,140 Some other race householders$62,794 Two or more races householders$62,042 Hispanic or Latino race householdersMedian 2022 house value $337,864 White Non-Hispanic householders$231,565 Black or African American householders$324,979 American Indian or Alaska Native householders $376,160 Asian householders$244,450 Native Hawaiian and other Pacific Islander householders$328,916 Some other race householders$295,989 Two or more races householders$335,717 Hispanic or Latino householders
Median age by race in Jacksonville
40.8 Median age for White residents39.9 42.0 33.9 Median age for Black or African American residents32.4 35.7 29.9 Median age for American Indian / Alaska Native residents35.9 28.8 37.0 Median age for Asian residents35.7 39.4 46.5 Median age for Native Hawaiian / Pacific Islander residents46.5 -666,666,666.0 32.4 Median age for Other race residents32.3 32.4 27.6 Median age for Two or more races residents26.0 31.2 41.8 Median age for White alone residents40.5 43.7 31.4 Median age for Hispanic or Latino residents31.3 31.6
Owner/renter occupied households by race in Jacksonville
House owners and renters - White residents 141,681 65.8% Owner occupied73,481 34.2% Renter occupiedHouse owners and renters - Black or African American residents 51,424 45.0% Owner occupied62,839 55.0% Renter occupiedHouse owners and renters - American Indian / Alaska Native residents 338 47.3% Owner occupied377 52.7% Renter occupiedHouse owners and renters - Asian residents 10,957 63.5% Owner occupied6,293 36.5% Renter occupiedHouse owners and renters - Native Hawaiian / Pacific Islander residents 163 84.5% Owner occupied30 15.5% Renter occupiedHouse owners and renters - Other race residents 6,009 46.1% Owner occupied7,019 53.9% Renter occupiedHouse owners and renters - Two or more races residents 16,490 47.6% Owner occupied18,158 52.4% Renter occupiedHouse owners and renters - White alone residents 137,691 66.5% Owner occupied69,405 33.5% Renter occupiedHouse owners and renters - Hispanic or Latino residents 17,975 46.8% Owner occupied20,457 53.2% Renter occupied
Language usage in Jacksonville
English speakers - Total 82.5% of residents of Jacksonville speak English at home.
8.2% of residents speak Spanish at home 42,621 57.0% Speak English very well32,093 43.0% Speak English less than very well9.3% of residents speak other language at home 55,338 65.4% Speak English very well29,229 34.6% Speak English less than very well
English speakers - Born in the United States 94.2% of residents of Jacksonville speak English at home.
3.4% of residents speak Spanish at home 10,350 86.5% Speak English very well1,617 13.5% Speak English less than very well2.4% of residents speak other language at home 7,175 85.8% Speak English very well1,186 14.2% Speak English less than very well
English speakers - Native, born elsewhere 47.0% of residents of Jacksonville speak English at home.
45.3% of residents speak Spanish at home 6,369 48.8% Speak English very well6,691 51.2% Speak English less than very well7.7% of residents speak other language at home 2,088 94.1% Speak English very well131 5.9% Speak English less than very well
English speakers - Foreign-born 19.3% of residents of Jacksonville speak English at home.
29.6% of residents speak Spanish at home 14,580 40.7% Speak English very well21,236 59.3% Speak English less than very well51.1% of residents speak other language at home 34,504 55.8% Speak English very well27,331 44.2% Speak English less than very well
White (Caucasian) - Speak only English Native:
96.3% (418,565)Foreign-born:
23.3% (6,813)
White (Caucasian) - Speak another language Native:
3.7% (16,237)Foreign-born:
76.7% (22,429)
Black or African American - Speak only English Native:
96.2% (237,725)Foreign-born:
34.3% (7,423)
Black or African American - Speak another language Native:
3.8% (9,367)Foreign-born:
65.7% (14,248)
American Indian / Alaska Native - Speak only English Native:
62.6% (1,330)Foreign-born:
14.2% (45)
American Indian / Alaska Native - Speak another language Native:
27.5% (585)Foreign-born:
80.4% (253)
Asian - Speak only English Native:
65.3% (8,920)Foreign-born:
17.4% (5,883)
Asian - Speak another language Native:
34.7% (4,733)Foreign-born:
82.6% (27,932)
Native Hawaiian / Pacific Islander - Speak another language Native:
15.9% (85)Foreign-born:
100.0% (97)
Other race - Speak only English Native:
40.0% (8,966)Foreign-born:
12.2% (1,893)
Other race - Speak another language Native:
60.0% (13,460)Foreign-born:
87.8% (13,576)
Two or more races - Speak only English Native:
74.9% (52,086)Foreign-born:
6.8% (1,368)
Two or more races - Speak another language Native:
25.1% (17,420)Foreign-born:
93.2% (18,898)
White alone - Speak only English Native:
97.3% (406,127)Foreign-born:
29.4% (6,702)
White alone - Speak another language Native:
2.7% (11,230)Foreign-born:
70.6% (16,068)
Hispanic or Latino - Speak only English Native:
50.6% (34,941)Foreign-born:
6.0% (2,235)
Hispanic or Latino - Speak another language Native:
49.4% (34,136)Foreign-born:
94.0% (34,980)
Foreign-born residents in Jacksonville 120,517 residents are foreign born (5.3% Latin America , 4.2% Asia , 1.8% Europe ).
This city:
12.4%Florida:
21.1%
Marital status for residents in Jacksonville Marital status - White (Caucasian) population 15 years and over
Males 33.9% Never married52.0% Now married1.4% Separated2.7% Widowed10.0% DivorcedFemales 26.5% Never married47.2% Now married2.0% Separated8.3% Widowed16.0% DivorcedWomen who gave birth in the past 12 months Now married:
77.1% (5,145)Unmarried:
22.9% (1,531)
Women who did not give birth in the past 12 months Now married:
42.8% (44,409)Unmarried:
57.2% (59,384)
Marital status - Black or African American population 15 years and over
Males 46.0% Never married37.3% Now married3.0% Separated2.3% Widowed11.4% DivorcedFemales 43.7% Never married32.0% Now married3.8% Separated6.6% Widowed13.9% DivorcedWomen who gave birth in the past 12 months Now married:
68.6% (2,168)Unmarried:
31.4% (994)
Women who did not give birth in the past 12 months Now married:
29.8% (21,880)Unmarried:
70.2% (51,656)
Marital status - American Indian / Alaska Native population 15 years and over
Males 30.9% Never married46.8% Now married2.9% Separated3.3% Widowed16.1% DivorcedFemales 34.5% Never married43.0% Now married3.6% Separated5.3% Widowed13.6% DivorcedWomen who did not give birth in the past 12 months Now married:
21.6% (144)Unmarried:
78.4% (522)
Marital status - Asian population 15 years and over
Males 27.7% Never married65.2% Now married1.5% Separated2.3% Widowed3.3% DivorcedFemales 24.6% Never married64.8% Now married0.3% Separated4.3% Widowed6.1% DivorcedWomen who gave birth in the past 12 months Now married:
100.0% (934)Unmarried:
0.0% (0)
Women who did not give birth in the past 12 months Now married:
60.0% (7,442)Unmarried:
40.0% (4,963)
Marital status - Native Hawaiian / Pacific Islander population 15 years and over
Males 44.0% Never married46.3% Now married0.0% Separated2.3% Widowed7.3% DivorcedFemales 14.1% Never married51.5% Now married0.0% Separated34.4% Widowed0.0% DivorcedWomen who did not give birth in the past 12 months Now married:
78.2% (86)Unmarried:
21.8% (24)
Marital status - Other race population 15 years and over
Males 42.5% Never married44.5% Now married3.7% Separated0.5% Widowed8.9% DivorcedFemales 33.8% Never married42.7% Now married9.8% Separated5.4% Widowed8.3% DivorcedWomen who gave birth in the past 12 months Now married:
100.0% (921)Unmarried:
0.0% (0)
Women who did not give birth in the past 12 months Now married:
45.6% (4,609)Unmarried:
54.4% (5,497)
Marital status - Two or more races population 15 years and over
Males 45.9% Never married41.7% Now married2.8% Separated1.1% Widowed8.5% DivorcedFemales 40.8% Never married37.1% Now married3.0% Separated5.4% Widowed13.7% DivorcedWomen who gave birth in the past 12 months Now married:
53.0% (513)Unmarried:
47.0% (455)
Women who did not give birth in the past 12 months Now married:
34.8% (8,731)Unmarried:
65.2% (16,387)
Marital status - White alone, not Hispanic / Latino population 15 years and over
Males 33.9% Never married52.0% Now married1.3% Separated2.7% Widowed10.0% DivorcedFemales 26.4% Never married47.2% Now married1.8% Separated8.4% Widowed16.2% DivorcedWomen who gave birth in the past 12 months Now married:
82.6% (5,046)Unmarried:
17.4% (1,064)
Women who did not give birth in the past 12 months Now married:
42.1% (40,959)Unmarried:
57.9% (56,252)
Marital status - Hispanic or Latino population 15 years and over
Males 42.0% Never married43.8% Now married4.5% Separated1.1% Widowed8.6% DivorcedFemales 33.7% Never married45.0% Now married4.5% Separated5.3% Widowed11.6% DivorcedWomen who gave birth in the past 12 months Now married:
66.3% (1,351)Unmarried:
33.7% (686)
Women who did not give birth in the past 12 months Now married:
45.8% (13,017)Unmarried:
54.2% (15,380)
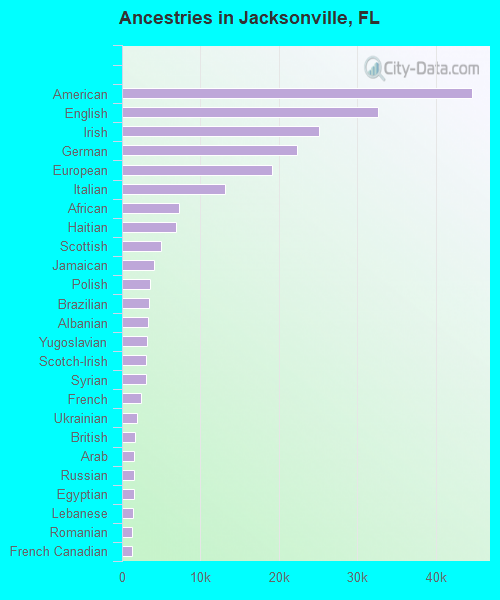
Ancestries in Jacksonville
44,585 8.2% American32,695 6.0% English25,129 4.6% Irish22,326 4.1% German19,195 3.5% European13,161 2.4% Italian7,270 1.3% African6,893 1.3% Haitian4,925 0.9% Scottish4,038 0.7% Jamaican3,554 0.7% Polish3,455 0.6% Brazilian3,254 0.6% Albanian3,206 0.6% Yugoslavian3,089 0.6% Scotch-Irish3,081 0.6% Syrian2,412 0.4% French1,954 0.4% Ukrainian1,596 0.3% British1,546 0.3% Arab1,517 0.3% Russian1,502 0.3% Egyptian1,341 0.2% Lebanese1,294 0.2% Romanian1,249 0.2% French Canadian1,228 0.2% Norwegian1,226 0.2% Dutch1,226 0.2% Nigerian1,210 0.2% Iraqi1,209 0.2% Greek1,199 0.2% Swedish903 0.2% Portuguese890 0.2% Eastern European874 0.2% Scandinavian770 0.1% Afghan684 0.1% Canadian674 0.1% Iranian665 0.1% Hungarian648 0.1% Serbian638 0.1% Welsh620 0.1% Trinidadian and Tobagonian544 0.10% Turkish540 0.10% Guyanese527 0.10% Ethiopian509 0.09% West Indian446 0.08% Bulgarian430 0.08% Sudanese407 0.07% Northern European395 0.07% Czech385 0.07% Slavic302 0.06% Danish299 0.05% Bahamian294 0.05% Cape Verdean290 0.05% Croatian285 0.05% Moroccan263 0.05% Palestinian250 0.05% Czechoslovakian243 0.04% Austrian228 0.04% Swiss224 0.04% Jordanian216 0.04% British West Indian208 0.04% Finnish200 0.04% Slovak191 0.04% Cajun188 0.03% South African183 0.03% Lithuanian181 0.03% Barbadian161 0.03% New Zealander157 0.03% Ghanaian131 0.02% Belizean129 0.02% Australian92 0.02% Kenyan82 0.02% Armenian78 0.01% Macedonian70 0.01% Sierra Leonean69 0.01% Cypriot69 0.01% Liberian52 0.01% U.S. Virgin Islander49 0.01% Estonian43 0.01% Celtic41 0.01% Belgian40 0.01% Israeli38 0.01% Basque32 0.01% Icelander29 0.01% Latvian
Geographical mobility in Jacksonville Same house 1 year ago 409,410 84.6% White (Caucasian)238,667 83.9% Black or African American2,253 79.7% American Indian / Alaska Native42,064 85.4% Asian454 69.4% Native Hawaiian / Pacific Islander33,073 81.3% Other race79,245 80.3% Two or more races388,655 84.8% White alone, not Hispanic / Latino94,951 82.8% Hispanic or LatinoMoved within same county 36,476 7.5% White / Caucasian30,640 10.8% Black or African American202 7.2% American Indian / Alaska Native3,011 6.1% Asian137 20.9% Native Hawaiian / Pacific Islander3,670 9.0% Other race8,921 9.0% Two or more races34,730 7.6% White alone, not Hispanic / Latino9,336 8.1% Hispanic or LatinoMoved within same state 14,914 3.1% White / Caucasian9,334 3.3% Black or African American203 7.2% American Indian / Alaska Native734 1.5% Asian97 14.8% Native Hawaiian / Pacific Islander1,416 3.5% Other race3,607 3.7% Two or more races14,189 3.1% White alone, not Hispanic / Latino3,640 3.2% Hispanic or LatinoMoved from different state 19,168 4.0% White / Caucasian5,182 1.8% Black or African American80 2.8% American Indian / Alaska Native2,184 4.4% Asian17 2.6% Native Hawaiian / Pacific Islander2,064 5.1% Other race4,605 4.7% Two or more races18,549 4.0% White alone, not Hispanic / Latino2,618 2.3% Hispanic or LatinoMoved from abroad 4,203 0.9% White785 0.3% Black or African American59 2.1% American Indian / Alaska Native1,270 2.6% Asian437 1.1% Other race2,249 2.3% Two or more races2,343 0.5% White alone, not Hispanic / Latino4,111 3.6% Hispanic or Latino
Children Nativity (place of birth) in Jacksonville
Children under 6 years - Living with two parents Both parents native 30,130 100.0% NativeBoth parents foreign-born 4,745 89.5% Native555 10.5% Foreign-bornOne native, one foreign-born parent 5,135 100.0% NativeChildren under 6 years - Living with one parent Native parent 27,903 99.6% Native103 0.4% Foreign-bornForeign-born parent 1,925 77.1% Native572 22.9% Foreign-bornChildren 6 to 17 years - Living with two parents Both parents native 45,368 100.0% NativeBoth parents foreign-born 12,024 69.3% Native5,327 30.7% Foreign-bornOne native, one foreign-born parent 7,851 95.3% Native388 4.7% Foreign-bornChildren 6 to 17 years - Living with one parent Native parent 52,954 100.0% NativeForeign-born parent 8,018 55.2% Native6,505 44.8% Foreign-born
Place of birth for residents in Jacksonville 54,523 Americas52,854 Latin America41,800 Asia22,595 Caribbean20,014 South Eastern Asia17,977 Europe16,374 South America13,884 Central America12,285 Eastern Europe10,656 South Central Asia5,989 Western Asia5,845 Africa4,947 Eastern Asia2,604 China2,323 Western Europe2,317 Northern Europe2,299 Western Africa1,669 Northern America1,489 Eastern Africa1,156 Northern Africa1,038 Southern Europe369 Oceania348 Australia and New Zealand Subregion272 Southern Africa84 Middle Africa12,773 Philippines8,422 India7,333 Cuba6,235 Haiti5,563 Mexico5,272 Venezuela4,502 Jamaica3,679 Bosnia and Herzegovina3,669 Brazil3,574 Vietnam3,564 Colombia2,591 Honduras2,456 Albania2,274 China2,272 Syria2,109 Guatemala1,957 Dominican Republic1,637 Germany1,613 Canada1,584 Ukraine1,325 Burma (Myanmar)1,314 Iraq1,296 El Salvador1,291 Japan1,080 United Kingdom1,078 Trinidad and Tobago1,052 Korea1,018 Russia984 Peru925 Nigeria908 Thailand895 Panama831 Nicaragua826 Ecuador826 Ethiopia812 Cambodia749 Bangladesh705 Jordan681 Guyana661 England647 Moldova598 Egypt589 Iran560 Liberia525 Bahamas508 Argentina478 Romania465 Costa Rica447 Serbia408 Poland372 Israel354 Spain332 Pakistan329 Lebanon326 Croatia314 Togo292 Barbados285 Afghanistan279 Italy279 Chile274 Sudan272 South Africa270 Bulgaria268 Turkey268 Uruguay252 Laos252 Portugal251 Austria240 United Arab Emirates239 Ghana233 Bolivia232 Morocco232 New Zealand217 Indonesia216 Kenya209 France204 Belarus189 Taiwan183 Dominica183 Ireland182 Saudi Arabia181 Tanzania177 Hungary176 Kuwait151 Greece140 Hong Kong133 Senegal130 Belize129 Belgium122 Bhutan115 Australia111 Scotland104 Norway90 St. Lucia90 Sweden84 Malaysia81 Netherlands77 Uzbekistan71 Grenada64 Singapore61 Azerbaijan55 Lithuania55 Czechoslovakia53 Uganda48 Denmark45 Congo34 Nepal31 Algeria25 Zimbabwe24 Cameroon21 Fiji14 Democratic Republic of Congo (Zaire)13 Switzerland11 Sierra Leone6 Eritrea6 Latvia
Grandparents responsible for own grandchildren in Jacksonville
Grandparents (30 to 59 years) White / Caucasian 1,003 35.5% Responsible for grandchildren1,824 64.5% Not responsible for grandchildrenBlack or African American 2,342 62.7% Responsible for grandchildren1,395 37.3% Not responsible for grandchildrenAmerican Indian / Alaska Native 30 100.0% Responsible for grandchildrenAsian 92 10.8% Responsible for grandchildren755 89.2% Not responsible for grandchildrenNative Hawaiian / Pacific Islander 8 16.3% Responsible for grandchildren40 83.7% Not responsible for grandchildrenOther race 84 58.7% Responsible for grandchildren59 41.3% Not responsible for grandchildrenTwo or more races 85 23.0% Responsible for grandchildren284 77.0% Not responsible for grandchildrenWhite alone, not Hispanic / Latino 1,003 35.5% Responsible for grandchildren1,824 64.5% Not responsible for grandchildrenHispanic or Latino 116 30.0% Responsible for grandchildren270 70.0% Not responsible for grandchildrenGrandparents (60 years and over) White / Caucasian 1,798 38.3% Responsible for grandchildren2,901 61.7% Not responsible for grandchildrenBlack or African American 1,158 37.3% Responsible for grandchildren1,948 62.7% Not responsible for grandchildrenAmerican Indian / Alaska Native 11 23.2% Responsible for grandchildren35 76.8% Not responsible for grandchildrenAsian 101 9.3% Responsible for grandchildren986 90.7% Not responsible for grandchildrenNative Hawaiian / Pacific Islander 90 100.0% Not responsible for grandchildrenOther race 149 22.4% Responsible for grandchildren515 77.6% Not responsible for grandchildrenTwo or more races 629 58.4% Responsible for grandchildren448 41.6% Not responsible for grandchildrenWhite alone, not Hispanic / Latino 1,798 39.9% Responsible for grandchildren2,706 60.1% Not responsible for grandchildrenHispanic or Latino 543 35.9% Responsible for grandchildren971 64.1% Not responsible for grandchildren
Zip codes: 32202 , 32204 , 32205 , 32206 , 32207 , 32208 , 32209 , 32210 , 32211 , 32212 , 32216 , 32217 , 32218 , 32219 , 32221 , 32222 , 32223 , 32224 , 32225 , 32226 , 32227 , 32228 , 32244 , 32246 , 32250 , 32254 , 32256 , 32257 , 32258 , 32277 .