Races in Indiantown, Florida (FL) Detailed Stats
Data:
Races - White alone (%)
Races - White alone (% change since 2000)
Races - Black alone (%)
Races - Black alone (% change since 2000)
Races - American Indian alone (%)
Races - American Indian alone (% change since 2000)
Races - Asian alone (%)
Races - Asian alone (% change since 2000)
Races - Hispanic (%)
Races - Hispanic (% change since 2000)
Races - Native Hawaiian and Other Pacific Islander alone (%)
Races - Native Hawaiian and Other Pacific Islander alone (% change since 2000)
Races - Two or more races(%)
Races - Two or more races(% change since 2000)
Races - Other race alone (%)
Races - Other race alone (% change since 2000)
Racial diversity
Place of birth - Born in state of residence (%)
Place of birth - Born in state of residence (%) - White
Place of birth - Born in state of residence (%) - Black or African American
Place of birth - Born in state of residence (%) - Asian
Place of birth - Born in state of residence (%) - Hispanic or Latino
Place of birth - Born in state of residence (%) - American Indian and Alaska Native
Place of birth - Born in state of residence (%) - Multirace
Place of birth - Born in state of residence (%) - Other Race
Place of birth - Born in other state (%)
Place of birth - Born in other state (%) - White
Place of birth - Born in other state (%) - Black or African American
Place of birth - Born in other state (%) - Asian
Place of birth - Born in other state (%) - Hispanic or Latino
Place of birth - Born in other state (%) - American Indian and Alaska Native
Place of birth - Born in other state (%) - Multirace
Place of birth - Born in other state (%) - Other Race
Place of birth - Native, outside of US (%)
Place of birth - Native, outside of US (%) - White
Place of birth - Native, outside of US (%) - Black or African American
Place of birth - Native, outside of US (%) - Asian
Place of birth - Native, outside of US (%) - Hispanic or Latino
Place of birth - Native, outside of US (%) - American Indian and Alaska Native
Place of birth - Native, outside of US (%) - Multirace
Place of birth - Native, outside of US (%) - Other Race
Place of birth - Foreign born (%)
Place of birth - Foreign born (%) - White
Place of birth - Foreign born (%) - Black or African American
Place of birth - Foreign born (%) - Asian
Place of birth - Foreign born (%) - Hispanic or Latino
Place of birth - Foreign born (%) - American Indian and Alaska Native
Place of birth - Foreign born (%) - Multirace
Place of birth - Foreign born (%) - Other Race
Residents speaking English at home (%)
Residents speaking English at home - Born in the United States (%)
Residents speaking English at home - Native, born elsewhere (%)
Residents speaking English at home - Foreign born (%)
Residents speaking Spanish at home (%)
Residents speaking Spanish at home - Born in the United States (%)
Residents speaking Spanish at home - Native, born elsewhere (%)
Residents speaking Spanish at home - Foreign born (%)
Residents speaking other language at home (%)
Residents speaking other language at home - Born in the United States (%)
Residents speaking other language at home - Native, born elsewhere (%)
Residents speaking other language at home - Foreign born (%)
Marital status - Never married (%)
Marital status - Now married (%)
Marital status - Separated (%)
Marital status - Widowed (%)
Marital status - Divorced (%)
Ancestries Reported - Arab (%)
Ancestries Reported - Czech (%)
Ancestries Reported - Danish (%)
Ancestries Reported - Dutch (%)
Ancestries Reported - English (%)
Ancestries Reported - French (%)
Ancestries Reported - French Canadian (%)
Ancestries Reported - German (%)
Ancestries Reported - Greek (%)
Ancestries Reported - Hungarian (%)
Ancestries Reported - Irish (%)
Ancestries Reported - Italian (%)
Ancestries Reported - Lithuanian (%)
Ancestries Reported - Norwegian (%)
Ancestries Reported - Polish (%)
Ancestries Reported - Portuguese (%)
Ancestries Reported - Russian (%)
Ancestries Reported - Scotch-Irish (%)
Ancestries Reported - Scottish (%)
Ancestries Reported - Slovak (%)
Ancestries Reported - Subsaharan African (%)
Ancestries Reported - Swedish (%)
Ancestries Reported - Swiss (%)
Ancestries Reported - Ukrainian (%)
Ancestries Reported - United States (%)
Ancestries Reported - Welsh (%)
Ancestries Reported - West Indian (%)
Ancestries Reported - Other (%)
Geographical mobility - Same house 1 year ago (%)
Geographical mobility - Same house 1 year ago (%) - White
Geographical mobility - Same house 1 year ago (%) - Black or African American
Geographical mobility - Same house 1 year ago (%) - Asian
Geographical mobility - Same house 1 year ago (%) - Hispanic or Latino
Geographical mobility - Same house 1 year ago (%) - American Indian and Alaska Native
Geographical mobility - Same house 1 year ago (%) - Multirace
Geographical mobility - Same house 1 year ago (%) - Other Race
Geographical mobility - Moved within same county (%)
Geographical mobility - Moved within same county (%) - White
Geographical mobility - Moved within same county (%) - Black or African American
Geographical mobility - Moved within same county (%) - Asian
Geographical mobility - Moved within same county (%) - Hispanic or Latino
Geographical mobility - Moved within same county (%) - American Indian and Alaska Native
Geographical mobility - Moved within same county (%) - Multirace
Geographical mobility - Moved within same county (%) - Other Race
Geographical mobility - Moved from different county within same state (%)
Geographical mobility - Moved from different county within same state (%) - White
Geographical mobility - Moved from different county within same state (%) - Black or African American
Geographical mobility - Moved from different county within same state (%) - Asian
Geographical mobility - Moved from different county within same state (%) - Hispanic or Latino
Geographical mobility - Moved from different county within same state (%) - American Indian and Alaska Native
Geographical mobility - Moved from different county within same state (%) - Multirace
Geographical mobility - Moved from different county within same state (%) - Other Race
Geographical mobility - Moved from different state (%)
Geographical mobility - Moved from different state (%) - White
Geographical mobility - Moved from different state (%) - Black or African American
Geographical mobility - Moved from different state (%) - Asian
Geographical mobility - Moved from different state (%) - Hispanic or Latino
Geographical mobility - Moved from different state (%) - American Indian and Alaska Native
Geographical mobility - Moved from different state (%) - Multirace
Geographical mobility - Moved from different state (%) - Other Race
Geographical mobility - Moved from abroad (%)
Geographical mobility - Moved from abroad (%) - White
Geographical mobility - Moved from abroad (%) - Black or African American
Geographical mobility - Moved from abroad (%) - Asian
Geographical mobility - Moved from abroad (%) - Hispanic or Latino
Geographical mobility - Moved from abroad (%) - American Indian and Alaska Native
Geographical mobility - Moved from abroad (%) - Multirace
Geographical mobility - Moved from abroad (%) - Other Race
Place of birth for the foreign-born population - Ireland (%)
Place of birth for the foreign-born population - Denmark (%)
Place of birth for the foreign-born population - Norway (%)
Place of birth for the foreign-born population - Sweden (%)
Place of birth for the foreign-born population - United Kingdom (%)
Place of birth for the foreign-born population - England (%)
Place of birth for the foreign-born population - Scotland (%)
Place of birth for the foreign-born population - Other Northern Europe (%)
Place of birth for the foreign-born population - Austria (%)
Place of birth for the foreign-born population - Belgium (%)
Place of birth for the foreign-born population - France (%)
Place of birth for the foreign-born population - Germany (%)
Place of birth for the foreign-born population - Netherlands (%)
Place of birth for the foreign-born population - Switzerland (%)
Place of birth for the foreign-born population - Other Western Europe (%)
Place of birth for the foreign-born population - Greece (%)
Place of birth for the foreign-born population - Italy (%)
Place of birth for the foreign-born population - Portugal (%)
Place of birth for the foreign-born population - Spain (%)
Place of birth for the foreign-born population - Other Southern Europe (%)
Place of birth for the foreign-born population - Albania (%)
Place of birth for the foreign-born population - Belarus (%)
Place of birth for the foreign-born population - Bosnia and Herzegovina (%)
Place of birth for the foreign-born population - Bulgaria (%)
Place of birth for the foreign-born population - Croatia (%)
Place of birth for the foreign-born population - Czechoslovakia (%)
Place of birth for the foreign-born population - Hungary (%)
Place of birth for the foreign-born population - Latvia (%)
Place of birth for the foreign-born population - Lithuania (%)
Place of birth for the foreign-born population - North Macedonia (Macedonia) (%)
Place of birth for the foreign-born population - Moldova (%)
Place of birth for the foreign-born population - Poland (%)
Place of birth for the foreign-born population - Romania (%)
Place of birth for the foreign-born population - Russia (%)
Place of birth for the foreign-born population - Serbia (%)
Place of birth for the foreign-born population - Ukraine (%)
Place of birth for the foreign-born population - Other Eastern Europe (%)
Place of birth for the foreign-born population - China (%)
Place of birth for the foreign-born population - Hong Kong (%)
Place of birth for the foreign-born population - Taiwan (%)
Place of birth for the foreign-born population - Japan (%)
Place of birth for the foreign-born population - Korea (%)
Place of birth for the foreign-born population - Other Eastern Asia (%)
Place of birth for the foreign-born population - Afghanistan (%)
Place of birth for the foreign-born population - Bangladesh (%)
Place of birth for the foreign-born population - India (%)
Place of birth for the foreign-born population - Iran (%)
Place of birth for the foreign-born population - Kazakhstan (%)
Place of birth for the foreign-born population - Nepal (%)
Place of birth for the foreign-born population - Pakistan (%)
Place of birth for the foreign-born population - Sri Lanka (%)
Place of birth for the foreign-born population - Uzbekistan (%)
Place of birth for the foreign-born population - Other South Central Asia (%)
Place of birth for the foreign-born population - Burma (%)
Place of birth for the foreign-born population - Cambodia (%)
Place of birth for the foreign-born population - Indonesia (%)
Place of birth for the foreign-born population - Laos (%)
Place of birth for the foreign-born population - Malaysia (%)
Place of birth for the foreign-born population - Philippines (%)
Place of birth for the foreign-born population - Singapore (%)
Place of birth for the foreign-born population - Thailand (%)
Place of birth for the foreign-born population - Vietnam (%)
Place of birth for the foreign-born population - Other South Eastern Asia (%)
Place of birth for the foreign-born population - Armenia (%)
Place of birth for the foreign-born population - Iraq (%)
Place of birth for the foreign-born population - Israel (%)
Place of birth for the foreign-born population - Jordan (%)
Place of birth for the foreign-born population - Kuwait (%)
Place of birth for the foreign-born population - Lebanon (%)
Place of birth for the foreign-born population - Saudi Arabia (%)
Place of birth for the foreign-born population - Syria (%)
Place of birth for the foreign-born population - Turkey (%)
Place of birth for the foreign-born population - Yemen (%)
Place of birth for the foreign-born population - Other Western Asia (%)
Place of birth for the foreign-born population - Eritrea (%)
Place of birth for the foreign-born population - Ethiopia (%)
Place of birth for the foreign-born population - Kenya (%)
Place of birth for the foreign-born population - Somalia (%)
Place of birth for the foreign-born population - Uganda (%)
Place of birth for the foreign-born population - Zimbabwe (%)
Place of birth for the foreign-born population - Other Eastern Africa (%)
Place of birth for the foreign-born population - Cameroon (%)
Place of birth for the foreign-born population - Congo (%)
Place of birth for the foreign-born population - Democratic Republic of Congo (Zaire) (%)
Place of birth for the foreign-born population - Other Middle Africa (%)
Place of birth for the foreign-born population - Egypt (%)
Place of birth for the foreign-born population - Morocco (%)
Place of birth for the foreign-born population - Sudan (%)
Place of birth for the foreign-born population - Other Northern Africa (%)
Place of birth for the foreign-born population - South Africa (%)
Place of birth for the foreign-born population - Other Southern Africa (%)
Place of birth for the foreign-born population - Cabo Verde (%)
Place of birth for the foreign-born population - Ghana (%)
Place of birth for the foreign-born population - Liberia (%)
Place of birth for the foreign-born population - Nigeria (%)
Place of birth for the foreign-born population - Senegal (%)
Place of birth for the foreign-born population - Sierra Leone (%)
Place of birth for the foreign-born population - Other Western Africa (%)
Place of birth for the foreign-born population - Australia (%)
Place of birth for the foreign-born population - New Zealand (%)
Place of birth for the foreign-born population - Fiji (%)
Place of birth for the foreign-born population - Micronesia (%)
Place of birth for the foreign-born population - Bahamas (%)
Place of birth for the foreign-born population - Barbados (%)
Place of birth for the foreign-born population - Cuba (%)
Place of birth for the foreign-born population - Dominica (%)
Place of birth for the foreign-born population - Dominican Republic (%)
Place of birth for the foreign-born population - Grenada (%)
Place of birth for the foreign-born population - Haiti (%)
Place of birth for the foreign-born population - Jamaica (%)
Place of birth for the foreign-born population - St. Vincent and the Grenadines (%)
Place of birth for the foreign-born population - Trinidad and Tobago (%)
Place of birth for the foreign-born population - West Indies (%)
Place of birth for the foreign-born population - Other Caribbean (%)
Place of birth for the foreign-born population - Belize (%)
Place of birth for the foreign-born population - Costa Rica (%)
Place of birth for the foreign-born population - El Salvador (%)
Place of birth for the foreign-born population - Guatemala (%)
Place of birth for the foreign-born population - Honduras (%)
Place of birth for the foreign-born population - Mexico (%)
Place of birth for the foreign-born population - Nicaragua (%)
Place of birth for the foreign-born population - Panama (%)
Place of birth for the foreign-born population - Other Central America (%)
Place of birth for the foreign-born population - Argentina (%)
Place of birth for the foreign-born population - Bolivia (%)
Place of birth for the foreign-born population - Brazil (%)
Place of birth for the foreign-born population - Chile (%)
Place of birth for the foreign-born population - Colombia (%)
Place of birth for the foreign-born population - Ecuador (%)
Place of birth for the foreign-born population - Guyana (%)
Place of birth for the foreign-born population - Peru (%)
Place of birth for the foreign-born population - Uruguay (%)
Place of birth for the foreign-born population - Venezuela (%)
Place of birth for the foreign-born population - Other South America (%)
Place of birth for the foreign-born population - Canada (%)
Place of birth for the foreign-born population - Other Northern America (%)
Place of birth for the foreign-born population - Other (%)
Latest news about races in Indiantown, FL collected exclusively by city-data.com from local newspapers, TV, and radio stations
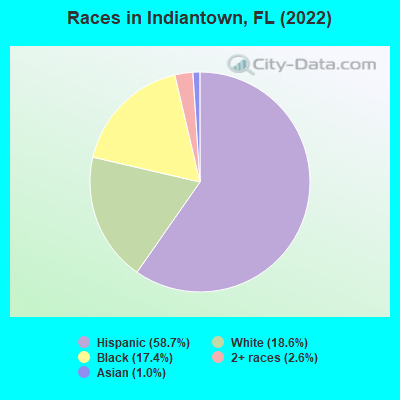
According to 2022 data, the most numerous races in Indiantown, FL are White alone (1,249 residents), Hispanic (3,955 residents), and Black alone (1,172 residents). 53.9% of Indiantown residents speak English at home. 23.1% of Indiantown, FL residents are foreign-born (20.5% born in Latin America), which is 9.3% greater than the foreign-born rate of 21.0% across the entire state of Florida.
Race distribution in Indiantown
2000 2022
10,458,509 65.4% White alone 2,682,715 16.8% Hispanic 2,264,268 14.2% Black alone 261,693 1.6% Asian alone 236,954 1.5% Two or more races 42,358 0.3% American Indian alone 28,994 0.2% Other race alone 6,887 0.04% Native Hawaiian and Other
11,309,403 50.8% White alone 6,025,039 27.1% Hispanic 3,241,015 14.6% Black alone 861,630 3.9% Two or more races 623,692 2.8% Asian alone 152,054 0.7% Other race alone 22,504 0.1% American Indian alone 9,486 0.04% Native Hawaiian and Other
Income and house value in Indiantown Median household income in 2022 $49,280 White non-Hispanic householders$119,464 Some other race householders$63,936 Hispanic or Latino race householdersMedian 2022 house value $170,912 White Non-Hispanic householders$118,953 Black or African American householders$187,937 American Indian or Alaska Native householders$189,263 Some other race householders$125,586 Two or more races householders$181,967 Hispanic or Latino householders
Median age by race in Indiantown
48.1 Median age for White residents39.4 51.9 37.2 Median age for Black or African American residents41.4 37.3 -700,813,007.4 Median age for American Indian / Alaska Native residents-465,564,737.8 -924,867,723.9 -798,099,761.7 Median age for Asian residents-793,048,972.4 -807,354,115.9 -666,666,666.0 Median age for Native Hawaiian / Pacific Islander residents-666,666,666.0 -666,666,666.0 29.0 Median age for Other race residents29.5 23.5 11.9 Median age for Two or more races residents11.4 16.7 69.0 Median age for White alone residents74.1 67.1 25.4 Median age for Hispanic or Latino residents25.0 25.1
Owner/renter occupied households by race in Indiantown
House owners and renters - White residents 975 89.6% Owner occupied113 10.4% Renter occupiedHouse owners and renters - Black or African American residents 213 55.2% Owner occupied173 44.8% Renter occupiedHouse owners and renters - Other race residents 119 42.8% Owner occupied159 57.2% Renter occupiedHouse owners and renters - Two or more races residents 286 86.9% Owner occupied43 13.1% Renter occupiedHouse owners and renters - White alone residents 684 95.4% Owner occupied33 4.6% Renter occupiedHouse owners and renters - Hispanic or Latino residents 553 68.1% Owner occupied259 31.9% Renter occupied
Language usage in Indiantown
English speakers - Total 53.9% of residents of Indiantown speak English at home.
45.4% of residents speak Spanish at home 1,795 63.8% Speak English very well1,017 36.2% Speak English less than very well0.9% of residents speak other language at home 36 64.3% Speak English very well20 35.7% Speak English less than very well
English speakers - Born in the United States 83.6% of residents of Indiantown speak English at home.
12.2% of residents speak Spanish at home 67 45.0% Speak English very well82 55.0% Speak English less than very well2.9% of residents speak other language at home 35 100.0% Speak English very well
English speakers - Native, born elsewhere 6.3% of residents of Indiantown speak English at home.
61.5% of residents speak Spanish at home 118 63.8% Speak English very well67 36.2% Speak English less than very well
English speakers - Foreign-born 17.0% of residents of Indiantown speak English at home.
88.4% of residents speak Spanish at home 586 45.3% Speak English very well707 54.7% Speak English less than very well1.4% of residents speak other language at home 20 100.0% Speak English less than very well
White (Caucasian) - Speak only English Native:
66.2% (1,295)Foreign-born:
7.0% (23)
White (Caucasian) - Speak another language Native:
26.1% (510)Foreign-born:
65.6% (213)
Black or African American - Speak only English Native:
96.1% (1,180)Foreign-born:
97.0% (32)
Other race - Speak only English Native:
12.8% (89)Foreign-born:
36.8% (258)
Other race - Speak another language Native:
71.0% (491)Foreign-born:
67.4% (473)
Two or more races - Speak another language Native:
39.7% (465)Foreign-born:
100.0% (732)
White alone - Speak only English Native:
95.9% (1,127)Foreign-born:
60.2% (25)
White alone - Speak another language Native:
3.7% (44)Foreign-born:
39.9% (17)
Hispanic or Latino - Speak only English Native:
30.1% (684)Foreign-born:
7.3% (105)
Hispanic or Latino - Speak another language Native:
68.5% (1,554)Foreign-born:
93.4% (1,339)
Foreign-born residents in Indiantown 1,558 residents are foreign born (20.5% Latin America ).
This city:
23.1%Florida:
21.1%
Marital status for residents in Indiantown Marital status - White (Caucasian) population 15 years and over
Males 38.8% Never married31.6% Now married0.0% Separated5.6% Widowed23.9% DivorcedFemales 17.8% Never married37.2% Now married10.0% Separated25.9% Widowed9.2% DivorcedWomen who gave birth in the past 12 months Now married:
0.0% (0)Unmarried:
100.0% (13)
Women who did not give birth in the past 12 months Now married:
44.8% (152)Unmarried:
55.2% (187)
Marital status - Black or African American population 15 years and over
Males 77.2% Never married16.9% Now married5.9% Separated0.0% Widowed0.0% DivorcedFemales 71.0% Never married9.2% Now married0.2% Separated7.9% Widowed11.7% DivorcedWomen who did not give birth in the past 12 months Now married:
0.3% (1)Unmarried:
99.7% (330)
Marital status - Other race population 15 years and over
Males 69.4% Never married21.0% Now married3.8% Separated0.0% Widowed5.9% DivorcedFemales 51.4% Never married30.1% Now married6.1% Separated5.2% Widowed7.2% DivorcedWomen who did not give birth in the past 12 months Now married:
20.1% (69)Unmarried:
79.9% (274)
Marital status - Two or more races population 15 years and over
Males 45.9% Never married40.7% Now married2.6% Separated0.0% Widowed10.8% DivorcedFemales 34.5% Never married42.3% Now married0.0% Separated10.0% Widowed13.2% DivorcedWomen who gave birth in the past 12 months Now married:
100.0% (102)Unmarried:
0.0% (0)
Women who did not give birth in the past 12 months Now married:
18.0% (39)Unmarried:
82.0% (179)
Marital status - White alone, not Hispanic / Latino population 15 years and over
Males 11.1% Never married36.0% Now married0.0% Separated11.9% Widowed41.0% DivorcedFemales 13.1% Never married31.2% Now married5.9% Separated38.0% Widowed11.7% DivorcedWomen who did not give birth in the past 12 months Now married:
49.0% (74)Unmarried:
51.0% (77)
Marital status - Hispanic or Latino population 15 years and over
Males 63.9% Never married26.2% Now married2.0% Separated0.0% Widowed7.9% DivorcedFemales 33.6% Never married37.2% Now married8.6% Separated8.5% Widowed12.0% DivorcedWomen who gave birth in the past 12 months Now married:
81.1% (70)Unmarried:
18.9% (16)
Women who did not give birth in the past 12 months Now married:
28.0% (187)Unmarried:
72.0% (480)
Ancestries in Indiantown
734 15.4% American155 3.2% English127 2.7% German68 1.4% Italian51 1.1% Irish43 0.9% French37 0.8% Polish34 0.7% British16 0.3% Swedish12 0.3% Canadian11 0.2% Portuguese10 0.2% Czech7 0.1% Scottish6 0.1% Scotch-Irish2 0.04% Hungarian
Geographical mobility in Indiantown Same house 1 year ago 2,396 93.7% White (Caucasian)1,226 100.0% Black or African American84 100.0% Asian1,527 95.1% Other race1,764 100.0% Two or more races1,051 85.0% White alone, not Hispanic / Latino3,880 100.0% Hispanic or LatinoMoved within same county 103 4.0% White / Caucasian30 1.9% Other race105 8.5% White alone, not Hispanic / Latino15 0.4% Hispanic or LatinoMoved within same state 9 0.3% White / Caucasian13 0.8% Other race9 0.7% White alone, not Hispanic / Latino9 0.2% Hispanic or LatinoMoved from different state 32 1.3% White / Caucasian32 2.6% White alone, not Hispanic / LatinoMoved from abroad 7 0.3% White48 3.0% Other race11 0.9% White alone, not Hispanic / Latino37 1.0% Hispanic or Latino
Children Nativity (place of birth) in Indiantown
Children under 6 years - Living with two parents Both parents foreign-born 338 100.0% NativeChildren under 6 years - Living with one parent Native parent 258 100.0% NativeForeign-born parent 62 100.0% NativeChildren 6 to 17 years - Living with two parents Both parents foreign-born 174 50.0% Native175 50.0% Foreign-bornOne native, one foreign-born parent 59 100.0% NativeChildren 6 to 17 years - Living with one parent Native parent 799 100.0% NativeForeign-born parent 90 53.3% Native79 46.7% Foreign-born
Grandparents responsible for own grandchildren in Indiantown
Grandparents (30 to 59 years) White / Caucasian 8 100.0% Not responsible for grandchildrenOther race 30 100.0% Responsible for grandchildrenTwo or more races 20 100.0% Not responsible for grandchildrenHispanic or Latino 23 50.2% Responsible for grandchildren23 49.8% Not responsible for grandchildrenGrandparents (60 years and over) White / Caucasian 62 63.6% Responsible for grandchildren36 36.4% Not responsible for grandchildrenTwo or more races 50 100.0% Responsible for grandchildrenHispanic or Latino 124 100.0% Responsible for grandchildren