Races in Hutchinson, Kansas (KS) Detailed Stats
Data:
Races - White alone (%)
Races - White alone (% change since 2000)
Races - Black alone (%)
Races - Black alone (% change since 2000)
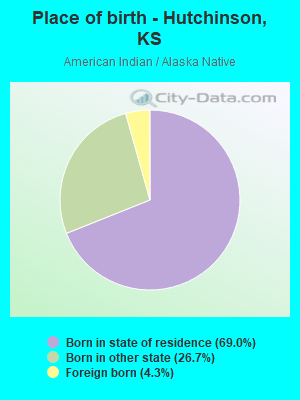
Races - American Indian alone (%)
Races - American Indian alone (% change since 2000)
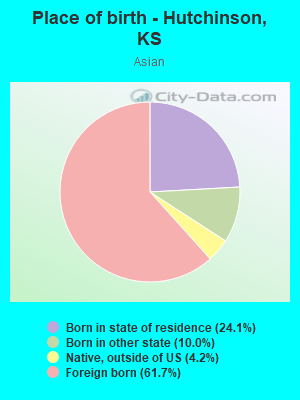
Races - Asian alone (%)
Races - Asian alone (% change since 2000)
Races - Hispanic (%)
Races - Hispanic (% change since 2000)
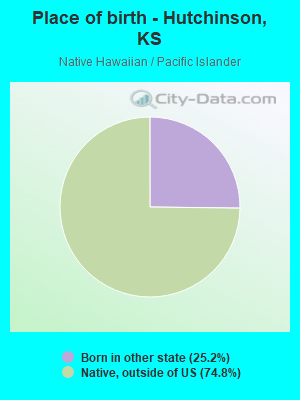
Races - Native Hawaiian and Other Pacific Islander alone (%)
Races - Native Hawaiian and Other Pacific Islander alone (% change since 2000)
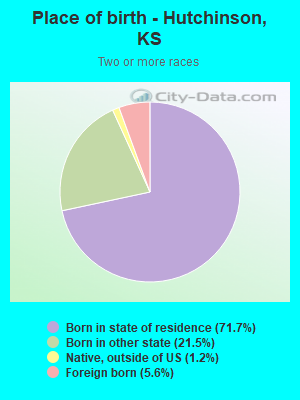
Races - Two or more races(%)
Races - Two or more races(% change since 2000)
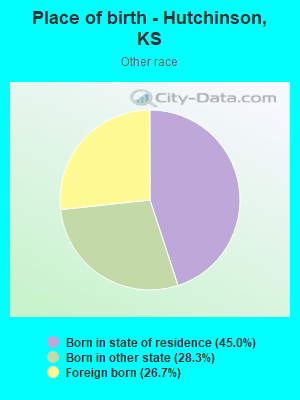
Races - Other race alone (%)
Races - Other race alone (% change since 2000)
Racial diversity
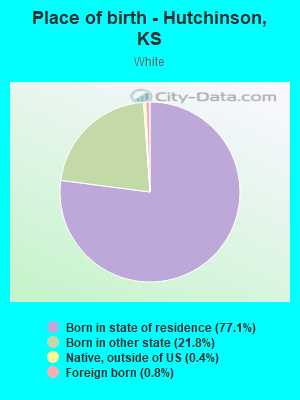
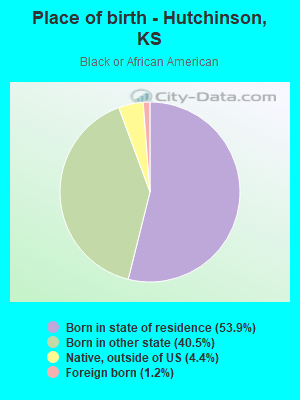
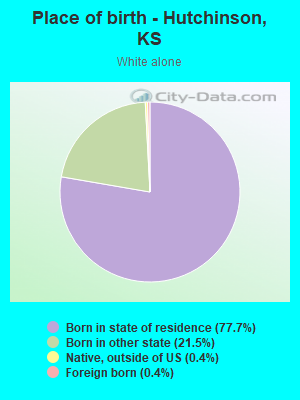
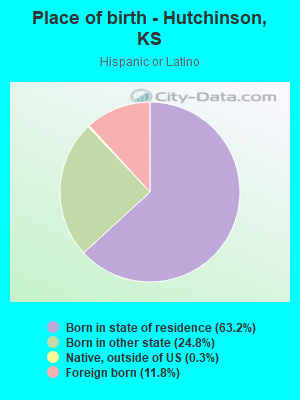
Place of birth - Born in state of residence (%)
Place of birth - Born in state of residence (%) - White
Place of birth - Born in state of residence (%) - Black or African American
Place of birth - Born in state of residence (%) - Asian
Place of birth - Born in state of residence (%) - Hispanic or Latino
Place of birth - Born in state of residence (%) - American Indian and Alaska Native
Place of birth - Born in state of residence (%) - Multirace
Place of birth - Born in state of residence (%) - Other Race
Place of birth - Born in other state (%)
Place of birth - Born in other state (%) - White
Place of birth - Born in other state (%) - Black or African American
Place of birth - Born in other state (%) - Asian
Place of birth - Born in other state (%) - Hispanic or Latino
Place of birth - Born in other state (%) - American Indian and Alaska Native
Place of birth - Born in other state (%) - Multirace
Place of birth - Born in other state (%) - Other Race
Place of birth - Native, outside of US (%)
Place of birth - Native, outside of US (%) - White
Place of birth - Native, outside of US (%) - Black or African American
Place of birth - Native, outside of US (%) - Asian
Place of birth - Native, outside of US (%) - Hispanic or Latino
Place of birth - Native, outside of US (%) - American Indian and Alaska Native
Place of birth - Native, outside of US (%) - Multirace
Place of birth - Native, outside of US (%) - Other Race
Place of birth - Foreign born (%)
Place of birth - Foreign born (%) - White
Place of birth - Foreign born (%) - Black or African American
Place of birth - Foreign born (%) - Asian
Place of birth - Foreign born (%) - Hispanic or Latino
Place of birth - Foreign born (%) - American Indian and Alaska Native
Place of birth - Foreign born (%) - Multirace
Place of birth - Foreign born (%) - Other Race
Residents speaking English at home (%)
Residents speaking English at home - Born in the United States (%)
Residents speaking English at home - Native, born elsewhere (%)
Residents speaking English at home - Foreign born (%)
Residents speaking Spanish at home (%)
Residents speaking Spanish at home - Born in the United States (%)
Residents speaking Spanish at home - Native, born elsewhere (%)
Residents speaking Spanish at home - Foreign born (%)
Residents speaking other language at home (%)
Residents speaking other language at home - Born in the United States (%)
Residents speaking other language at home - Native, born elsewhere (%)
Residents speaking other language at home - Foreign born (%)
Marital status - Never married (%)
Marital status - Now married (%)
Marital status - Separated (%)
Marital status - Widowed (%)
Marital status - Divorced (%)
Ancestries Reported - Arab (%)
Ancestries Reported - Czech (%)
Ancestries Reported - Danish (%)
Ancestries Reported - Dutch (%)
Ancestries Reported - English (%)
Ancestries Reported - French (%)
Ancestries Reported - French Canadian (%)
Ancestries Reported - German (%)
Ancestries Reported - Greek (%)
Ancestries Reported - Hungarian (%)
Ancestries Reported - Irish (%)
Ancestries Reported - Italian (%)
Ancestries Reported - Lithuanian (%)
Ancestries Reported - Norwegian (%)
Ancestries Reported - Polish (%)
Ancestries Reported - Portuguese (%)
Ancestries Reported - Russian (%)
Ancestries Reported - Scotch-Irish (%)
Ancestries Reported - Scottish (%)
Ancestries Reported - Slovak (%)
Ancestries Reported - Subsaharan African (%)
Ancestries Reported - Swedish (%)
Ancestries Reported - Swiss (%)
Ancestries Reported - Ukrainian (%)
Ancestries Reported - United States (%)
Ancestries Reported - Welsh (%)
Ancestries Reported - West Indian (%)
Ancestries Reported - Other (%)
Geographical mobility - Same house 1 year ago (%)
Geographical mobility - Same house 1 year ago (%) - White
Geographical mobility - Same house 1 year ago (%) - Black or African American
Geographical mobility - Same house 1 year ago (%) - Asian
Geographical mobility - Same house 1 year ago (%) - Hispanic or Latino
Geographical mobility - Same house 1 year ago (%) - American Indian and Alaska Native
Geographical mobility - Same house 1 year ago (%) - Multirace
Geographical mobility - Same house 1 year ago (%) - Other Race
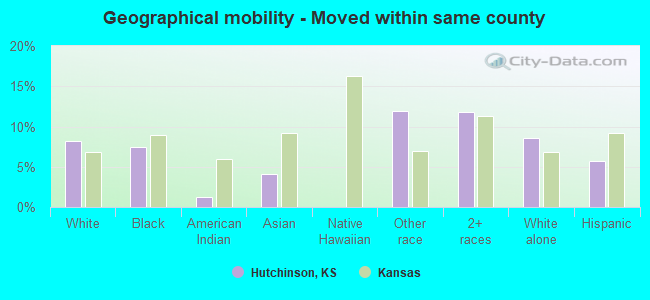
Geographical mobility - Moved within same county (%)
Geographical mobility - Moved within same county (%) - White
Geographical mobility - Moved within same county (%) - Black or African American
Geographical mobility - Moved within same county (%) - Asian
Geographical mobility - Moved within same county (%) - Hispanic or Latino
Geographical mobility - Moved within same county (%) - American Indian and Alaska Native
Geographical mobility - Moved within same county (%) - Multirace
Geographical mobility - Moved within same county (%) - Other Race
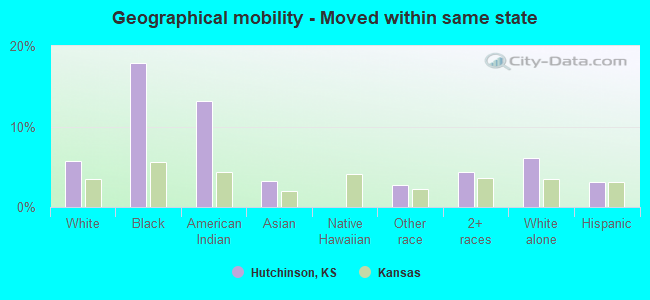
Geographical mobility - Moved from different county within same state (%)
Geographical mobility - Moved from different county within same state (%) - White
Geographical mobility - Moved from different county within same state (%) - Black or African American
Geographical mobility - Moved from different county within same state (%) - Asian
Geographical mobility - Moved from different county within same state (%) - Hispanic or Latino
Geographical mobility - Moved from different county within same state (%) - American Indian and Alaska Native
Geographical mobility - Moved from different county within same state (%) - Multirace
Geographical mobility - Moved from different county within same state (%) - Other Race
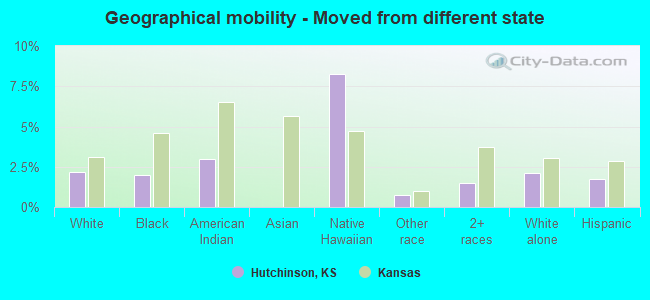
Geographical mobility - Moved from different state (%)
Geographical mobility - Moved from different state (%) - White
Geographical mobility - Moved from different state (%) - Black or African American
Geographical mobility - Moved from different state (%) - Asian
Geographical mobility - Moved from different state (%) - Hispanic or Latino
Geographical mobility - Moved from different state (%) - American Indian and Alaska Native
Geographical mobility - Moved from different state (%) - Multirace
Geographical mobility - Moved from different state (%) - Other Race
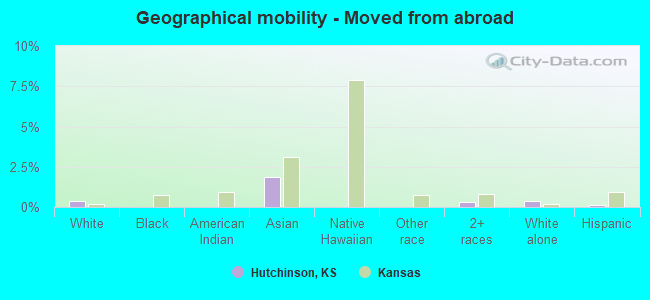
Geographical mobility - Moved from abroad (%)
Geographical mobility - Moved from abroad (%) - White
Geographical mobility - Moved from abroad (%) - Black or African American
Geographical mobility - Moved from abroad (%) - Asian
Geographical mobility - Moved from abroad (%) - Hispanic or Latino
Geographical mobility - Moved from abroad (%) - American Indian and Alaska Native
Geographical mobility - Moved from abroad (%) - Multirace
Geographical mobility - Moved from abroad (%) - Other Race
Place of birth for the foreign-born population - Ireland (%)
Place of birth for the foreign-born population - Denmark (%)
Place of birth for the foreign-born population - Norway (%)
Place of birth for the foreign-born population - Sweden (%)
Place of birth for the foreign-born population - United Kingdom (%)
Place of birth for the foreign-born population - England (%)
Place of birth for the foreign-born population - Scotland (%)
Place of birth for the foreign-born population - Other Northern Europe (%)
Place of birth for the foreign-born population - Austria (%)
Place of birth for the foreign-born population - Belgium (%)
Place of birth for the foreign-born population - France (%)
Place of birth for the foreign-born population - Germany (%)
Place of birth for the foreign-born population - Netherlands (%)
Place of birth for the foreign-born population - Switzerland (%)
Place of birth for the foreign-born population - Other Western Europe (%)
Place of birth for the foreign-born population - Greece (%)
Place of birth for the foreign-born population - Italy (%)
Place of birth for the foreign-born population - Portugal (%)
Place of birth for the foreign-born population - Spain (%)
Place of birth for the foreign-born population - Other Southern Europe (%)
Place of birth for the foreign-born population - Albania (%)
Place of birth for the foreign-born population - Belarus (%)
Place of birth for the foreign-born population - Bosnia and Herzegovina (%)
Place of birth for the foreign-born population - Bulgaria (%)
Place of birth for the foreign-born population - Croatia (%)
Place of birth for the foreign-born population - Czechoslovakia (%)
Place of birth for the foreign-born population - Hungary (%)
Place of birth for the foreign-born population - Latvia (%)
Place of birth for the foreign-born population - Lithuania (%)
Place of birth for the foreign-born population - North Macedonia (Macedonia) (%)
Place of birth for the foreign-born population - Moldova (%)
Place of birth for the foreign-born population - Poland (%)
Place of birth for the foreign-born population - Romania (%)
Place of birth for the foreign-born population - Russia (%)
Place of birth for the foreign-born population - Serbia (%)
Place of birth for the foreign-born population - Ukraine (%)
Place of birth for the foreign-born population - Other Eastern Europe (%)
Place of birth for the foreign-born population - China (%)
Place of birth for the foreign-born population - Hong Kong (%)
Place of birth for the foreign-born population - Taiwan (%)
Place of birth for the foreign-born population - Japan (%)
Place of birth for the foreign-born population - Korea (%)
Place of birth for the foreign-born population - Other Eastern Asia (%)
Place of birth for the foreign-born population - Afghanistan (%)
Place of birth for the foreign-born population - Bangladesh (%)
Place of birth for the foreign-born population - India (%)
Place of birth for the foreign-born population - Iran (%)
Place of birth for the foreign-born population - Kazakhstan (%)
Place of birth for the foreign-born population - Nepal (%)
Place of birth for the foreign-born population - Pakistan (%)
Place of birth for the foreign-born population - Sri Lanka (%)
Place of birth for the foreign-born population - Uzbekistan (%)
Place of birth for the foreign-born population - Other South Central Asia (%)
Place of birth for the foreign-born population - Burma (%)
Place of birth for the foreign-born population - Cambodia (%)
Place of birth for the foreign-born population - Indonesia (%)
Place of birth for the foreign-born population - Laos (%)
Place of birth for the foreign-born population - Malaysia (%)
Place of birth for the foreign-born population - Philippines (%)
Place of birth for the foreign-born population - Singapore (%)
Place of birth for the foreign-born population - Thailand (%)
Place of birth for the foreign-born population - Vietnam (%)
Place of birth for the foreign-born population - Other South Eastern Asia (%)
Place of birth for the foreign-born population - Armenia (%)
Place of birth for the foreign-born population - Iraq (%)
Place of birth for the foreign-born population - Israel (%)
Place of birth for the foreign-born population - Jordan (%)
Place of birth for the foreign-born population - Kuwait (%)
Place of birth for the foreign-born population - Lebanon (%)
Place of birth for the foreign-born population - Saudi Arabia (%)
Place of birth for the foreign-born population - Syria (%)
Place of birth for the foreign-born population - Turkey (%)
Place of birth for the foreign-born population - Yemen (%)
Place of birth for the foreign-born population - Other Western Asia (%)
Place of birth for the foreign-born population - Eritrea (%)
Place of birth for the foreign-born population - Ethiopia (%)
Place of birth for the foreign-born population - Kenya (%)
Place of birth for the foreign-born population - Somalia (%)
Place of birth for the foreign-born population - Uganda (%)
Place of birth for the foreign-born population - Zimbabwe (%)
Place of birth for the foreign-born population - Other Eastern Africa (%)
Place of birth for the foreign-born population - Cameroon (%)
Place of birth for the foreign-born population - Congo (%)
Place of birth for the foreign-born population - Democratic Republic of Congo (Zaire) (%)
Place of birth for the foreign-born population - Other Middle Africa (%)
Place of birth for the foreign-born population - Egypt (%)
Place of birth for the foreign-born population - Morocco (%)
Place of birth for the foreign-born population - Sudan (%)
Place of birth for the foreign-born population - Other Northern Africa (%)
Place of birth for the foreign-born population - South Africa (%)
Place of birth for the foreign-born population - Other Southern Africa (%)
Place of birth for the foreign-born population - Cabo Verde (%)
Place of birth for the foreign-born population - Ghana (%)
Place of birth for the foreign-born population - Liberia (%)
Place of birth for the foreign-born population - Nigeria (%)
Place of birth for the foreign-born population - Senegal (%)
Place of birth for the foreign-born population - Sierra Leone (%)
Place of birth for the foreign-born population - Other Western Africa (%)
Place of birth for the foreign-born population - Australia (%)
Place of birth for the foreign-born population - New Zealand (%)
Place of birth for the foreign-born population - Fiji (%)
Place of birth for the foreign-born population - Micronesia (%)
Place of birth for the foreign-born population - Bahamas (%)
Place of birth for the foreign-born population - Barbados (%)
Place of birth for the foreign-born population - Cuba (%)
Place of birth for the foreign-born population - Dominica (%)
Place of birth for the foreign-born population - Dominican Republic (%)
Place of birth for the foreign-born population - Grenada (%)
Place of birth for the foreign-born population - Haiti (%)
Place of birth for the foreign-born population - Jamaica (%)
Place of birth for the foreign-born population - St. Vincent and the Grenadines (%)
Place of birth for the foreign-born population - Trinidad and Tobago (%)
Place of birth for the foreign-born population - West Indies (%)
Place of birth for the foreign-born population - Other Caribbean (%)
Place of birth for the foreign-born population - Belize (%)
Place of birth for the foreign-born population - Costa Rica (%)
Place of birth for the foreign-born population - El Salvador (%)
Place of birth for the foreign-born population - Guatemala (%)
Place of birth for the foreign-born population - Honduras (%)
Place of birth for the foreign-born population - Mexico (%)
Place of birth for the foreign-born population - Nicaragua (%)
Place of birth for the foreign-born population - Panama (%)
Place of birth for the foreign-born population - Other Central America (%)
Place of birth for the foreign-born population - Argentina (%)
Place of birth for the foreign-born population - Bolivia (%)
Place of birth for the foreign-born population - Brazil (%)
Place of birth for the foreign-born population - Chile (%)
Place of birth for the foreign-born population - Colombia (%)
Place of birth for the foreign-born population - Ecuador (%)
Place of birth for the foreign-born population - Guyana (%)
Place of birth for the foreign-born population - Peru (%)
Place of birth for the foreign-born population - Uruguay (%)
Place of birth for the foreign-born population - Venezuela (%)
Place of birth for the foreign-born population - Other South America (%)
Place of birth for the foreign-born population - Canada (%)
Place of birth for the foreign-born population - Other Northern America (%)
Place of birth for the foreign-born population - Other (%)
Latest news about races in Hutchinson, KS collected exclusively by city-data.com from local newspapers, TV, and radio stations
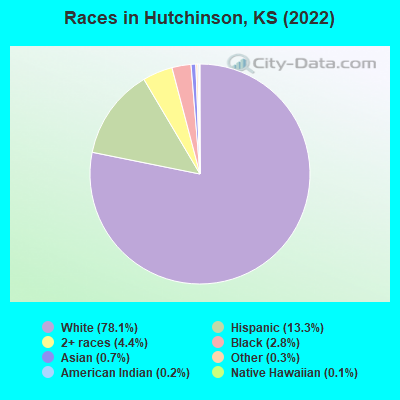
According to 2022 data, the most numerous races in Hutchinson, KS are White alone (31,242 residents), Hispanic (5,323 residents), and Black alone (1,116 residents). 94.6% of Hutchinson residents speak English at home. 2.5% of Hutchinson, KS residents are foreign-born (1.6% born in Latin America, 0.5% born in Asia, 0.3% born in Europe), which is 178.1% less than the foreign-born rate of 7.0% across the entire state of Kansas.
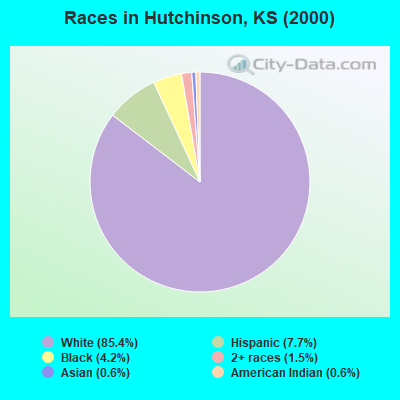
Race distribution in Hutchinson
2000 2022
2,233,997 83.1% White alone 188,252 7.0% Hispanic 151,407 5.6% Black alone 46,301 1.7% Asian alone 42,508 1.6% Two or more races 22,322 0.8% American Indian alone 2,477 0.09% Other race alone 1,154 0.04% Native Hawaiian and Other
2,147,943 73.1% White alone 381,746 13.0% Hispanic 147,666 5.0% Black alone 145,362 4.9% Two or more races 85,085 2.9% Asian alone 13,263 0.5% Other race alone 12,065 0.4% American Indian alone 4,020 0.1% Native Hawaiian and Other
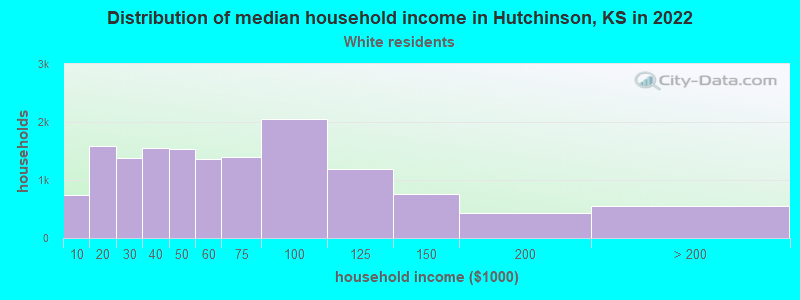
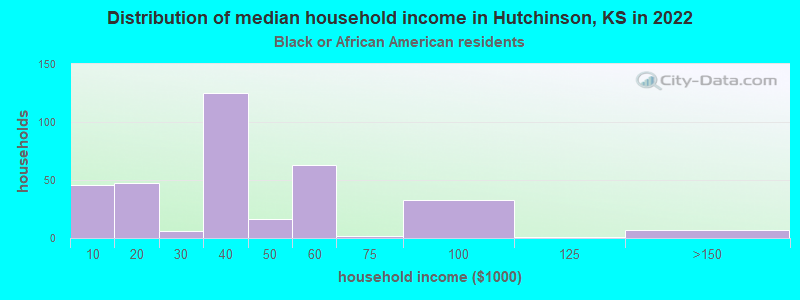
Income and house value in Hutchinson Median household income in 2022 $53,165 White non-Hispanic householders$39,279 Black householders$67,152 Some other race householders$78,789 Two or more races householders$74,527 Hispanic or Latino race householdersMedian 2022 house value $134,819 White Non-Hispanic householders$88,190 Black or African American householders$127,723 American Indian or Alaska Native householders $117,586 Asian householders$240,850 Native Hawaiian and other Pacific Islander householders$82,716 Some other race householders$73,593 Two or more races householders$85,554 Hispanic or Latino householders
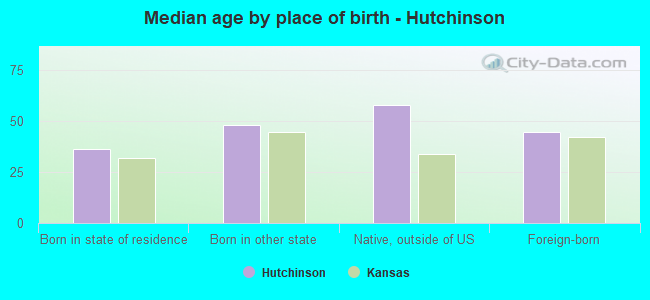
Median age by race in Hutchinson
40.9 Median age for White residents38.7 42.2 39.9 Median age for Black or African American residents39.0 59.3 44.2 Median age for American Indian / Alaska Native residents46.3 39.0 27.5 Median age for Asian residents49.9 22.9 -627,039,626.4 Median age for Native Hawaiian / Pacific Islander residents-669,240,668.6 -641,269,840.6 40.7 Median age for Other race residents41.7 23.3 24.7 Median age for Two or more races residents24.0 25.4 41.5 Median age for White alone residents39.0 44.2 28.7 Median age for Hispanic or Latino residents27.8 30.0
Owner/renter occupied households by race in Hutchinson
House owners and renters - White residents 9,371 64.9% Owner occupied5,066 35.1% Renter occupiedHouse owners and renters - Black or African American residents 216 63.8% Owner occupied123 36.2% Renter occupiedHouse owners and renters - American Indian / Alaska Native residents 81 50.1% Owner occupied81 49.9% Renter occupiedHouse owners and renters - Asian residents 60 67.2% Owner occupied29 32.8% Renter occupiedHouse owners and renters - Other race residents 157 39.3% Owner occupied242 60.7% Renter occupiedHouse owners and renters - Two or more races residents 762 80.9% Owner occupied180 19.1% Renter occupiedHouse owners and renters - White alone residents 8,784 64.2% Owner occupied4,899 35.8% Renter occupiedHouse owners and renters - Hispanic or Latino residents 1,314 66.8% Owner occupied653 33.2% Renter occupied
Language usage in Hutchinson
English speakers - Total 94.6% of residents of Hutchinson speak English at home.
4.4% of residents speak Spanish at home 1,111 67.3% Speak English very well541 32.7% Speak English less than very well1.1% of residents speak other language at home 370 86.7% Speak English very well57 13.3% Speak English less than very well
English speakers - Born in the United States 92.9% of residents of Hutchinson speak English at home.
5.7% of residents speak Spanish at home 486 96.4% Speak English very well18 3.6% Speak English less than very well1.4% of residents speak other language at home 118 92.2% Speak English very well10 7.8% Speak English less than very well
English speakers - Native, born elsewhere 96.9% of residents of Hutchinson speak English at home.
2.7% of residents speak Spanish at home 7 100.0% Speak English less than very well3.1% of residents speak other language at home 8 100.0% Speak English very well
English speakers - Foreign-born 23.1% of residents of Hutchinson speak English at home.
53.9% of residents speak Spanish at home 163 30.6% Speak English very well370 69.4% Speak English less than very well23.7% of residents speak other language at home 187 79.9% Speak English very well47 20.1% Speak English less than very well
White (Caucasian) - Speak only English Native:
99.5% (31,184)Foreign-born:
39.5% (101)
White (Caucasian) - Speak another language Native:
1.1% (352)Foreign-born:
63.8% (163)
Black or African American - Speak only English Native:
97.7% (1,070)Foreign-born:
100.0% (14)
American Indian / Alaska Native - Speak another language Native:
14.7% (52)Foreign-born:
100.0% (17)
Asian - Speak only English Native:
83.9% (47)Foreign-born:
39.1% (73)
Asian - Speak another language Native:
21.6% (12)Foreign-born:
59.8% (111)
Other race - Speak another language Native:
34.1% (195)Foreign-born:
96.6% (227)
Two or more races - Speak only English Native:
76.2% (2,640)Foreign-born:
4.9% (11)
Two or more races - Speak another language Native:
25.1% (870)Foreign-born:
95.6% (218)
White alone - Speak only English Native:
99.4% (29,537)Foreign-born:
52.6% (71)
White alone - Speak another language Native:
0.7% (214)Foreign-born:
45.8% (62)
Hispanic or Latino - Speak only English Native:
77.4% (3,343)Foreign-born:
9.8% (62)
Hispanic or Latino - Speak another language Native:
22.9% (988)Foreign-born:
90.7% (574)
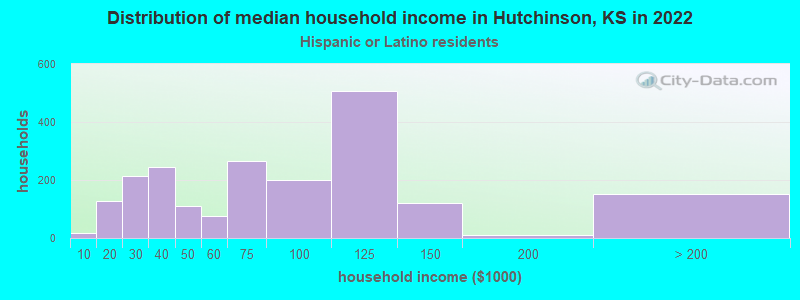
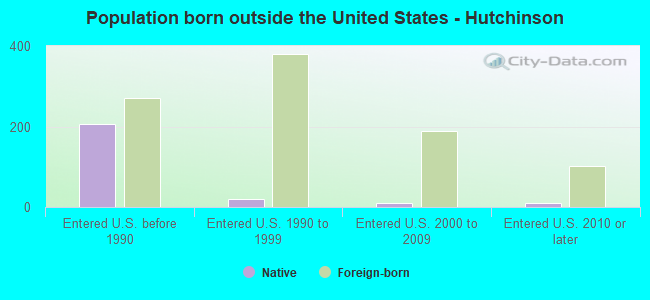
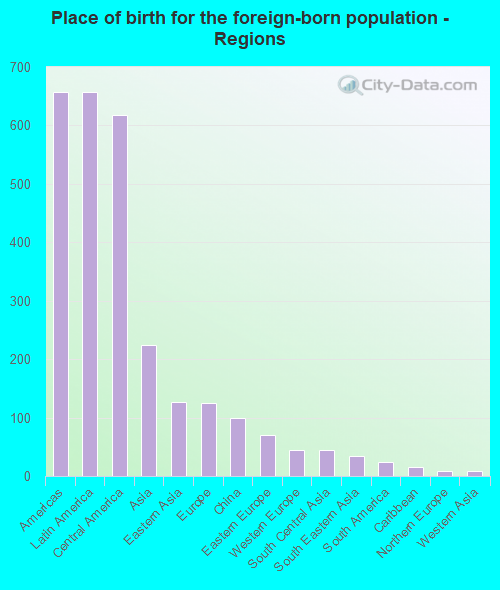
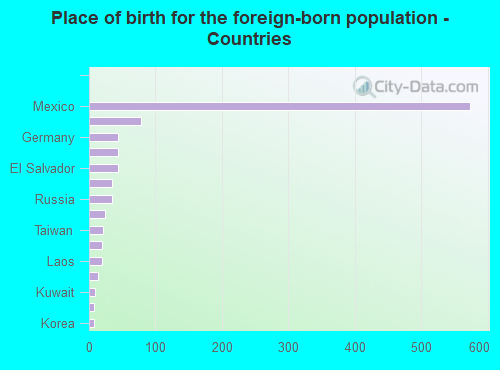
Foreign-born residents in Hutchinson 1,007 residents are foreign born (1.6% Latin America , 0.5% Asia , 0.3% Europe ).
This city:
2.5%Kansas:
7.1%
Marital status for residents in Hutchinson Marital status - White (Caucasian) population 15 years and over
Males 33.2% Never married47.0% Now married0.9% Separated3.5% Widowed15.3% DivorcedFemales 24.7% Never married44.8% Now married2.4% Separated11.9% Widowed16.2% DivorcedWomen who gave birth in the past 12 months Now married:
27.5% (104)Unmarried:
72.5% (273)
Women who did not give birth in the past 12 months Now married:
43.6% (3,014)Unmarried:
56.4% (3,903)
Marital status - Black or African American population 15 years and over
Males 61.7% Never married12.0% Now married8.0% Separated1.3% Widowed17.0% DivorcedFemales 34.5% Never married10.9% Now married0.0% Separated25.2% Widowed29.5% DivorcedWomen who gave birth in the past 12 months Now married:
0.0% (0)Unmarried:
100.0% (52)
Women who did not give birth in the past 12 months Now married:
0.0% (0)Unmarried:
100.0% (39)
Marital status - American Indian / Alaska Native population 15 years and over
Males 56.9% Never married28.4% Now married3.4% Separated3.4% Widowed7.8% DivorcedFemales 37.5% Never married19.4% Now married0.0% Separated0.0% Widowed43.1% DivorcedWomen who did not give birth in the past 12 months Now married:
33.3% (31)Unmarried:
66.7% (61)
Marital status - Asian population 15 years and over
Males 20.4% Never married45.4% Now married0.0% Separated0.0% Widowed34.3% DivorcedFemales 24.2% Never married75.0% Now married0.0% Separated0.0% Widowed0.8% DivorcedWomen who gave birth in the past 12 months Now married:
100.0% (30)Unmarried:
0.0% (0)
Women who did not give birth in the past 12 months Now married:
21.1% (8)Unmarried:
78.9% (30)
Marital status - Native Hawaiian / Pacific Islander population 15 years and over
Males 100.0% Never married0.0% Now married0.0% Separated0.0% Widowed0.0% DivorcedFemales 0.0% Never married0.0% Now married0.0% Separated100.0% Widowed0.0% DivorcedMarital status - Other race population 15 years and over
Males 1.6% Never married67.8% Now married0.4% Separated4.3% Widowed26.0% DivorcedFemales 32.5% Never married35.8% Now married0.0% Separated7.0% Widowed24.8% DivorcedWomen who did not give birth in the past 12 months Now married:
33.9% (107)Unmarried:
66.1% (209)
Marital status - Two or more races population 15 years and over
Males 59.6% Never married25.5% Now married1.7% Separated1.4% Widowed11.7% DivorcedFemales 32.9% Never married26.5% Now married7.6% Separated6.1% Widowed26.8% DivorcedWomen who gave birth in the past 12 months Now married:
0.0% (0)Unmarried:
100.0% (116)
Women who did not give birth in the past 12 months Now married:
40.8% (358)Unmarried:
59.2% (521)
Marital status - White alone, not Hispanic / Latino population 15 years and over
Males 32.4% Never married47.8% Now married1.0% Separated3.7% Widowed15.1% DivorcedFemales 24.5% Never married45.8% Now married2.0% Separated12.4% Widowed15.3% DivorcedWomen who gave birth in the past 12 months Now married:
27.5% (107)Unmarried:
72.5% (282)
Women who did not give birth in the past 12 months Now married:
45.0% (2,833)Unmarried:
55.0% (3,460)
Marital status - Hispanic or Latino population 15 years and over
Males 43.1% Never married38.2% Now married0.9% Separated0.6% Widowed17.2% DivorcedFemales 30.0% Never married25.1% Now married7.5% Separated6.5% Widowed30.9% DivorcedWomen who gave birth in the past 12 months Now married:
0.0% (0)Unmarried:
100.0% (93)
Women who did not give birth in the past 12 months Now married:
33.1% (524)Unmarried:
66.9% (1,058)
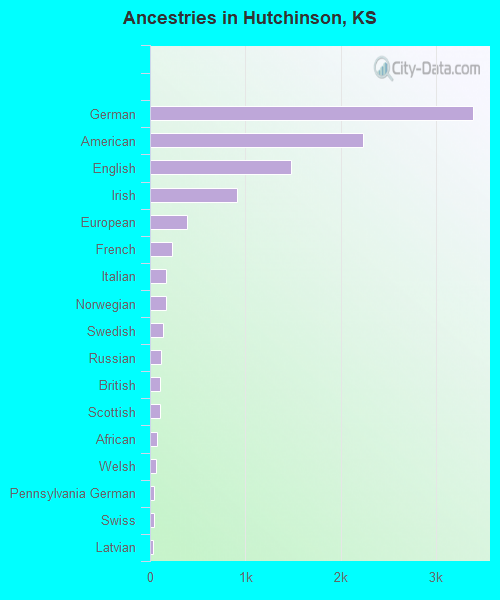
Ancestries in Hutchinson
3,389 22.4% German2,240 14.8% American1,475 9.7% English918 6.1% Irish390 2.6% European229 1.5% French170 1.1% Italian165 1.1% Norwegian135 0.9% Swedish119 0.8% Russian101 0.7% British100 0.7% Scottish70 0.5% African68 0.4% Welsh41 0.3% Pennsylvania German37 0.2% Swiss35 0.2% Latvian29 0.2% Dutch27 0.2% Moroccan27 0.2% Cajun26 0.2% Danish25 0.2% Portuguese25 0.2% Scotch-Irish15 0.10% Polish14 0.09% Hungarian12 0.08% Palestinian12 0.08% Northern European11 0.07% French Canadian9 0.06% Scandinavian8 0.05% Czech6 0.04% Greek
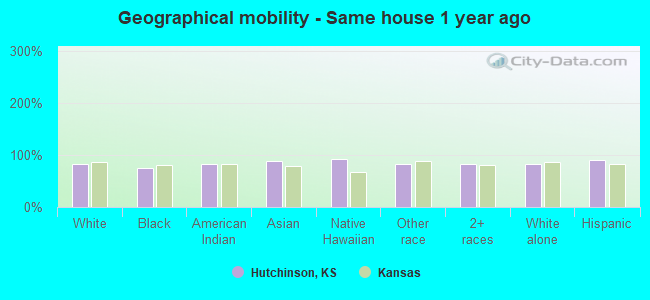
Geographical mobility in Hutchinson Same house 1 year ago 27,177 83.2% White (Caucasian)860 76.1% Black or African American343 82.5% American Indian / Alaska Native228 89.6% Asian35 92.6% Native Hawaiian / Pacific Islander717 83.4% Other race3,287 82.0% Two or more races25,618 82.5% White alone, not Hispanic / Latino4,684 89.8% Hispanic or LatinoMoved within same county 2,689 8.2% White / Caucasian84 7.5% Black or African American5 1.3% American Indian / Alaska Native10 4.1% Asian102 11.9% Other race475 11.8% Two or more races2,679 8.6% White alone, not Hispanic / Latino299 5.7% Hispanic or LatinoMoved within same state 1,865 5.7% White / Caucasian202 17.9% Black or African American55 13.1% American Indian / Alaska Native8 3.2% Asian23 2.7% Other race176 4.4% Two or more races1,885 6.1% White alone, not Hispanic / Latino160 3.1% Hispanic or LatinoMoved from different state 712 2.2% White / Caucasian23 2.0% Black or African American12 3.0% American Indian / Alaska Native3 8.3% Native Hawaiian / Pacific Islander6 0.8% Other race60 1.5% Two or more races649 2.1% White alone, not Hispanic / Latino91 1.7% Hispanic or LatinoMoved from abroad 112 0.3% White5 1.8% Asian14 0.3% Two or more races123 0.4% White alone, not Hispanic / Latino6 0.1% Hispanic or Latino
Children Nativity (place of birth) in Hutchinson
Children under 6 years - Living with two parents Both parents native 889 100.0% NativeBoth parents foreign-born 20 100.0% NativeOne native, one foreign-born parent 68 100.0% NativeChildren under 6 years - Living with one parent Native parent 1,116 100.0% NativeForeign-born parent 43 100.0% NativeChildren 6 to 17 years - Living with two parents Both parents native 3,599 100.0% NativeBoth parents foreign-born 90 100.0% NativeOne native, one foreign-born parent 350 100.0% NativeChildren 6 to 17 years - Living with one parent Native parent 1,771 100.0% NativeForeign-born parent 161 50.2% Native160 49.8% Foreign-born
Grandparents responsible for own grandchildren in Hutchinson
Grandparents (30 to 59 years) White / Caucasian 67 74.1% Responsible for grandchildren23 25.9% Not responsible for grandchildrenAsian 15 100.0% Responsible for grandchildrenTwo or more races 21 100.0% Not responsible for grandchildrenWhite alone, not Hispanic / Latino 70 73.7% Responsible for grandchildren25 26.3% Not responsible for grandchildrenGrandparents (60 years and over) White / Caucasian 86 72.2% Responsible for grandchildren33 27.8% Not responsible for grandchildrenTwo or more races 102 100.0% Not responsible for grandchildrenWhite alone, not Hispanic / Latino 88 70.9% Responsible for grandchildren36 29.1% Not responsible for grandchildren