Races in Horrell Hill, South Carolina (SC) Detailed Stats
Ancestries, Foreign-born residents, place of birth
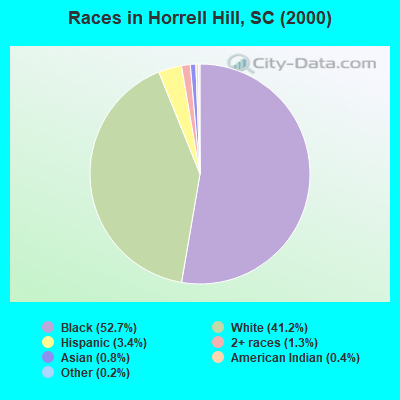
Race distribution in Horrell Hill

- 6,02852.7%Black alone
- 4,70841.2%White alone
- 3923.4%Hispanic
- 1481.3%Two or more races
- 930.8%Asian alone
- 420.4%American Indian alone
- 200.2%Other race alone
- 80.07%Native Hawaiian and Other
Pacific Islander alone
2000
2022
-
- 2,652,29166.1%White alone
- 1,178,48629.4%Black alone
- 95,0762.4%Hispanic
- 35,5680.9%Asian alone
- 33,2900.8%Two or more races
- 12,7650.3%American Indian alone
- 3,2660.08%Other race alone
- 1,2700.03%Native Hawaiian and Other
Pacific Islander alone

-
- 3,301,73962.5%White alone
- 1,313,29024.9%Black alone
- 343,7836.5%Hispanic
- 190,5083.6%Two or more races
- 89,8881.7%Asian alone
- 29,3900.6%Other race alone
- 12,1120.2%American Indian alone
- 1,9240.04%Native Hawaiian and Other
Pacific Islander alone

Income and house value in Horrell Hill
- Median household income in 2022
- $71,727White non-Hispanic householders
- $63,381Black householders
- $24,415American Indian and Alaska Native householders
- $80,390Asian householders
- $42,991Some other race householders
- $50,947Two or more races householders
- $50,947Hispanic or Latino race householders
- Median 2022 house value
- $214,007White Non-Hispanic householders
- $183,026Black or African American householders
- $154,905American Indian or Alaska Native householders
- $181,120Asian householders
- $177,068Some other race householders
- $242,128Two or more races householders
- $164,914Hispanic or Latino householders
Household income for White non-Hispanic householders

Household income for Black householders

Household income for American Indian and Alaska Native householders

Household income for Asian householders

Household income for Two or more races householders

Household income for Hispanic or Latino race householders

Zip code: 29061