Races in Hockessin, Delaware (DE) Detailed Stats
Data:
Races - White alone (%)
Races - White alone (% change since 2000)
Races - Black alone (%)
Races - Black alone (% change since 2000)
Races - American Indian alone (%)
Races - American Indian alone (% change since 2000)
Races - Asian alone (%)
Races - Asian alone (% change since 2000)
Races - Hispanic (%)
Races - Hispanic (% change since 2000)
Races - Native Hawaiian and Other Pacific Islander alone (%)
Races - Native Hawaiian and Other Pacific Islander alone (% change since 2000)
Races - Two or more races(%)
Races - Two or more races(% change since 2000)
Races - Other race alone (%)
Races - Other race alone (% change since 2000)
Racial diversity
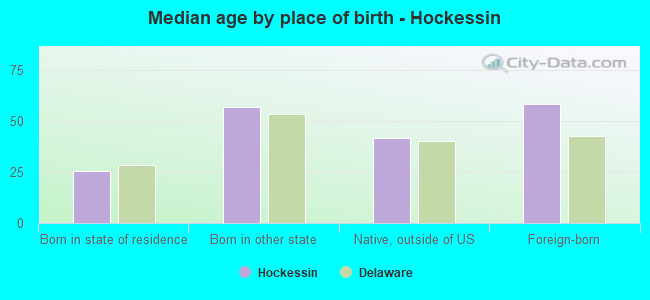
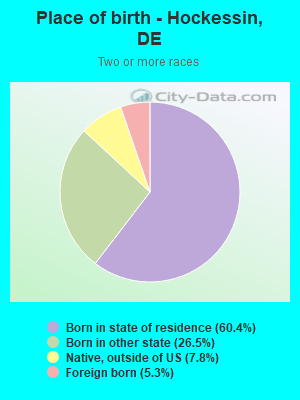
Place of birth - Born in state of residence (%)
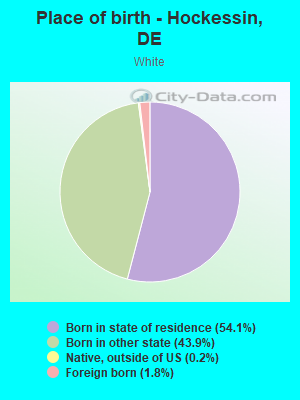
Place of birth - Born in state of residence (%) - White
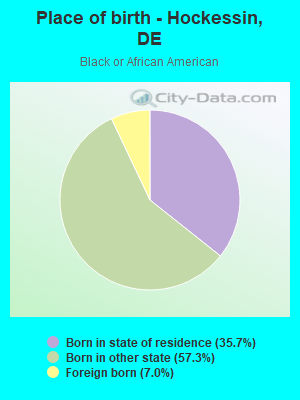
Place of birth - Born in state of residence (%) - Black or African American
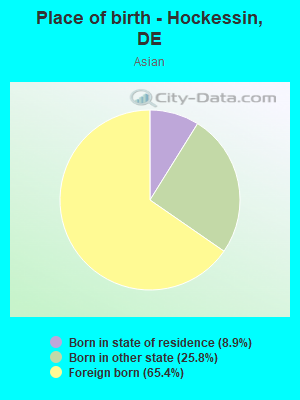
Place of birth - Born in state of residence (%) - Asian
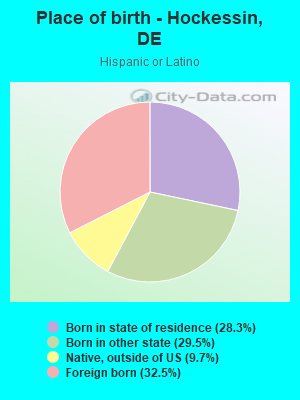
Place of birth - Born in state of residence (%) - Hispanic or Latino
Place of birth - Born in state of residence (%) - American Indian and Alaska Native
Place of birth - Born in state of residence (%) - Multirace
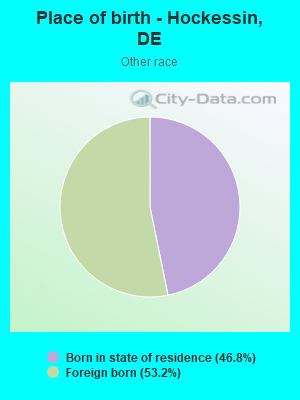
Place of birth - Born in state of residence (%) - Other Race
Place of birth - Born in other state (%)
Place of birth - Born in other state (%) - White
Place of birth - Born in other state (%) - Black or African American
Place of birth - Born in other state (%) - Asian
Place of birth - Born in other state (%) - Hispanic or Latino
Place of birth - Born in other state (%) - American Indian and Alaska Native
Place of birth - Born in other state (%) - Multirace
Place of birth - Born in other state (%) - Other Race
Place of birth - Native, outside of US (%)
Place of birth - Native, outside of US (%) - White
Place of birth - Native, outside of US (%) - Black or African American
Place of birth - Native, outside of US (%) - Asian
Place of birth - Native, outside of US (%) - Hispanic or Latino
Place of birth - Native, outside of US (%) - American Indian and Alaska Native
Place of birth - Native, outside of US (%) - Multirace
Place of birth - Native, outside of US (%) - Other Race
Place of birth - Foreign born (%)
Place of birth - Foreign born (%) - White
Place of birth - Foreign born (%) - Black or African American
Place of birth - Foreign born (%) - Asian
Place of birth - Foreign born (%) - Hispanic or Latino
Place of birth - Foreign born (%) - American Indian and Alaska Native
Place of birth - Foreign born (%) - Multirace
Place of birth - Foreign born (%) - Other Race
Residents speaking English at home (%)
Residents speaking English at home - Born in the United States (%)
Residents speaking English at home - Native, born elsewhere (%)
Residents speaking English at home - Foreign born (%)
Residents speaking Spanish at home (%)
Residents speaking Spanish at home - Born in the United States (%)
Residents speaking Spanish at home - Native, born elsewhere (%)
Residents speaking Spanish at home - Foreign born (%)
Residents speaking other language at home (%)
Residents speaking other language at home - Born in the United States (%)
Residents speaking other language at home - Native, born elsewhere (%)
Residents speaking other language at home - Foreign born (%)
Marital status - Never married (%)
Marital status - Now married (%)
Marital status - Separated (%)
Marital status - Widowed (%)
Marital status - Divorced (%)
Ancestries Reported - Arab (%)
Ancestries Reported - Czech (%)
Ancestries Reported - Danish (%)
Ancestries Reported - Dutch (%)
Ancestries Reported - English (%)
Ancestries Reported - French (%)
Ancestries Reported - French Canadian (%)
Ancestries Reported - German (%)
Ancestries Reported - Greek (%)
Ancestries Reported - Hungarian (%)
Ancestries Reported - Irish (%)
Ancestries Reported - Italian (%)
Ancestries Reported - Lithuanian (%)
Ancestries Reported - Norwegian (%)
Ancestries Reported - Polish (%)
Ancestries Reported - Portuguese (%)
Ancestries Reported - Russian (%)
Ancestries Reported - Scotch-Irish (%)
Ancestries Reported - Scottish (%)
Ancestries Reported - Slovak (%)
Ancestries Reported - Subsaharan African (%)
Ancestries Reported - Swedish (%)
Ancestries Reported - Swiss (%)
Ancestries Reported - Ukrainian (%)
Ancestries Reported - United States (%)
Ancestries Reported - Welsh (%)
Ancestries Reported - West Indian (%)
Ancestries Reported - Other (%)
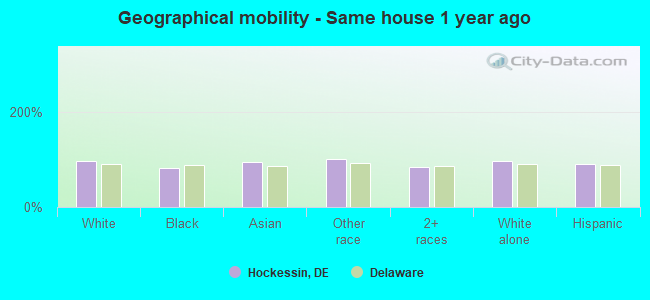
Geographical mobility - Same house 1 year ago (%)
Geographical mobility - Same house 1 year ago (%) - White
Geographical mobility - Same house 1 year ago (%) - Black or African American
Geographical mobility - Same house 1 year ago (%) - Asian
Geographical mobility - Same house 1 year ago (%) - Hispanic or Latino
Geographical mobility - Same house 1 year ago (%) - American Indian and Alaska Native
Geographical mobility - Same house 1 year ago (%) - Multirace
Geographical mobility - Same house 1 year ago (%) - Other Race
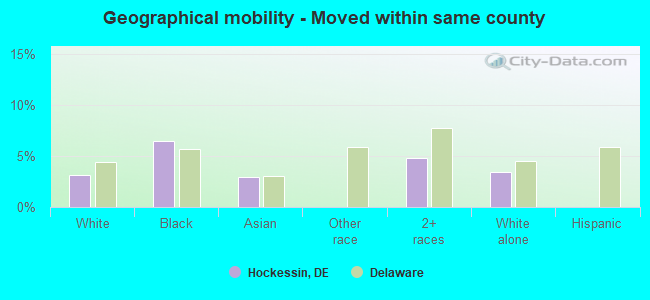
Geographical mobility - Moved within same county (%)
Geographical mobility - Moved within same county (%) - White
Geographical mobility - Moved within same county (%) - Black or African American
Geographical mobility - Moved within same county (%) - Asian
Geographical mobility - Moved within same county (%) - Hispanic or Latino
Geographical mobility - Moved within same county (%) - American Indian and Alaska Native
Geographical mobility - Moved within same county (%) - Multirace
Geographical mobility - Moved within same county (%) - Other Race
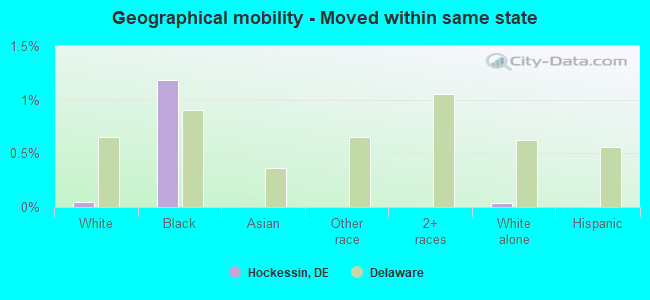
Geographical mobility - Moved from different county within same state (%)
Geographical mobility - Moved from different county within same state (%) - White
Geographical mobility - Moved from different county within same state (%) - Black or African American
Geographical mobility - Moved from different county within same state (%) - Asian
Geographical mobility - Moved from different county within same state (%) - Hispanic or Latino
Geographical mobility - Moved from different county within same state (%) - American Indian and Alaska Native
Geographical mobility - Moved from different county within same state (%) - Multirace
Geographical mobility - Moved from different county within same state (%) - Other Race
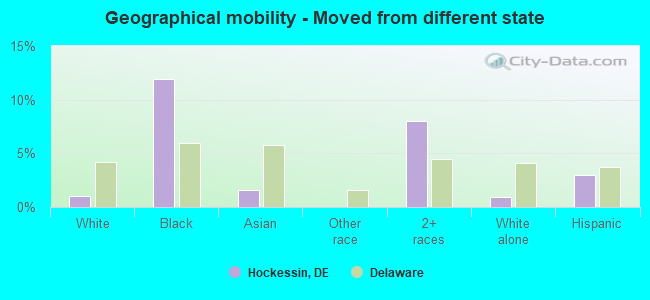
Geographical mobility - Moved from different state (%)
Geographical mobility - Moved from different state (%) - White
Geographical mobility - Moved from different state (%) - Black or African American
Geographical mobility - Moved from different state (%) - Asian
Geographical mobility - Moved from different state (%) - Hispanic or Latino
Geographical mobility - Moved from different state (%) - American Indian and Alaska Native
Geographical mobility - Moved from different state (%) - Multirace
Geographical mobility - Moved from different state (%) - Other Race
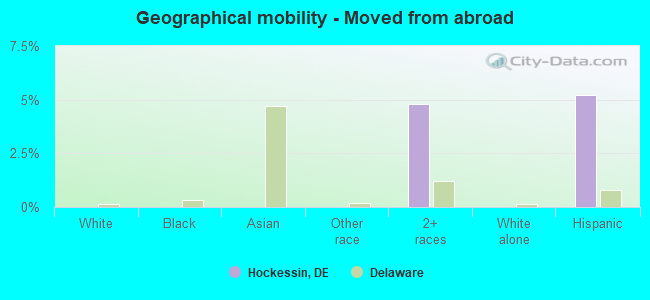
Geographical mobility - Moved from abroad (%)
Geographical mobility - Moved from abroad (%) - White
Geographical mobility - Moved from abroad (%) - Black or African American
Geographical mobility - Moved from abroad (%) - Asian
Geographical mobility - Moved from abroad (%) - Hispanic or Latino
Geographical mobility - Moved from abroad (%) - American Indian and Alaska Native
Geographical mobility - Moved from abroad (%) - Multirace
Geographical mobility - Moved from abroad (%) - Other Race
Place of birth for the foreign-born population - Ireland (%)
Place of birth for the foreign-born population - Denmark (%)
Place of birth for the foreign-born population - Norway (%)
Place of birth for the foreign-born population - Sweden (%)
Place of birth for the foreign-born population - United Kingdom (%)
Place of birth for the foreign-born population - England (%)
Place of birth for the foreign-born population - Scotland (%)
Place of birth for the foreign-born population - Other Northern Europe (%)
Place of birth for the foreign-born population - Austria (%)
Place of birth for the foreign-born population - Belgium (%)
Place of birth for the foreign-born population - France (%)
Place of birth for the foreign-born population - Germany (%)
Place of birth for the foreign-born population - Netherlands (%)
Place of birth for the foreign-born population - Switzerland (%)
Place of birth for the foreign-born population - Other Western Europe (%)
Place of birth for the foreign-born population - Greece (%)
Place of birth for the foreign-born population - Italy (%)
Place of birth for the foreign-born population - Portugal (%)
Place of birth for the foreign-born population - Spain (%)
Place of birth for the foreign-born population - Other Southern Europe (%)
Place of birth for the foreign-born population - Albania (%)
Place of birth for the foreign-born population - Belarus (%)
Place of birth for the foreign-born population - Bosnia and Herzegovina (%)
Place of birth for the foreign-born population - Bulgaria (%)
Place of birth for the foreign-born population - Croatia (%)
Place of birth for the foreign-born population - Czechoslovakia (%)
Place of birth for the foreign-born population - Hungary (%)
Place of birth for the foreign-born population - Latvia (%)
Place of birth for the foreign-born population - Lithuania (%)
Place of birth for the foreign-born population - North Macedonia (Macedonia) (%)
Place of birth for the foreign-born population - Moldova (%)
Place of birth for the foreign-born population - Poland (%)
Place of birth for the foreign-born population - Romania (%)
Place of birth for the foreign-born population - Russia (%)
Place of birth for the foreign-born population - Serbia (%)
Place of birth for the foreign-born population - Ukraine (%)
Place of birth for the foreign-born population - Other Eastern Europe (%)
Place of birth for the foreign-born population - China (%)
Place of birth for the foreign-born population - Hong Kong (%)
Place of birth for the foreign-born population - Taiwan (%)
Place of birth for the foreign-born population - Japan (%)
Place of birth for the foreign-born population - Korea (%)
Place of birth for the foreign-born population - Other Eastern Asia (%)
Place of birth for the foreign-born population - Afghanistan (%)
Place of birth for the foreign-born population - Bangladesh (%)
Place of birth for the foreign-born population - India (%)
Place of birth for the foreign-born population - Iran (%)
Place of birth for the foreign-born population - Kazakhstan (%)
Place of birth for the foreign-born population - Nepal (%)
Place of birth for the foreign-born population - Pakistan (%)
Place of birth for the foreign-born population - Sri Lanka (%)
Place of birth for the foreign-born population - Uzbekistan (%)
Place of birth for the foreign-born population - Other South Central Asia (%)
Place of birth for the foreign-born population - Burma (%)
Place of birth for the foreign-born population - Cambodia (%)
Place of birth for the foreign-born population - Indonesia (%)
Place of birth for the foreign-born population - Laos (%)
Place of birth for the foreign-born population - Malaysia (%)
Place of birth for the foreign-born population - Philippines (%)
Place of birth for the foreign-born population - Singapore (%)
Place of birth for the foreign-born population - Thailand (%)
Place of birth for the foreign-born population - Vietnam (%)
Place of birth for the foreign-born population - Other South Eastern Asia (%)
Place of birth for the foreign-born population - Armenia (%)
Place of birth for the foreign-born population - Iraq (%)
Place of birth for the foreign-born population - Israel (%)
Place of birth for the foreign-born population - Jordan (%)
Place of birth for the foreign-born population - Kuwait (%)
Place of birth for the foreign-born population - Lebanon (%)
Place of birth for the foreign-born population - Saudi Arabia (%)
Place of birth for the foreign-born population - Syria (%)
Place of birth for the foreign-born population - Turkey (%)
Place of birth for the foreign-born population - Yemen (%)
Place of birth for the foreign-born population - Other Western Asia (%)
Place of birth for the foreign-born population - Eritrea (%)
Place of birth for the foreign-born population - Ethiopia (%)
Place of birth for the foreign-born population - Kenya (%)
Place of birth for the foreign-born population - Somalia (%)
Place of birth for the foreign-born population - Uganda (%)
Place of birth for the foreign-born population - Zimbabwe (%)
Place of birth for the foreign-born population - Other Eastern Africa (%)
Place of birth for the foreign-born population - Cameroon (%)
Place of birth for the foreign-born population - Congo (%)
Place of birth for the foreign-born population - Democratic Republic of Congo (Zaire) (%)
Place of birth for the foreign-born population - Other Middle Africa (%)
Place of birth for the foreign-born population - Egypt (%)
Place of birth for the foreign-born population - Morocco (%)
Place of birth for the foreign-born population - Sudan (%)
Place of birth for the foreign-born population - Other Northern Africa (%)
Place of birth for the foreign-born population - South Africa (%)
Place of birth for the foreign-born population - Other Southern Africa (%)
Place of birth for the foreign-born population - Cabo Verde (%)
Place of birth for the foreign-born population - Ghana (%)
Place of birth for the foreign-born population - Liberia (%)
Place of birth for the foreign-born population - Nigeria (%)
Place of birth for the foreign-born population - Senegal (%)
Place of birth for the foreign-born population - Sierra Leone (%)
Place of birth for the foreign-born population - Other Western Africa (%)
Place of birth for the foreign-born population - Australia (%)
Place of birth for the foreign-born population - New Zealand (%)
Place of birth for the foreign-born population - Fiji (%)
Place of birth for the foreign-born population - Micronesia (%)
Place of birth for the foreign-born population - Bahamas (%)
Place of birth for the foreign-born population - Barbados (%)
Place of birth for the foreign-born population - Cuba (%)
Place of birth for the foreign-born population - Dominica (%)
Place of birth for the foreign-born population - Dominican Republic (%)
Place of birth for the foreign-born population - Grenada (%)
Place of birth for the foreign-born population - Haiti (%)
Place of birth for the foreign-born population - Jamaica (%)
Place of birth for the foreign-born population - St. Vincent and the Grenadines (%)
Place of birth for the foreign-born population - Trinidad and Tobago (%)
Place of birth for the foreign-born population - West Indies (%)
Place of birth for the foreign-born population - Other Caribbean (%)
Place of birth for the foreign-born population - Belize (%)
Place of birth for the foreign-born population - Costa Rica (%)
Place of birth for the foreign-born population - El Salvador (%)
Place of birth for the foreign-born population - Guatemala (%)
Place of birth for the foreign-born population - Honduras (%)
Place of birth for the foreign-born population - Mexico (%)
Place of birth for the foreign-born population - Nicaragua (%)
Place of birth for the foreign-born population - Panama (%)
Place of birth for the foreign-born population - Other Central America (%)
Place of birth for the foreign-born population - Argentina (%)
Place of birth for the foreign-born population - Bolivia (%)
Place of birth for the foreign-born population - Brazil (%)
Place of birth for the foreign-born population - Chile (%)
Place of birth for the foreign-born population - Colombia (%)
Place of birth for the foreign-born population - Ecuador (%)
Place of birth for the foreign-born population - Guyana (%)
Place of birth for the foreign-born population - Peru (%)
Place of birth for the foreign-born population - Uruguay (%)
Place of birth for the foreign-born population - Venezuela (%)
Place of birth for the foreign-born population - Other South America (%)
Place of birth for the foreign-born population - Canada (%)
Place of birth for the foreign-born population - Other Northern America (%)
Place of birth for the foreign-born population - Other (%)
Latest news about races in Hockessin, DE collected exclusively by city-data.com from local newspapers, TV, and radio stations
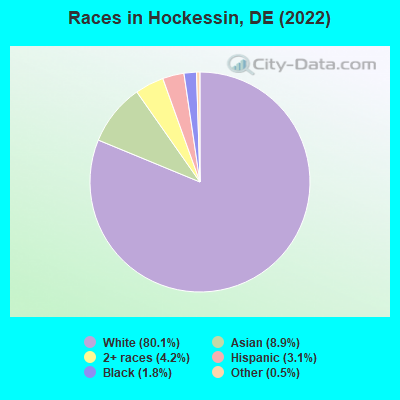
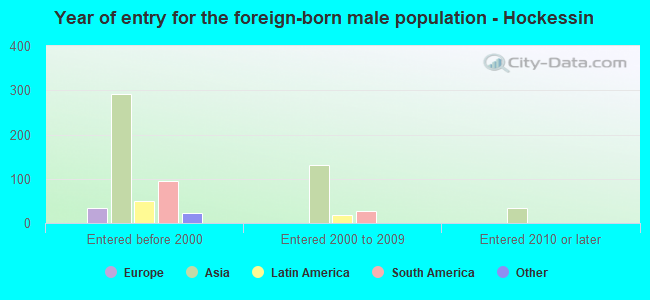
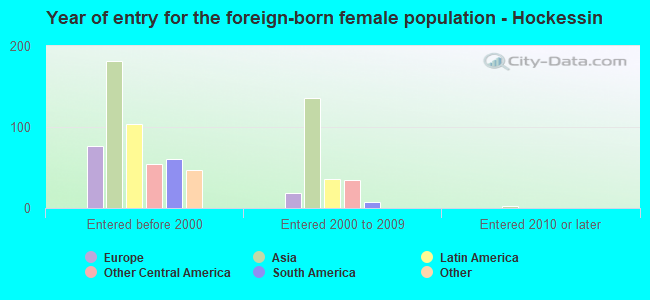
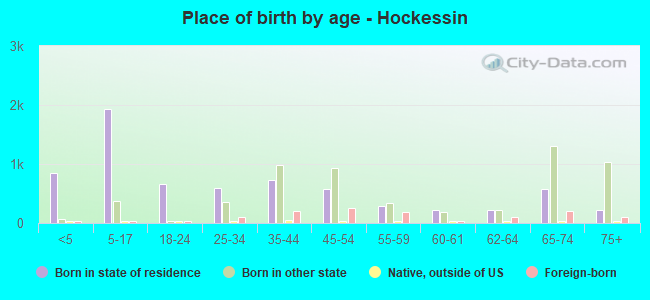
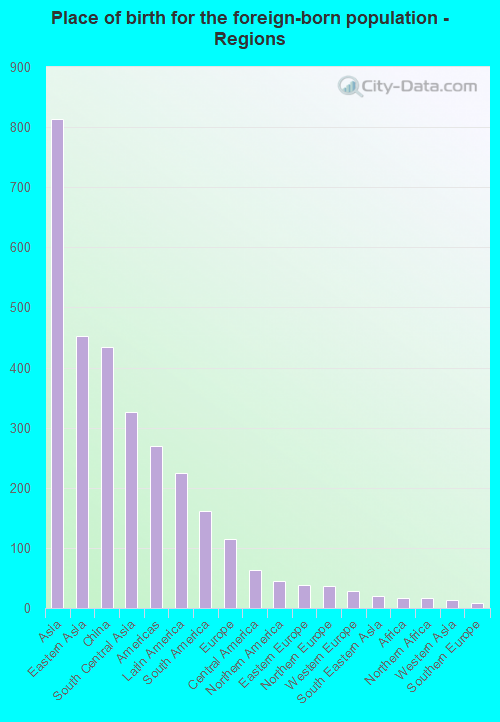
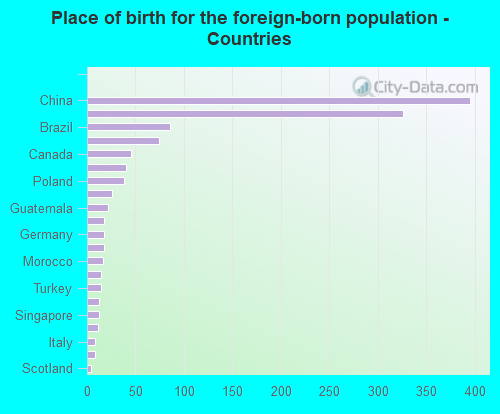
According to 2022 data, the most numerous races in Hockessin, DE are White alone (11,205 residents), Black alone (250 residents), and Hispanic (437 residents). 89.0% of Hockessin residents speak English at home. 8.7% of Hockessin, DE residents are foreign-born (5.7% born in Asia, 1.6% born in Latin America), which is 3.8% less than the foreign-born rate of 9.0% across the entire state of Delaware.
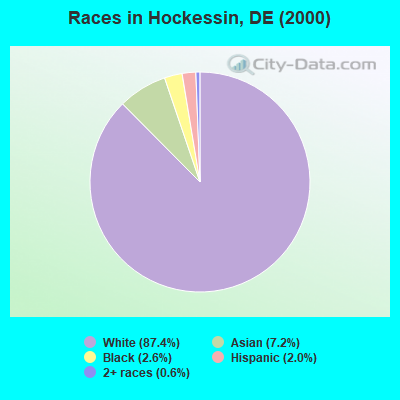
Race distribution in Hockessin
2000 2022
567,973 72.5% White alone 148,435 18.9% Black alone 37,277 4.8% Hispanic 16,110 2.1% Asian alone 10,222 1.3% Two or more races 2,324 0.3% American Indian alone 1,025 0.1% Other race alone 234 0.03% Native Hawaiian and Other
599,347 58.9% White alone 220,010 21.6% Black alone 105,300 10.3% Hispanic 46,016 4.5% Two or more races 41,350 4.1% Asian alone 5,097 0.5% Other race alone 1,276 0.1% American Indian alone
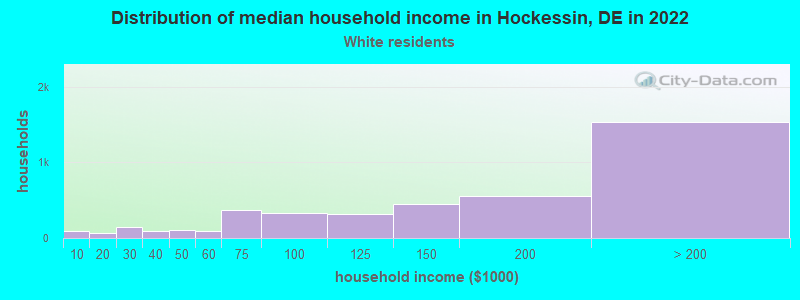
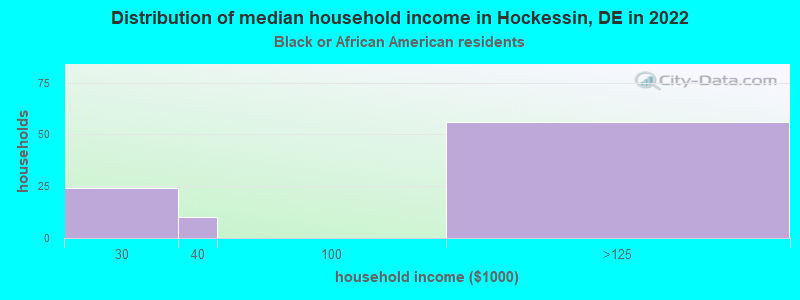
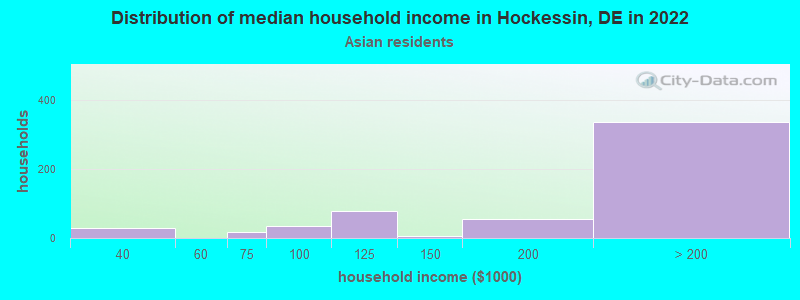
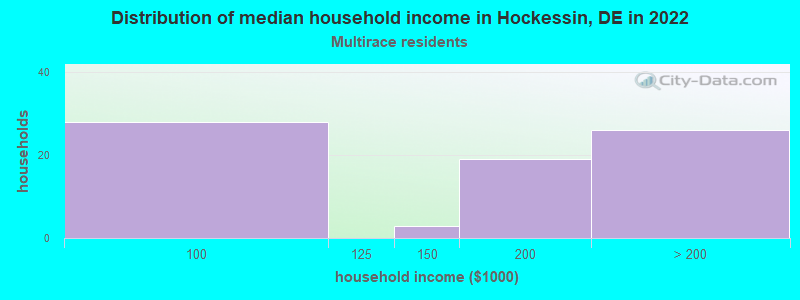
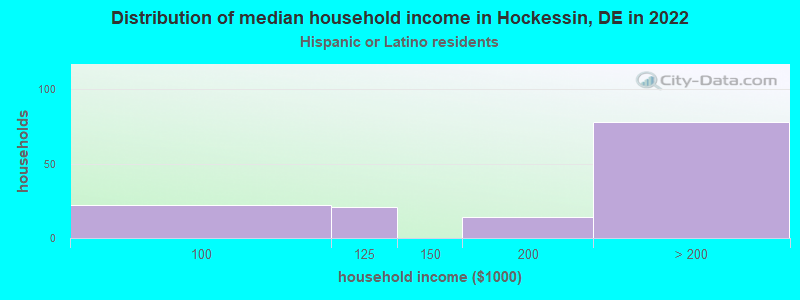
Income and house value in Hockessin Median household income in 2022 $155,164 White non-Hispanic householdersover $200,000 Asian householders$178,360 Two or more races householdersover $200,000 Hispanic or Latino race householdersMedian 2022 house value $587,949 White Non-Hispanic householders$482,504 Black or African American householders$264,788 American Indian or Alaska Native householders $664,679 Asian householders$470,735 Some other race householders$529,577 Hispanic or Latino householders
Median age by race in Hockessin
47.1 Median age for White residents49.6 45.7 74.3 Median age for Black or African American residents60.4 75.1 -592,964,823.5 Median age for American Indian / Alaska Native residents-639,393,938.8 -659,673,659.0 51.6 Median age for Asian residents52.3 51.4 -666,666,666.0 Median age for Native Hawaiian / Pacific Islander residents-668,724,279.2 -670,599,802.7 11.6 Median age for Other race residents-668,874,171.5 9.4 20.7 Median age for Two or more races residents14.8 38.0 46.1 Median age for White alone residents49.0 44.1 36.1 Median age for Hispanic or Latino residents12.1 42.6
Owner/renter occupied households by race in Hockessin
House owners and renters - White residents 3,956 92.4% Owner occupied325 7.6% Renter occupiedHouse owners and renters - Black or African American residents 61 73.4% Owner occupied22 26.6% Renter occupiedHouse owners and renters - Asian residents 484 95.3% Owner occupied24 4.7% Renter occupiedHouse owners and renters - Other race residents 17 100.0% Owner occupiedHouse owners and renters - Two or more races residents 69 100.0% Owner occupiedHouse owners and renters - White alone residents 3,966 91.8% Owner occupied353 8.2% Renter occupiedHouse owners and renters - Hispanic or Latino residents 129 100.0% Owner occupied
Language usage in Hockessin
English speakers - Total 89.0% of residents of Hockessin speak English at home.
1.6% of residents speak Spanish at home 204 100.0% Speak English very well9.8% of residents speak other language at home 1,052 82.1% Speak English very well230 17.9% Speak English less than very well
English speakers - Born in the United States 95.5% of residents of Hockessin speak English at home.
1.0% of residents speak Spanish at home 60 100.0% Speak English very well3.5% of residents speak other language at home 199 100.0% Speak English very well
English speakers - Native, born elsewhere 72.4% of residents of Hockessin speak English at home.
26.7% of residents speak Spanish at home 28 100.0% Speak English very well
English speakers - Foreign-born 20.1% of residents of Hockessin speak English at home.
8.9% of residents speak Spanish at home 109 100.0% Speak English very well72.9% of residents speak other language at home 688 77.0% Speak English very well206 23.0% Speak English less than very well
White (Caucasian) - Speak only English Native:
100.0% (10,000)Foreign-born:
50.8% (102)
White (Caucasian) - Speak another language Native:
1.1% (108)Foreign-born:
55.8% (112)
Black or African American - Speak only English Native:
100.0% (235)Foreign-born:
83.2% (15)
Asian - Speak only English Native:
49.7% (227)Foreign-born:
10.1% (81)
Asian - Speak another language Native:
46.3% (211)Foreign-born:
87.7% (705)
Two or more races - Speak another language Native:
10.0% (86)Foreign-born:
98.6% (56)
White alone - Speak only English Native:
98.8% (10,074)Foreign-born:
47.1% (108)
White alone - Speak another language Native:
1.3% (131)Foreign-born:
53.3% (122)
Hispanic or Latino - Speak only English Native:
56.2% (121)Foreign-born:
31.1% (45)
Hispanic or Latino - Speak another language Native:
45.0% (97)Foreign-born:
76.9% (111)
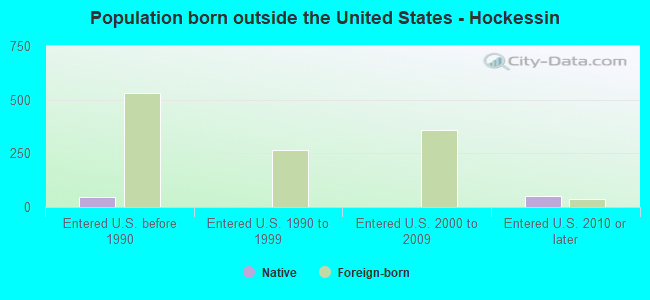
Foreign-born residents in Hockessin 1,214 residents are foreign born (5.7% Asia , 1.6% Latin America ).
This city:
8.7%Delaware:
9.8%
Marital status for residents in Hockessin Marital status - White (Caucasian) population 15 years and over
Males 20.8% Never married70.9% Now married0.0% Separated2.5% Widowed5.8% DivorcedFemales 22.6% Never married60.6% Now married0.4% Separated8.2% Widowed8.3% DivorcedWomen who gave birth in the past 12 months Now married:
84.5% (84)Unmarried:
15.5% (15)
Women who did not give birth in the past 12 months Now married:
47.6% (1,071)Unmarried:
52.4% (1,179)
Marital status - Black or African American population 15 years and over
Males 7.2% Never married41.2% Now married0.0% Separated37.9% Widowed13.7% DivorcedFemales 6.5% Never married4.3% Now married4.3% Separated62.0% Widowed22.8% DivorcedMarital status - Asian population 15 years and over
Males 16.1% Never married81.6% Now married0.0% Separated2.3% Widowed0.0% DivorcedFemales 23.8% Never married69.0% Now married0.0% Separated7.1% Widowed0.0% DivorcedWomen who did not give birth in the past 12 months Now married:
58.7% (173)Unmarried:
41.3% (122)
Marital status - Two or more races population 15 years and over
Males 67.1% Never married21.7% Now married0.0% Separated0.0% Widowed11.2% DivorcedFemales 30.6% Never married48.8% Now married6.2% Separated14.4% Widowed0.0% DivorcedWomen who gave birth in the past 12 months Now married:
0.0% (0)Unmarried:
100.0% (30)
Women who did not give birth in the past 12 months Now married:
66.9% (114)Unmarried:
33.1% (57)
Marital status - White alone, not Hispanic / Latino population 15 years and over
Males 20.5% Never married71.1% Now married0.0% Separated2.5% Widowed5.9% DivorcedFemales 22.9% Never married60.2% Now married0.4% Separated8.1% Widowed8.4% DivorcedWomen who gave birth in the past 12 months Now married:
84.5% (89)Unmarried:
15.5% (16)
Women who did not give birth in the past 12 months Now married:
47.2% (1,120)Unmarried:
52.8% (1,254)
Marital status - Hispanic or Latino population 15 years and over
Males 31.2% Never married32.5% Now married0.0% Separated0.0% Widowed36.4% DivorcedFemales 0.0% Never married87.7% Now married7.6% Separated4.7% Widowed0.0% DivorcedWomen who did not give birth in the past 12 months Now married:
100.0% (111)Unmarried:
0.0% (0)
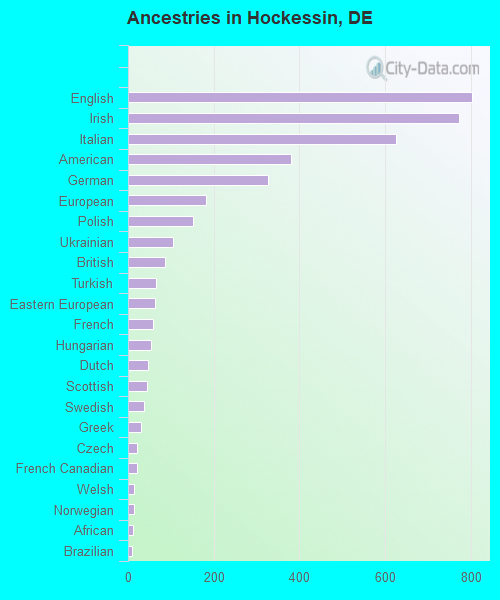
Ancestries in Hockessin
802 14.9% English771 14.3% Irish626 11.6% Italian381 7.1% American327 6.1% German181 3.4% European152 2.8% Polish104 1.9% Ukrainian86 1.6% British65 1.2% Turkish62 1.1% Eastern European59 1.1% French53 1.0% Hungarian46 0.9% Dutch44 0.8% Scottish37 0.7% Swedish30 0.6% Greek21 0.4% Czech21 0.4% French Canadian15 0.3% Welsh13 0.2% Norwegian11 0.2% African10 0.2% Brazilian
Children Nativity (place of birth) in Hockessin
Children under 6 years - Living with two parents Both parents native 712 100.0% NativeBoth parents foreign-born 21 84.7% Native4 15.3% Foreign-bornOne native, one foreign-born parent 155 100.0% NativeChildren under 6 years - Living with one parent Native parent 136 100.0% Native
Children 6 to 17 years - Living with two parents Both parents native 1,473 99.0% Native16 1.0% Foreign-bornBoth parents foreign-born 242 98.3% Native4 1.7% Foreign-bornOne native, one foreign-born parent 44 100.0% NativeChildren 6 to 17 years - Living with one parent Native parent 408 100.0% Native