Races in Henderson, Texas (TX) Detailed Stats
Data:
Races - White alone (%)
Races - White alone (% change since 2000)
Races - Black alone (%)
Races - Black alone (% change since 2000)
Races - American Indian alone (%)
Races - American Indian alone (% change since 2000)
Races - Asian alone (%)
Races - Asian alone (% change since 2000)
Races - Hispanic (%)
Races - Hispanic (% change since 2000)
Races - Native Hawaiian and Other Pacific Islander alone (%)
Races - Native Hawaiian and Other Pacific Islander alone (% change since 2000)
Races - Two or more races(%)
Races - Two or more races(% change since 2000)
Races - Other race alone (%)
Races - Other race alone (% change since 2000)
Racial diversity
Place of birth - Born in state of residence (%)
Place of birth - Born in state of residence (%) - White
Place of birth - Born in state of residence (%) - Black or African American
Place of birth - Born in state of residence (%) - Asian
Place of birth - Born in state of residence (%) - Hispanic or Latino
Place of birth - Born in state of residence (%) - American Indian and Alaska Native
Place of birth - Born in state of residence (%) - Multirace
Place of birth - Born in state of residence (%) - Other Race
Place of birth - Born in other state (%)
Place of birth - Born in other state (%) - White
Place of birth - Born in other state (%) - Black or African American
Place of birth - Born in other state (%) - Asian
Place of birth - Born in other state (%) - Hispanic or Latino
Place of birth - Born in other state (%) - American Indian and Alaska Native
Place of birth - Born in other state (%) - Multirace
Place of birth - Born in other state (%) - Other Race
Place of birth - Native, outside of US (%)
Place of birth - Native, outside of US (%) - White
Place of birth - Native, outside of US (%) - Black or African American
Place of birth - Native, outside of US (%) - Asian
Place of birth - Native, outside of US (%) - Hispanic or Latino
Place of birth - Native, outside of US (%) - American Indian and Alaska Native
Place of birth - Native, outside of US (%) - Multirace
Place of birth - Native, outside of US (%) - Other Race
Place of birth - Foreign born (%)
Place of birth - Foreign born (%) - White
Place of birth - Foreign born (%) - Black or African American
Place of birth - Foreign born (%) - Asian
Place of birth - Foreign born (%) - Hispanic or Latino
Place of birth - Foreign born (%) - American Indian and Alaska Native
Place of birth - Foreign born (%) - Multirace
Place of birth - Foreign born (%) - Other Race
Residents speaking English at home (%)
Residents speaking English at home - Born in the United States (%)
Residents speaking English at home - Native, born elsewhere (%)
Residents speaking English at home - Foreign born (%)
Residents speaking Spanish at home (%)
Residents speaking Spanish at home - Born in the United States (%)
Residents speaking Spanish at home - Native, born elsewhere (%)
Residents speaking Spanish at home - Foreign born (%)
Residents speaking other language at home (%)
Residents speaking other language at home - Born in the United States (%)
Residents speaking other language at home - Native, born elsewhere (%)
Residents speaking other language at home - Foreign born (%)
Marital status - Never married (%)
Marital status - Now married (%)
Marital status - Separated (%)
Marital status - Widowed (%)
Marital status - Divorced (%)
Ancestries Reported - Arab (%)
Ancestries Reported - Czech (%)
Ancestries Reported - Danish (%)
Ancestries Reported - Dutch (%)
Ancestries Reported - English (%)
Ancestries Reported - French (%)
Ancestries Reported - French Canadian (%)
Ancestries Reported - German (%)
Ancestries Reported - Greek (%)
Ancestries Reported - Hungarian (%)
Ancestries Reported - Irish (%)
Ancestries Reported - Italian (%)
Ancestries Reported - Lithuanian (%)
Ancestries Reported - Norwegian (%)
Ancestries Reported - Polish (%)
Ancestries Reported - Portuguese (%)
Ancestries Reported - Russian (%)
Ancestries Reported - Scotch-Irish (%)
Ancestries Reported - Scottish (%)
Ancestries Reported - Slovak (%)
Ancestries Reported - Subsaharan African (%)
Ancestries Reported - Swedish (%)
Ancestries Reported - Swiss (%)
Ancestries Reported - Ukrainian (%)
Ancestries Reported - United States (%)
Ancestries Reported - Welsh (%)
Ancestries Reported - West Indian (%)
Ancestries Reported - Other (%)
Geographical mobility - Same house 1 year ago (%)
Geographical mobility - Same house 1 year ago (%) - White
Geographical mobility - Same house 1 year ago (%) - Black or African American
Geographical mobility - Same house 1 year ago (%) - Asian
Geographical mobility - Same house 1 year ago (%) - Hispanic or Latino
Geographical mobility - Same house 1 year ago (%) - American Indian and Alaska Native
Geographical mobility - Same house 1 year ago (%) - Multirace
Geographical mobility - Same house 1 year ago (%) - Other Race
Geographical mobility - Moved within same county (%)
Geographical mobility - Moved within same county (%) - White
Geographical mobility - Moved within same county (%) - Black or African American
Geographical mobility - Moved within same county (%) - Asian
Geographical mobility - Moved within same county (%) - Hispanic or Latino
Geographical mobility - Moved within same county (%) - American Indian and Alaska Native
Geographical mobility - Moved within same county (%) - Multirace
Geographical mobility - Moved within same county (%) - Other Race
Geographical mobility - Moved from different county within same state (%)
Geographical mobility - Moved from different county within same state (%) - White
Geographical mobility - Moved from different county within same state (%) - Black or African American
Geographical mobility - Moved from different county within same state (%) - Asian
Geographical mobility - Moved from different county within same state (%) - Hispanic or Latino
Geographical mobility - Moved from different county within same state (%) - American Indian and Alaska Native
Geographical mobility - Moved from different county within same state (%) - Multirace
Geographical mobility - Moved from different county within same state (%) - Other Race
Geographical mobility - Moved from different state (%)
Geographical mobility - Moved from different state (%) - White
Geographical mobility - Moved from different state (%) - Black or African American
Geographical mobility - Moved from different state (%) - Asian
Geographical mobility - Moved from different state (%) - Hispanic or Latino
Geographical mobility - Moved from different state (%) - American Indian and Alaska Native
Geographical mobility - Moved from different state (%) - Multirace
Geographical mobility - Moved from different state (%) - Other Race
Geographical mobility - Moved from abroad (%)
Geographical mobility - Moved from abroad (%) - White
Geographical mobility - Moved from abroad (%) - Black or African American
Geographical mobility - Moved from abroad (%) - Asian
Geographical mobility - Moved from abroad (%) - Hispanic or Latino
Geographical mobility - Moved from abroad (%) - American Indian and Alaska Native
Geographical mobility - Moved from abroad (%) - Multirace
Geographical mobility - Moved from abroad (%) - Other Race
Place of birth for the foreign-born population - Ireland (%)
Place of birth for the foreign-born population - Denmark (%)
Place of birth for the foreign-born population - Norway (%)
Place of birth for the foreign-born population - Sweden (%)
Place of birth for the foreign-born population - United Kingdom (%)
Place of birth for the foreign-born population - England (%)
Place of birth for the foreign-born population - Scotland (%)
Place of birth for the foreign-born population - Other Northern Europe (%)
Place of birth for the foreign-born population - Austria (%)
Place of birth for the foreign-born population - Belgium (%)
Place of birth for the foreign-born population - France (%)
Place of birth for the foreign-born population - Germany (%)
Place of birth for the foreign-born population - Netherlands (%)
Place of birth for the foreign-born population - Switzerland (%)
Place of birth for the foreign-born population - Other Western Europe (%)
Place of birth for the foreign-born population - Greece (%)
Place of birth for the foreign-born population - Italy (%)
Place of birth for the foreign-born population - Portugal (%)
Place of birth for the foreign-born population - Spain (%)
Place of birth for the foreign-born population - Other Southern Europe (%)
Place of birth for the foreign-born population - Albania (%)
Place of birth for the foreign-born population - Belarus (%)
Place of birth for the foreign-born population - Bosnia and Herzegovina (%)
Place of birth for the foreign-born population - Bulgaria (%)
Place of birth for the foreign-born population - Croatia (%)
Place of birth for the foreign-born population - Czechoslovakia (%)
Place of birth for the foreign-born population - Hungary (%)
Place of birth for the foreign-born population - Latvia (%)
Place of birth for the foreign-born population - Lithuania (%)
Place of birth for the foreign-born population - North Macedonia (Macedonia) (%)
Place of birth for the foreign-born population - Moldova (%)
Place of birth for the foreign-born population - Poland (%)
Place of birth for the foreign-born population - Romania (%)
Place of birth for the foreign-born population - Russia (%)
Place of birth for the foreign-born population - Serbia (%)
Place of birth for the foreign-born population - Ukraine (%)
Place of birth for the foreign-born population - Other Eastern Europe (%)
Place of birth for the foreign-born population - China (%)
Place of birth for the foreign-born population - Hong Kong (%)
Place of birth for the foreign-born population - Taiwan (%)
Place of birth for the foreign-born population - Japan (%)
Place of birth for the foreign-born population - Korea (%)
Place of birth for the foreign-born population - Other Eastern Asia (%)
Place of birth for the foreign-born population - Afghanistan (%)
Place of birth for the foreign-born population - Bangladesh (%)
Place of birth for the foreign-born population - India (%)
Place of birth for the foreign-born population - Iran (%)
Place of birth for the foreign-born population - Kazakhstan (%)
Place of birth for the foreign-born population - Nepal (%)
Place of birth for the foreign-born population - Pakistan (%)
Place of birth for the foreign-born population - Sri Lanka (%)
Place of birth for the foreign-born population - Uzbekistan (%)
Place of birth for the foreign-born population - Other South Central Asia (%)
Place of birth for the foreign-born population - Burma (%)
Place of birth for the foreign-born population - Cambodia (%)
Place of birth for the foreign-born population - Indonesia (%)
Place of birth for the foreign-born population - Laos (%)
Place of birth for the foreign-born population - Malaysia (%)
Place of birth for the foreign-born population - Philippines (%)
Place of birth for the foreign-born population - Singapore (%)
Place of birth for the foreign-born population - Thailand (%)
Place of birth for the foreign-born population - Vietnam (%)
Place of birth for the foreign-born population - Other South Eastern Asia (%)
Place of birth for the foreign-born population - Armenia (%)
Place of birth for the foreign-born population - Iraq (%)
Place of birth for the foreign-born population - Israel (%)
Place of birth for the foreign-born population - Jordan (%)
Place of birth for the foreign-born population - Kuwait (%)
Place of birth for the foreign-born population - Lebanon (%)
Place of birth for the foreign-born population - Saudi Arabia (%)
Place of birth for the foreign-born population - Syria (%)
Place of birth for the foreign-born population - Turkey (%)
Place of birth for the foreign-born population - Yemen (%)
Place of birth for the foreign-born population - Other Western Asia (%)
Place of birth for the foreign-born population - Eritrea (%)
Place of birth for the foreign-born population - Ethiopia (%)
Place of birth for the foreign-born population - Kenya (%)
Place of birth for the foreign-born population - Somalia (%)
Place of birth for the foreign-born population - Uganda (%)
Place of birth for the foreign-born population - Zimbabwe (%)
Place of birth for the foreign-born population - Other Eastern Africa (%)
Place of birth for the foreign-born population - Cameroon (%)
Place of birth for the foreign-born population - Congo (%)
Place of birth for the foreign-born population - Democratic Republic of Congo (Zaire) (%)
Place of birth for the foreign-born population - Other Middle Africa (%)
Place of birth for the foreign-born population - Egypt (%)
Place of birth for the foreign-born population - Morocco (%)
Place of birth for the foreign-born population - Sudan (%)
Place of birth for the foreign-born population - Other Northern Africa (%)
Place of birth for the foreign-born population - South Africa (%)
Place of birth for the foreign-born population - Other Southern Africa (%)
Place of birth for the foreign-born population - Cabo Verde (%)
Place of birth for the foreign-born population - Ghana (%)
Place of birth for the foreign-born population - Liberia (%)
Place of birth for the foreign-born population - Nigeria (%)
Place of birth for the foreign-born population - Senegal (%)
Place of birth for the foreign-born population - Sierra Leone (%)
Place of birth for the foreign-born population - Other Western Africa (%)
Place of birth for the foreign-born population - Australia (%)
Place of birth for the foreign-born population - New Zealand (%)
Place of birth for the foreign-born population - Fiji (%)
Place of birth for the foreign-born population - Micronesia (%)
Place of birth for the foreign-born population - Bahamas (%)
Place of birth for the foreign-born population - Barbados (%)
Place of birth for the foreign-born population - Cuba (%)
Place of birth for the foreign-born population - Dominica (%)
Place of birth for the foreign-born population - Dominican Republic (%)
Place of birth for the foreign-born population - Grenada (%)
Place of birth for the foreign-born population - Haiti (%)
Place of birth for the foreign-born population - Jamaica (%)
Place of birth for the foreign-born population - St. Vincent and the Grenadines (%)
Place of birth for the foreign-born population - Trinidad and Tobago (%)
Place of birth for the foreign-born population - West Indies (%)
Place of birth for the foreign-born population - Other Caribbean (%)
Place of birth for the foreign-born population - Belize (%)
Place of birth for the foreign-born population - Costa Rica (%)
Place of birth for the foreign-born population - El Salvador (%)
Place of birth for the foreign-born population - Guatemala (%)
Place of birth for the foreign-born population - Honduras (%)
Place of birth for the foreign-born population - Mexico (%)
Place of birth for the foreign-born population - Nicaragua (%)
Place of birth for the foreign-born population - Panama (%)
Place of birth for the foreign-born population - Other Central America (%)
Place of birth for the foreign-born population - Argentina (%)
Place of birth for the foreign-born population - Bolivia (%)
Place of birth for the foreign-born population - Brazil (%)
Place of birth for the foreign-born population - Chile (%)
Place of birth for the foreign-born population - Colombia (%)
Place of birth for the foreign-born population - Ecuador (%)
Place of birth for the foreign-born population - Guyana (%)
Place of birth for the foreign-born population - Peru (%)
Place of birth for the foreign-born population - Uruguay (%)
Place of birth for the foreign-born population - Venezuela (%)
Place of birth for the foreign-born population - Other South America (%)
Place of birth for the foreign-born population - Canada (%)
Place of birth for the foreign-born population - Other Northern America (%)
Place of birth for the foreign-born population - Other (%)
Latest news about races in Henderson, TX collected exclusively by city-data.com from local newspapers, TV, and radio stations
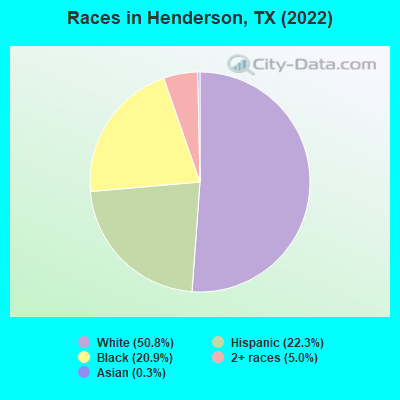
According to 2022 data, the most numerous races in Henderson, TX are Hispanic (3,055 residents), White alone (6,958 residents), and Black alone (2,862 residents). 82.8% of Henderson residents speak English at home. 8.4% of Henderson, TX residents are foreign-born (7.1% born in Latin America), which is 101.4% less than the foreign-born rate of 17.0% across the entire state of Texas.
Race distribution in Henderson
2000 2022
10,933,313 52.4% White alone 6,669,666 32.0% Hispanic 2,364,255 11.3% Black alone 554,445 2.7% Asian alone 230,567 1.1% Two or more races 68,859 0.3% American Indian alone 19,958 0.10% Other race alone 10,757 0.05% Native Hawaiian and Other
12,070,642 40.2% Hispanic 11,683,430 38.9% White alone 3,508,706 11.7% Black alone 1,608,173 5.4% Asian alone 956,560 3.2% Two or more races 125,763 0.4% Other race alone 47,023 0.2% American Indian alone 29,275 0.10% Native Hawaiian and Other
Income and house value in Henderson Median household income in 2022 $65,676 White non-Hispanic householders$47,417 Black householders$28,270 Two or more races householders$51,854 Hispanic or Latino race householdersMedian 2022 house value $192,920 White Non-Hispanic householders$106,988 Black or African American householders$184,953 American Indian or Alaska Native householders over $1,000,000 Asian householders$83,371 Some other race householders$268,324 Two or more races householders$93,614 Hispanic or Latino householders
Median age by race in Henderson
40.6 Median age for White residents40.0 42.1 38.1 Median age for Black or African American residents43.3 35.1 -684,418,145.3 Median age for American Indian / Alaska Native residents-682,445,758.7 -684,418,145.3 57.5 Median age for Asian residents23.1 70.1 -581,560,283.1 Median age for Native Hawaiian / Pacific Islander residents-612,729,233.5 -577,777,777.2 59.2 Median age for Other race residents50.2 59.1 30.0 Median age for Two or more races residents30.1 33.4 39.2 Median age for White alone residents38.1 45.1 33.0 Median age for Hispanic or Latino residents35.3 29.4
Owner/renter occupied households by race in Henderson
House owners and renters - White residents 1,852 72.0% Owner occupied719 28.0% Renter occupiedHouse owners and renters - Black or African American residents 299 38.8% Owner occupied472 61.2% Renter occupiedHouse owners and renters - Asian residents 5 100.0% Owner occupiedHouse owners and renters - Other race residents 19 35.8% Owner occupied34 64.2% Renter occupiedHouse owners and renters - Two or more races residents 427 69.2% Owner occupied190 30.8% Renter occupiedHouse owners and renters - White alone residents 1,800 68.6% Owner occupied823 31.4% Renter occupiedHouse owners and renters - Hispanic or Latino residents 478 83.9% Owner occupied91 16.1% Renter occupied
Language usage in Henderson
English speakers - Total 82.8% of residents of Henderson speak English at home.
15.5% of residents speak Spanish at home 1,425 71.0% Speak English very well583 29.0% Speak English less than very well1.6% of residents speak other language at home 188 91.3% Speak English very well18 8.7% Speak English less than very well
English speakers - Born in the United States 79.4% of residents of Henderson speak English at home.
20.1% of residents speak Spanish at home 459 100.0% Speak English very well0.5% of residents speak other language at home 12 100.0% Speak English very well
English speakers - Native, born elsewhere 17.7% of residents of Henderson speak English at home.
25.0% of residents speak Spanish at home 31 100.0% Speak English very well65.3% of residents speak other language at home 81 100.0% Speak English very well
English speakers - Foreign-born 20.0% of residents of Henderson speak English at home.
75.3% of residents speak Spanish at home 357 41.0% Speak English very well514 59.0% Speak English less than very well4.0% of residents speak other language at home 28 60.9% Speak English very well18 39.1% Speak English less than very well
White (Caucasian) - Speak only English Native:
99.6% (6,457)Foreign-born:
35.7% (131)
White (Caucasian) - Speak another language Native:
4.9% (319)Foreign-born:
70.5% (259)
Asian - Speak only English Native:
39.3% (8)Foreign-born:
62.0% (13)
Asian - Speak another language Native:
60.4% (12)Foreign-born:
39.8% (9)
Other race - Speak another language Native:
55.6% (70)Foreign-born:
99.5% (58)
Two or more races - Speak only English Native:
51.2% (1,053)Foreign-born:
20.0% (80)
Two or more races - Speak another language Native:
48.3% (992)Foreign-born:
79.2% (316)
White alone - Speak only English Native:
99.7% (6,447)Foreign-born:
83.9% (89)
White alone - Speak another language Native:
0.5% (31)Foreign-born:
16.3% (17)
Hispanic or Latino - Speak only English Native:
38.4% (727)Foreign-born:
8.1% (77)
Hispanic or Latino - Speak another language Native:
61.5% (1,165)Foreign-born:
92.1% (874)
Foreign-born residents in Henderson 1,156 residents are foreign born (7.1% Latin America ).
This city:
8.4%Texas:
17.1%
Marital status for residents in Henderson Marital status - White (Caucasian) population 15 years and over
Males 29.3% Never married43.6% Now married2.9% Separated6.4% Widowed17.8% DivorcedFemales 26.1% Never married44.8% Now married1.2% Separated13.7% Widowed14.2% DivorcedWomen who gave birth in the past 12 months Now married:
100.0% (58)Unmarried:
0.0% (0)
Women who did not give birth in the past 12 months Now married:
43.2% (532)Unmarried:
56.8% (698)
Marital status - Black or African American population 15 years and over
Males 44.7% Never married22.8% Now married8.9% Separated3.7% Widowed19.9% DivorcedFemales 40.4% Never married31.4% Now married7.0% Separated5.2% Widowed16.1% DivorcedWomen who gave birth in the past 12 months Now married:
83.7% (41)Unmarried:
16.3% (8)
Women who did not give birth in the past 12 months Now married:
34.2% (247)Unmarried:
65.8% (474)
Marital status - Asian population 15 years and over
Males 81.8% Never married18.2% Now married0.0% Separated0.0% Widowed0.0% DivorcedFemales 0.0% Never married56.2% Now married0.0% Separated43.8% Widowed0.0% DivorcedMarital status - Other race population 15 years and over
Males 41.9% Never married37.2% Now married14.0% Separated0.0% Widowed7.0% DivorcedFemales 21.2% Never married78.8% Now married0.0% Separated0.0% Widowed0.0% DivorcedWomen who did not give birth in the past 12 months Now married:
0.0% (0)Unmarried:
100.0% (15)
Marital status - Two or more races population 15 years and over
Males 55.5% Never married13.0% Now married0.9% Separated7.7% Widowed22.9% DivorcedFemales 44.5% Never married21.7% Now married7.7% Separated20.2% Widowed6.0% DivorcedWomen who gave birth in the past 12 months Now married:
100.0% (24)Unmarried:
0.0% (0)
Women who did not give birth in the past 12 months Now married:
31.1% (204)Unmarried:
68.9% (452)
Marital status - White alone, not Hispanic / Latino population 15 years and over
Males 25.5% Never married42.5% Now married3.2% Separated8.0% Widowed20.8% DivorcedFemales 23.5% Never married43.0% Now married1.1% Separated16.4% Widowed16.0% DivorcedWomen who gave birth in the past 12 months Now married:
100.0% (71)Unmarried:
0.0% (0)
Women who did not give birth in the past 12 months Now married:
46.0% (543)Unmarried:
54.0% (636)
Marital status - Hispanic or Latino population 15 years and over
Males 48.3% Never married35.7% Now married1.9% Separated2.8% Widowed11.2% DivorcedFemales 39.0% Never married46.2% Now married5.2% Separated5.2% Widowed4.3% DivorcedWomen who gave birth in the past 12 months Now married:
100.0% (16)Unmarried:
0.0% (0)
Women who did not give birth in the past 12 months Now married:
36.2% (228)Unmarried:
63.8% (401)
Ancestries in Henderson
1,878 19.6% American993 10.4% English514 5.4% Irish391 4.1% German64 0.7% Italian48 0.5% European48 0.5% Norwegian47 0.5% African44 0.5% Dutch29 0.3% Australian24 0.3% French23 0.2% Scotch-Irish16 0.2% Sudanese14 0.1% Yugoslavian11 0.1% Eastern European8 0.08% Haitian7 0.07% Arab7 0.07% Polish7 0.07% Scottish6 0.06% Czech4 0.04% Swedish3 0.03% British
Geographical mobility in Henderson Same house 1 year ago 5,651 80.1% White (Caucasian)1,586 55.2% Black or African American9 100.0% American Indian / Alaska Native26 62.7% Asian93 50.8% Other race1,997 74.3% Two or more races5,376 78.9% White alone, not Hispanic / Latino2,327 76.2% Hispanic or LatinoMoved within same county 315 4.5% White / Caucasian400 13.9% Black or African American9 0.4% Two or more races362 5.3% White alone, not Hispanic / Latino23 0.8% Hispanic or LatinoMoved within same state 1,059 15.0% White / Caucasian864 30.1% Black or African American16 40.0% Asian60 32.5% Other race624 23.2% Two or more races954 14.0% White alone, not Hispanic / Latino679 22.3% Hispanic or LatinoMoved from different state 126 1.8% White / Caucasian34 18.6% Other race130 1.9% White alone, not Hispanic / Latino29 0.9% Hispanic or LatinoMoved from abroad 4 0.1% White6 0.1% White alone, not Hispanic / Latino
Children Nativity (place of birth) in Henderson
Children under 6 years - Living with two parents Both parents native 605 100.0% NativeBoth parents foreign-born 74 100.0% NativeOne native, one foreign-born parent 10 100.0% NativeChildren under 6 years - Living with one parent Native parent 80 100.0% NativeChildren 6 to 17 years - Living with two parents Both parents native 794 100.0% Native0 0.0% Foreign-bornBoth parents foreign-born 413 86.5% Native65 13.5% Foreign-bornOne native, one foreign-born parent 57 100.0% NativeChildren 6 to 17 years - Living with one parent Native parent 581 100.0% NativeForeign-born parent 23 50.5% Native22 49.5% Foreign-born
Grandparents responsible for own grandchildren in Henderson
Grandparents (30 to 59 years) White / Caucasian 54 76.3% Responsible for grandchildren17 23.7% Not responsible for grandchildrenBlack or African American 7 100.0% Not responsible for grandchildrenOther race 25 100.0% Responsible for grandchildrenWhite alone, not Hispanic / Latino 40 100.0% Responsible for grandchildrenHispanic or Latino 56 68.5% Responsible for grandchildren26 31.5% Not responsible for grandchildrenGrandparents (60 years and over) White / Caucasian 38 42.2% Responsible for grandchildren52 57.8% Not responsible for grandchildrenBlack or African American 6 54.5% Responsible for grandchildren5 45.5% Not responsible for grandchildrenOther race 18 100.0% Responsible for grandchildrenWhite alone, not Hispanic / Latino 45 38.7% Responsible for grandchildren71 61.3% Not responsible for grandchildrenHispanic or Latino 13 100.0% Responsible for grandchildren