Races in Helotes, Texas (TX) Detailed Stats
Data:
Races - White alone (%)
Races - White alone (% change since 2000)
Races - Black alone (%)
Races - Black alone (% change since 2000)
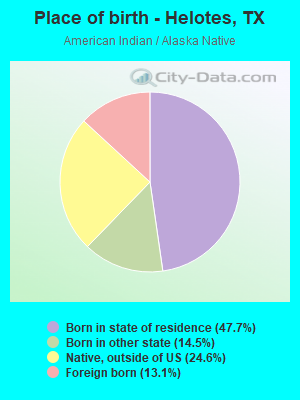
Races - American Indian alone (%)
Races - American Indian alone (% change since 2000)
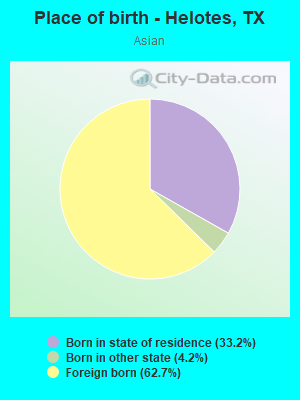
Races - Asian alone (%)
Races - Asian alone (% change since 2000)
Races - Hispanic (%)
Races - Hispanic (% change since 2000)
Races - Native Hawaiian and Other Pacific Islander alone (%)
Races - Native Hawaiian and Other Pacific Islander alone (% change since 2000)
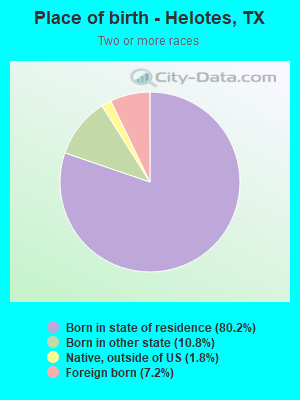
Races - Two or more races(%)
Races - Two or more races(% change since 2000)
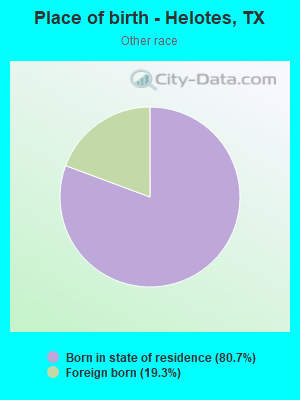
Races - Other race alone (%)
Races - Other race alone (% change since 2000)
Racial diversity
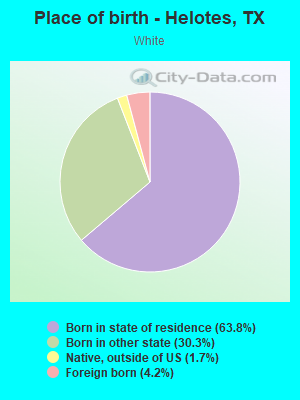
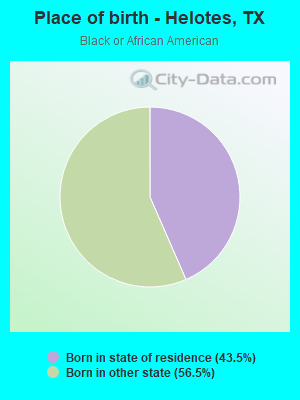
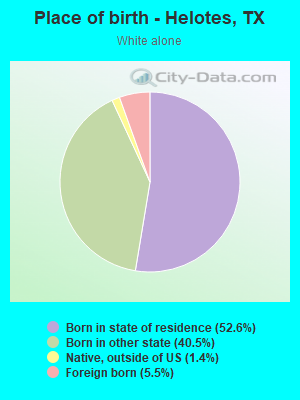
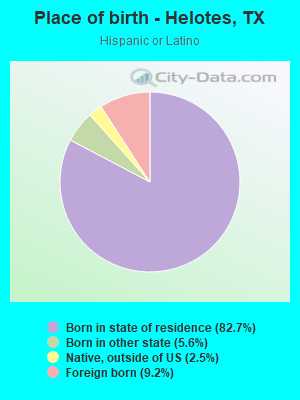
Place of birth - Born in state of residence (%)
Place of birth - Born in state of residence (%) - White
Place of birth - Born in state of residence (%) - Black or African American
Place of birth - Born in state of residence (%) - Asian
Place of birth - Born in state of residence (%) - Hispanic or Latino
Place of birth - Born in state of residence (%) - American Indian and Alaska Native
Place of birth - Born in state of residence (%) - Multirace
Place of birth - Born in state of residence (%) - Other Race
Place of birth - Born in other state (%)
Place of birth - Born in other state (%) - White
Place of birth - Born in other state (%) - Black or African American
Place of birth - Born in other state (%) - Asian
Place of birth - Born in other state (%) - Hispanic or Latino
Place of birth - Born in other state (%) - American Indian and Alaska Native
Place of birth - Born in other state (%) - Multirace
Place of birth - Born in other state (%) - Other Race
Place of birth - Native, outside of US (%)
Place of birth - Native, outside of US (%) - White
Place of birth - Native, outside of US (%) - Black or African American
Place of birth - Native, outside of US (%) - Asian
Place of birth - Native, outside of US (%) - Hispanic or Latino
Place of birth - Native, outside of US (%) - American Indian and Alaska Native
Place of birth - Native, outside of US (%) - Multirace
Place of birth - Native, outside of US (%) - Other Race
Place of birth - Foreign born (%)
Place of birth - Foreign born (%) - White
Place of birth - Foreign born (%) - Black or African American
Place of birth - Foreign born (%) - Asian
Place of birth - Foreign born (%) - Hispanic or Latino
Place of birth - Foreign born (%) - American Indian and Alaska Native
Place of birth - Foreign born (%) - Multirace
Place of birth - Foreign born (%) - Other Race
Residents speaking English at home (%)
Residents speaking English at home - Born in the United States (%)
Residents speaking English at home - Native, born elsewhere (%)
Residents speaking English at home - Foreign born (%)
Residents speaking Spanish at home (%)
Residents speaking Spanish at home - Born in the United States (%)
Residents speaking Spanish at home - Native, born elsewhere (%)
Residents speaking Spanish at home - Foreign born (%)
Residents speaking other language at home (%)
Residents speaking other language at home - Born in the United States (%)
Residents speaking other language at home - Native, born elsewhere (%)
Residents speaking other language at home - Foreign born (%)
Marital status - Never married (%)
Marital status - Now married (%)
Marital status - Separated (%)
Marital status - Widowed (%)
Marital status - Divorced (%)
Ancestries Reported - Arab (%)
Ancestries Reported - Czech (%)
Ancestries Reported - Danish (%)
Ancestries Reported - Dutch (%)
Ancestries Reported - English (%)
Ancestries Reported - French (%)
Ancestries Reported - French Canadian (%)
Ancestries Reported - German (%)
Ancestries Reported - Greek (%)
Ancestries Reported - Hungarian (%)
Ancestries Reported - Irish (%)
Ancestries Reported - Italian (%)
Ancestries Reported - Lithuanian (%)
Ancestries Reported - Norwegian (%)
Ancestries Reported - Polish (%)
Ancestries Reported - Portuguese (%)
Ancestries Reported - Russian (%)
Ancestries Reported - Scotch-Irish (%)
Ancestries Reported - Scottish (%)
Ancestries Reported - Slovak (%)
Ancestries Reported - Subsaharan African (%)
Ancestries Reported - Swedish (%)
Ancestries Reported - Swiss (%)
Ancestries Reported - Ukrainian (%)
Ancestries Reported - United States (%)
Ancestries Reported - Welsh (%)
Ancestries Reported - West Indian (%)
Ancestries Reported - Other (%)
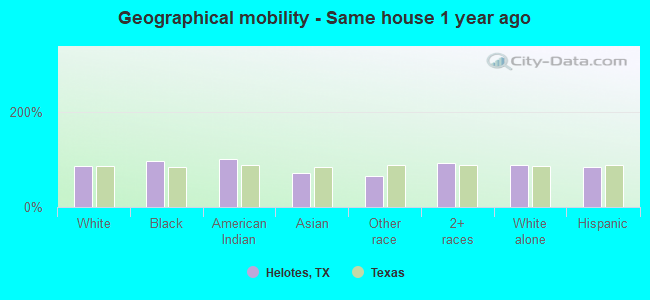
Geographical mobility - Same house 1 year ago (%)
Geographical mobility - Same house 1 year ago (%) - White
Geographical mobility - Same house 1 year ago (%) - Black or African American
Geographical mobility - Same house 1 year ago (%) - Asian
Geographical mobility - Same house 1 year ago (%) - Hispanic or Latino
Geographical mobility - Same house 1 year ago (%) - American Indian and Alaska Native
Geographical mobility - Same house 1 year ago (%) - Multirace
Geographical mobility - Same house 1 year ago (%) - Other Race
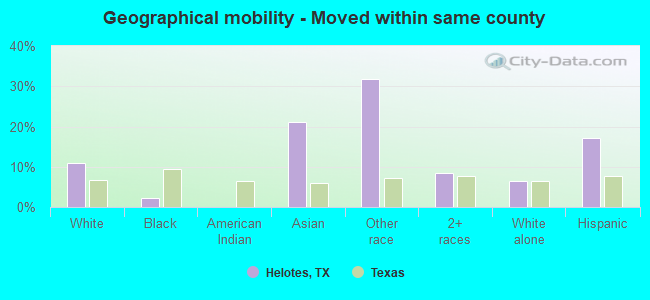
Geographical mobility - Moved within same county (%)
Geographical mobility - Moved within same county (%) - White
Geographical mobility - Moved within same county (%) - Black or African American
Geographical mobility - Moved within same county (%) - Asian
Geographical mobility - Moved within same county (%) - Hispanic or Latino
Geographical mobility - Moved within same county (%) - American Indian and Alaska Native
Geographical mobility - Moved within same county (%) - Multirace
Geographical mobility - Moved within same county (%) - Other Race
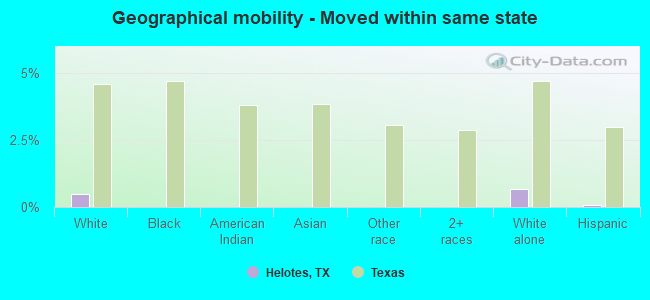
Geographical mobility - Moved from different county within same state (%)
Geographical mobility - Moved from different county within same state (%) - White
Geographical mobility - Moved from different county within same state (%) - Black or African American
Geographical mobility - Moved from different county within same state (%) - Asian
Geographical mobility - Moved from different county within same state (%) - Hispanic or Latino
Geographical mobility - Moved from different county within same state (%) - American Indian and Alaska Native
Geographical mobility - Moved from different county within same state (%) - Multirace
Geographical mobility - Moved from different county within same state (%) - Other Race
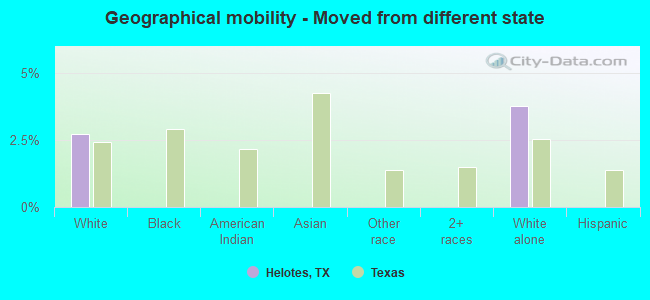
Geographical mobility - Moved from different state (%)
Geographical mobility - Moved from different state (%) - White
Geographical mobility - Moved from different state (%) - Black or African American
Geographical mobility - Moved from different state (%) - Asian
Geographical mobility - Moved from different state (%) - Hispanic or Latino
Geographical mobility - Moved from different state (%) - American Indian and Alaska Native
Geographical mobility - Moved from different state (%) - Multirace
Geographical mobility - Moved from different state (%) - Other Race
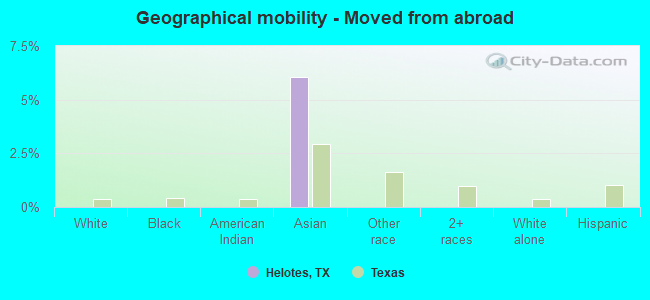
Geographical mobility - Moved from abroad (%)
Geographical mobility - Moved from abroad (%) - White
Geographical mobility - Moved from abroad (%) - Black or African American
Geographical mobility - Moved from abroad (%) - Asian
Geographical mobility - Moved from abroad (%) - Hispanic or Latino
Geographical mobility - Moved from abroad (%) - American Indian and Alaska Native
Geographical mobility - Moved from abroad (%) - Multirace
Geographical mobility - Moved from abroad (%) - Other Race
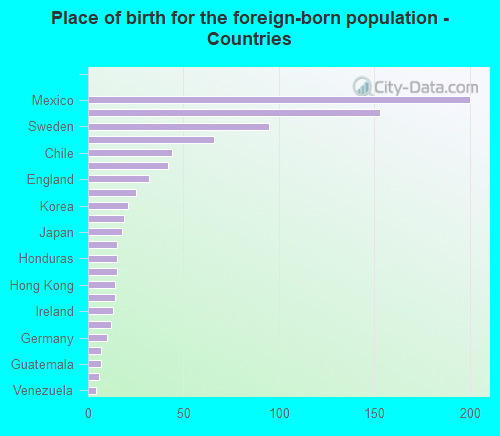
Place of birth for the foreign-born population - Ireland (%)
Place of birth for the foreign-born population - Denmark (%)
Place of birth for the foreign-born population - Norway (%)
Place of birth for the foreign-born population - Sweden (%)
Place of birth for the foreign-born population - United Kingdom (%)
Place of birth for the foreign-born population - England (%)
Place of birth for the foreign-born population - Scotland (%)
Place of birth for the foreign-born population - Other Northern Europe (%)
Place of birth for the foreign-born population - Austria (%)
Place of birth for the foreign-born population - Belgium (%)
Place of birth for the foreign-born population - France (%)
Place of birth for the foreign-born population - Germany (%)
Place of birth for the foreign-born population - Netherlands (%)
Place of birth for the foreign-born population - Switzerland (%)
Place of birth for the foreign-born population - Other Western Europe (%)
Place of birth for the foreign-born population - Greece (%)
Place of birth for the foreign-born population - Italy (%)
Place of birth for the foreign-born population - Portugal (%)
Place of birth for the foreign-born population - Spain (%)
Place of birth for the foreign-born population - Other Southern Europe (%)
Place of birth for the foreign-born population - Albania (%)
Place of birth for the foreign-born population - Belarus (%)
Place of birth for the foreign-born population - Bosnia and Herzegovina (%)
Place of birth for the foreign-born population - Bulgaria (%)
Place of birth for the foreign-born population - Croatia (%)
Place of birth for the foreign-born population - Czechoslovakia (%)
Place of birth for the foreign-born population - Hungary (%)
Place of birth for the foreign-born population - Latvia (%)
Place of birth for the foreign-born population - Lithuania (%)
Place of birth for the foreign-born population - North Macedonia (Macedonia) (%)
Place of birth for the foreign-born population - Moldova (%)
Place of birth for the foreign-born population - Poland (%)
Place of birth for the foreign-born population - Romania (%)
Place of birth for the foreign-born population - Russia (%)
Place of birth for the foreign-born population - Serbia (%)
Place of birth for the foreign-born population - Ukraine (%)
Place of birth for the foreign-born population - Other Eastern Europe (%)
Place of birth for the foreign-born population - China (%)
Place of birth for the foreign-born population - Hong Kong (%)
Place of birth for the foreign-born population - Taiwan (%)
Place of birth for the foreign-born population - Japan (%)
Place of birth for the foreign-born population - Korea (%)
Place of birth for the foreign-born population - Other Eastern Asia (%)
Place of birth for the foreign-born population - Afghanistan (%)
Place of birth for the foreign-born population - Bangladesh (%)
Place of birth for the foreign-born population - India (%)
Place of birth for the foreign-born population - Iran (%)
Place of birth for the foreign-born population - Kazakhstan (%)
Place of birth for the foreign-born population - Nepal (%)
Place of birth for the foreign-born population - Pakistan (%)
Place of birth for the foreign-born population - Sri Lanka (%)
Place of birth for the foreign-born population - Uzbekistan (%)
Place of birth for the foreign-born population - Other South Central Asia (%)
Place of birth for the foreign-born population - Burma (%)
Place of birth for the foreign-born population - Cambodia (%)
Place of birth for the foreign-born population - Indonesia (%)
Place of birth for the foreign-born population - Laos (%)
Place of birth for the foreign-born population - Malaysia (%)
Place of birth for the foreign-born population - Philippines (%)
Place of birth for the foreign-born population - Singapore (%)
Place of birth for the foreign-born population - Thailand (%)
Place of birth for the foreign-born population - Vietnam (%)
Place of birth for the foreign-born population - Other South Eastern Asia (%)
Place of birth for the foreign-born population - Armenia (%)
Place of birth for the foreign-born population - Iraq (%)
Place of birth for the foreign-born population - Israel (%)
Place of birth for the foreign-born population - Jordan (%)
Place of birth for the foreign-born population - Kuwait (%)
Place of birth for the foreign-born population - Lebanon (%)
Place of birth for the foreign-born population - Saudi Arabia (%)
Place of birth for the foreign-born population - Syria (%)
Place of birth for the foreign-born population - Turkey (%)
Place of birth for the foreign-born population - Yemen (%)
Place of birth for the foreign-born population - Other Western Asia (%)
Place of birth for the foreign-born population - Eritrea (%)
Place of birth for the foreign-born population - Ethiopia (%)
Place of birth for the foreign-born population - Kenya (%)
Place of birth for the foreign-born population - Somalia (%)
Place of birth for the foreign-born population - Uganda (%)
Place of birth for the foreign-born population - Zimbabwe (%)
Place of birth for the foreign-born population - Other Eastern Africa (%)
Place of birth for the foreign-born population - Cameroon (%)
Place of birth for the foreign-born population - Congo (%)
Place of birth for the foreign-born population - Democratic Republic of Congo (Zaire) (%)
Place of birth for the foreign-born population - Other Middle Africa (%)
Place of birth for the foreign-born population - Egypt (%)
Place of birth for the foreign-born population - Morocco (%)
Place of birth for the foreign-born population - Sudan (%)
Place of birth for the foreign-born population - Other Northern Africa (%)
Place of birth for the foreign-born population - South Africa (%)
Place of birth for the foreign-born population - Other Southern Africa (%)
Place of birth for the foreign-born population - Cabo Verde (%)
Place of birth for the foreign-born population - Ghana (%)
Place of birth for the foreign-born population - Liberia (%)
Place of birth for the foreign-born population - Nigeria (%)
Place of birth for the foreign-born population - Senegal (%)
Place of birth for the foreign-born population - Sierra Leone (%)
Place of birth for the foreign-born population - Other Western Africa (%)
Place of birth for the foreign-born population - Australia (%)
Place of birth for the foreign-born population - New Zealand (%)
Place of birth for the foreign-born population - Fiji (%)
Place of birth for the foreign-born population - Micronesia (%)
Place of birth for the foreign-born population - Bahamas (%)
Place of birth for the foreign-born population - Barbados (%)
Place of birth for the foreign-born population - Cuba (%)
Place of birth for the foreign-born population - Dominica (%)
Place of birth for the foreign-born population - Dominican Republic (%)
Place of birth for the foreign-born population - Grenada (%)
Place of birth for the foreign-born population - Haiti (%)
Place of birth for the foreign-born population - Jamaica (%)
Place of birth for the foreign-born population - St. Vincent and the Grenadines (%)
Place of birth for the foreign-born population - Trinidad and Tobago (%)
Place of birth for the foreign-born population - West Indies (%)
Place of birth for the foreign-born population - Other Caribbean (%)
Place of birth for the foreign-born population - Belize (%)
Place of birth for the foreign-born population - Costa Rica (%)
Place of birth for the foreign-born population - El Salvador (%)
Place of birth for the foreign-born population - Guatemala (%)
Place of birth for the foreign-born population - Honduras (%)
Place of birth for the foreign-born population - Mexico (%)
Place of birth for the foreign-born population - Nicaragua (%)
Place of birth for the foreign-born population - Panama (%)
Place of birth for the foreign-born population - Other Central America (%)
Place of birth for the foreign-born population - Argentina (%)
Place of birth for the foreign-born population - Bolivia (%)
Place of birth for the foreign-born population - Brazil (%)
Place of birth for the foreign-born population - Chile (%)
Place of birth for the foreign-born population - Colombia (%)
Place of birth for the foreign-born population - Ecuador (%)
Place of birth for the foreign-born population - Guyana (%)
Place of birth for the foreign-born population - Peru (%)
Place of birth for the foreign-born population - Uruguay (%)
Place of birth for the foreign-born population - Venezuela (%)
Place of birth for the foreign-born population - Other South America (%)
Place of birth for the foreign-born population - Canada (%)
Place of birth for the foreign-born population - Other Northern America (%)
Place of birth for the foreign-born population - Other (%)
Latest news about races in Helotes, TX collected exclusively by city-data.com from local newspapers, TV, and radio stations
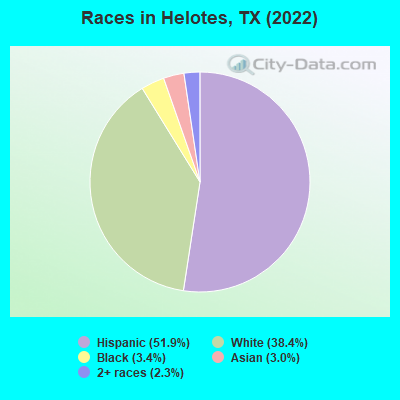
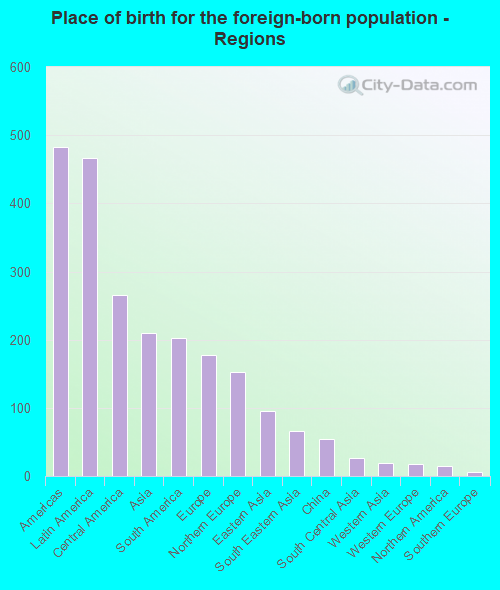
According to 2022 data, the most numerous races in Helotes, TX are Hispanic (4,855 residents), White alone (3,592 residents), and Black alone (321 residents). 81.8% of Helotes residents speak English at home. 9.3% of Helotes, TX residents are foreign-born (4.9% born in Latin America, 2.2% born in Asia, 1.9% born in Europe), which is 82.6% less than the foreign-born rate of 17.0% across the entire state of Texas.
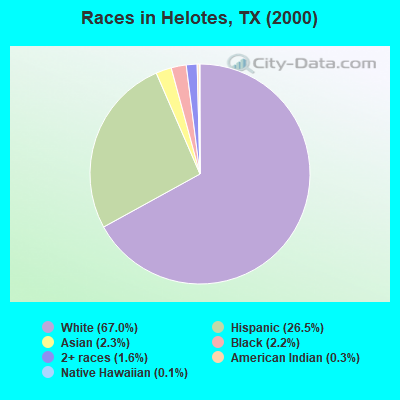
Race distribution in Helotes
2000 2022
10,933,313 52.4% White alone 6,669,666 32.0% Hispanic 2,364,255 11.3% Black alone 554,445 2.7% Asian alone 230,567 1.1% Two or more races 68,859 0.3% American Indian alone 19,958 0.10% Other race alone 10,757 0.05% Native Hawaiian and Other
12,070,642 40.2% Hispanic 11,683,430 38.9% White alone 3,508,706 11.7% Black alone 1,608,173 5.4% Asian alone 956,560 3.2% Two or more races 125,763 0.4% Other race alone 47,023 0.2% American Indian alone 29,275 0.10% Native Hawaiian and Other
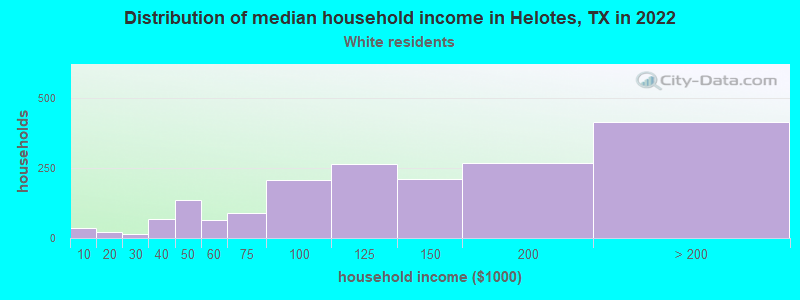
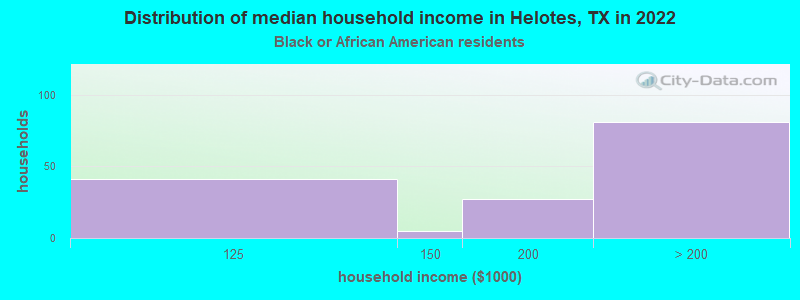
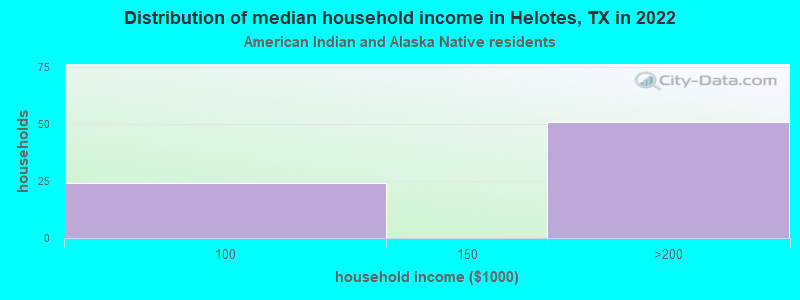
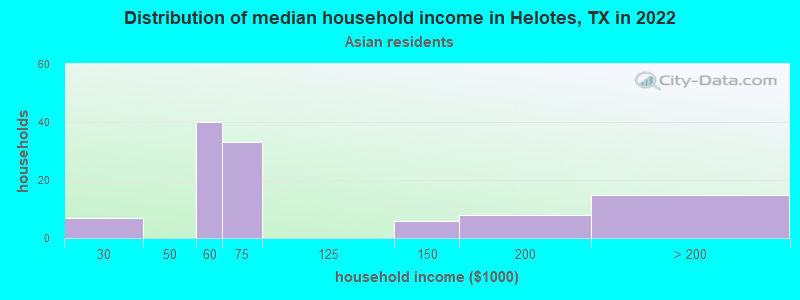
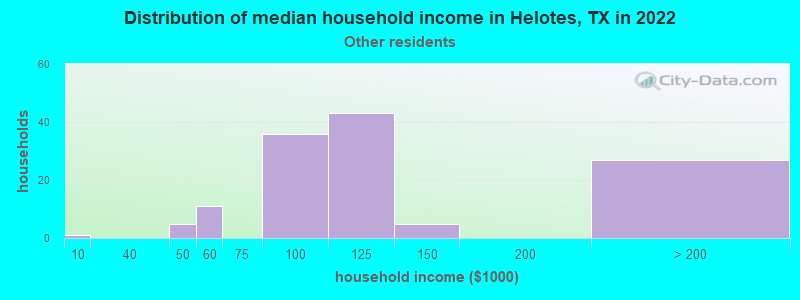
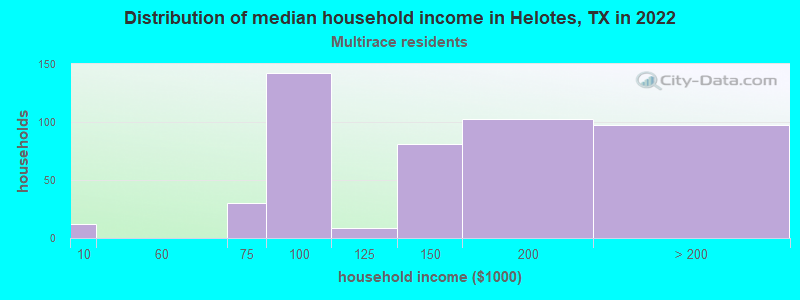
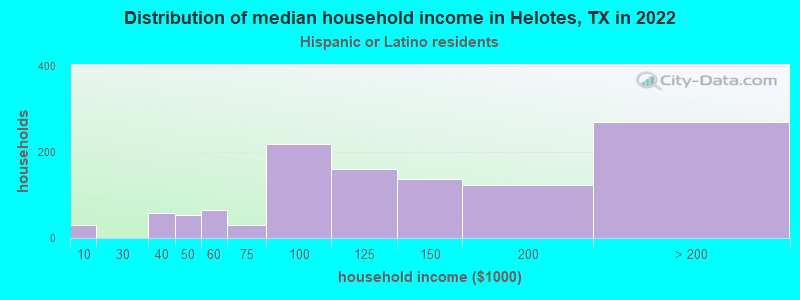
Income and house value in Helotes Median household income in 2022 $126,770 White non-Hispanic householders$177,623 Black householders$61,478 Asian householders$122,526 Some other race householders$134,660 Two or more races householders$121,289 Hispanic or Latino race householdersMedian 2022 house value $422,138 White Non-Hispanic householders$378,599 Black or African American householders$338,035 American Indian or Alaska Native householders $358,317 Asian householders$364,808 Some other race householders$380,222 Two or more races householders$403,749 Hispanic or Latino householders
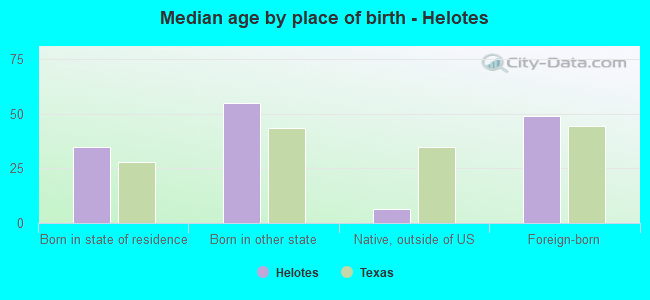
Median age by race in Helotes
46.3 Median age for White residents40.3 48.6 53.6 Median age for Black or African American residents55.2 52.8 37.1 Median age for American Indian / Alaska Native residents22.3 37.8 43.9 Median age for Asian residents49.9 42.8 -674,441,204.4 Median age for Native Hawaiian / Pacific Islander residents-596,986,816.7 -748,387,096.0 47.1 Median age for Other race residents61.1 41.6 26.3 Median age for Two or more races residents20.7 42.0 51.9 Median age for White alone residents50.2 53.5 32.7 Median age for Hispanic or Latino residents29.8 35.9
Owner/renter occupied households by race in Helotes
House owners and renters - White residents 1,678 93.9% Owner occupied109 6.1% Renter occupiedHouse owners and renters - Black or African American residents 164 100.0% Owner occupiedHouse owners and renters - American Indian / Alaska Native residents 58 100.0% Owner occupiedHouse owners and renters - Asian residents 95 94.7% Owner occupied5 5.3% Renter occupiedHouse owners and renters - Other race residents 116 89.5% Owner occupied14 10.5% Renter occupiedHouse owners and renters - Two or more races residents 478 100.0% Owner occupiedHouse owners and renters - White alone residents 1,427 97.3% Owner occupied40 2.7% Renter occupiedHouse owners and renters - Hispanic or Latino residents 1,037 89.6% Owner occupied120 10.4% Renter occupied
Language usage in Helotes
English speakers - Total 81.8% of residents of Helotes speak English at home.
13.7% of residents speak Spanish at home 1,061 85.4% Speak English very well181 14.6% Speak English less than very well5.2% of residents speak other language at home 379 81.0% Speak English very well89 19.0% Speak English less than very well
English speakers - Born in the United States 97.9% of residents of Helotes speak English at home.
3.4% of residents speak Spanish at home 70 100.0% Speak English very well
English speakers - Native, born elsewhere 74.0% of residents of Helotes speak English at home.
23.1% of residents speak Spanish at home 24 100.0% Speak English very well
English speakers - Foreign-born 16.3% of residents of Helotes speak English at home.
43.5% of residents speak Spanish at home 249 67.7% Speak English very well119 32.3% Speak English less than very well40.3% of residents speak other language at home 251 73.6% Speak English very well90 26.4% Speak English less than very well
White (Caucasian) - Speak only English Native:
98.3% (4,537)Foreign-born:
32.5% (66)
White (Caucasian) - Speak another language Native:
8.0% (368)Foreign-born:
73.3% (148)
American Indian / Alaska Native - Speak only English Native:
70.3% (87)Foreign-born:
100.0% (20)
Asian - Speak only English Native:
93.0% (91)Foreign-born:
20.3% (40)
Asian - Speak another language Native:
13.1% (13)Foreign-born:
80.1% (159)
Other race - Speak another language Native:
56.5% (241)Foreign-born:
100.0% (111)
Two or more races - Speak another language Native:
5.5% (113)Foreign-born:
100.0% (169)
White alone - Speak only English Native:
98.1% (3,314)Foreign-born:
40.3% (80)
White alone - Speak another language Native:
2.2% (74)Foreign-born:
59.6% (118)
Hispanic or Latino - Speak only English Native:
80.1% (3,364)Foreign-born:
3.5% (16)
Hispanic or Latino - Speak another language Native:
21.2% (890)Foreign-born:
96.3% (430)
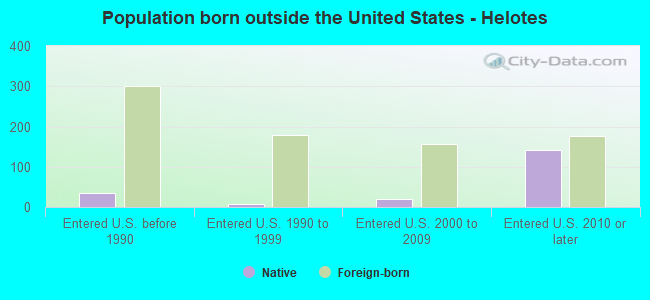
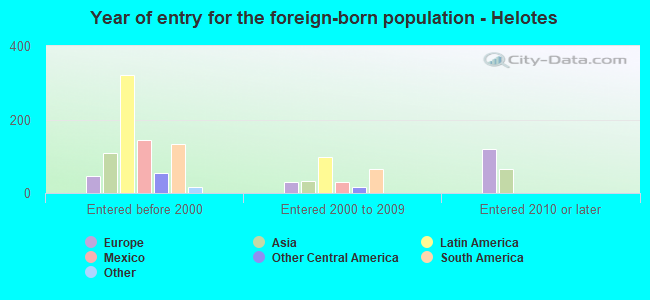
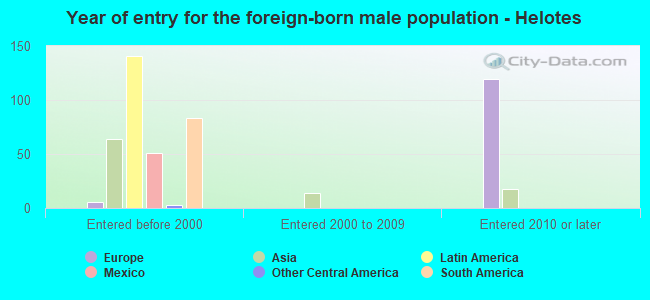
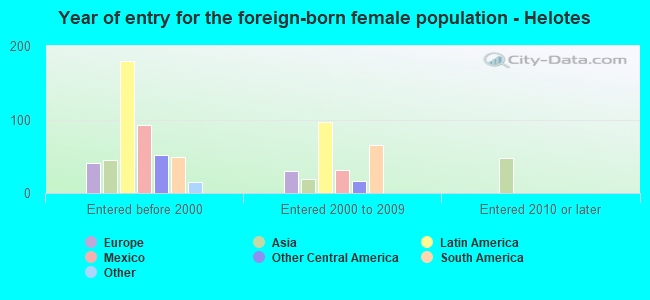
Foreign-born residents in Helotes 870 residents are foreign born (4.9% Latin America , 2.2% Asia , 1.9% Europe ).
This city:
9.3%Texas:
17.1%
Marital status for residents in Helotes Marital status - White (Caucasian) population 15 years and over
Males 35.8% Never married58.3% Now married0.0% Separated0.6% Widowed5.2% DivorcedFemales 22.0% Never married56.7% Now married0.0% Separated8.7% Widowed12.7% DivorcedWomen who gave birth in the past 12 months Now married:
100.0% (7)Unmarried:
0.0% (0)
Women who did not give birth in the past 12 months Now married:
49.2% (455)Unmarried:
50.8% (470)
Marital status - Black or African American population 15 years and over
Males 4.3% Never married76.5% Now married0.0% Separated0.0% Widowed19.1% DivorcedFemales 14.3% Never married81.5% Now married0.0% Separated0.0% Widowed4.2% DivorcedWomen who did not give birth in the past 12 months Now married:
71.4% (55)Unmarried:
28.6% (22)
Marital status - American Indian / Alaska Native population 15 years and over
Males 56.8% Never married43.2% Now married0.0% Separated0.0% Widowed0.0% DivorcedFemales 72.7% Never married27.3% Now married0.0% Separated0.0% Widowed0.0% DivorcedWomen who did not give birth in the past 12 months Now married:
27.3% (22)Unmarried:
72.7% (57)
Marital status - Asian population 15 years and over
Males 6.3% Never married93.7% Now married0.0% Separated0.0% Widowed0.0% DivorcedFemales 12.8% Never married74.5% Now married0.0% Separated12.8% Widowed0.0% DivorcedWomen who gave birth in the past 12 months Now married:
100.0% (30)Unmarried:
0.0% (0)
Women who did not give birth in the past 12 months Now married:
67.9% (40)Unmarried:
32.1% (19)
Marital status - Other race population 15 years and over
Males 18.8% Never married59.2% Now married0.0% Separated8.9% Widowed13.1% DivorcedFemales 27.2% Never married36.1% Now married0.0% Separated11.1% Widowed25.6% DivorcedWomen who did not give birth in the past 12 months Now married:
39.7% (64)Unmarried:
60.3% (98)
Marital status - Two or more races population 15 years and over
Males 57.8% Never married42.2% Now married0.0% Separated0.0% Widowed0.0% DivorcedFemales 33.1% Never married55.8% Now married0.0% Separated4.6% Widowed6.5% DivorcedWomen who did not give birth in the past 12 months Now married:
39.4% (266)Unmarried:
60.6% (410)
Marital status - White alone, not Hispanic / Latino population 15 years and over
Males 23.9% Never married66.9% Now married0.0% Separated1.0% Widowed8.2% DivorcedFemales 15.4% Never married62.4% Now married0.0% Separated12.4% Widowed9.9% DivorcedWomen who gave birth in the past 12 months Now married:
100.0% (10)Unmarried:
0.0% (0)
Women who did not give birth in the past 12 months Now married:
57.2% (319)Unmarried:
42.8% (239)
Marital status - Hispanic or Latino population 15 years and over
Males 51.5% Never married46.1% Now married0.0% Separated1.0% Widowed1.4% DivorcedFemales 31.9% Never married50.7% Now married0.0% Separated3.4% Widowed14.0% DivorcedWomen who gave birth in the past 12 months Now married:
100.0% (11)Unmarried:
0.0% (0)
Women who did not give birth in the past 12 months Now married:
43.2% (554)Unmarried:
56.8% (729)
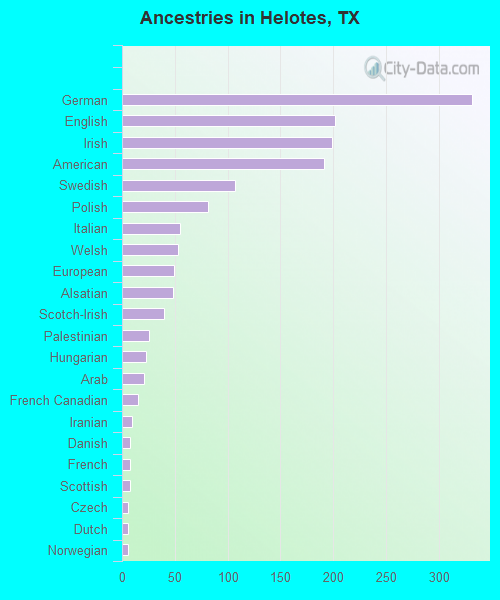
Ancestries in Helotes
331 7.9% German202 4.8% English199 4.8% Irish191 4.6% American107 2.6% Swedish81 1.9% Polish55 1.3% Italian53 1.3% Welsh49 1.2% European48 1.2% Alsatian40 1.0% Scotch-Irish26 0.6% Palestinian23 0.6% Hungarian21 0.5% Arab15 0.4% French Canadian9 0.2% Iranian8 0.2% Danish8 0.2% French8 0.2% Scottish6 0.1% Czech6 0.1% Dutch6 0.1% Norwegian
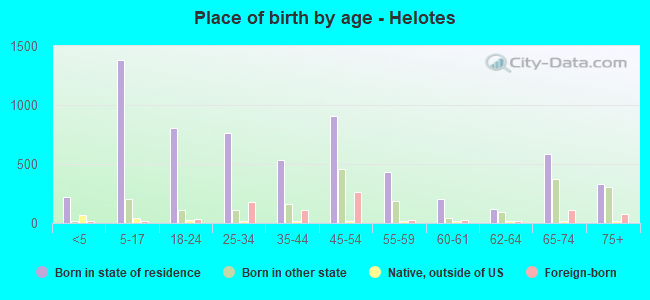
Children Nativity (place of birth) in Helotes
Children under 6 years - Living with two parents Both parents native 178 100.0% NativeBoth parents foreign-born 6 100.0% NativeOne native, one foreign-born parent 23 100.0% NativeChildren under 6 years - Living with one parent Native parent 83 100.0% Native
Children 6 to 17 years - Living with two parents Both parents native 973 100.0% NativeBoth parents foreign-born 104 100.0% NativeOne native, one foreign-born parent 140 100.0% NativeChildren 6 to 17 years - Living with one parent Native parent 289 100.0% Native
Grandparents responsible for own grandchildren in Helotes
Grandparents (30 to 59 years) White / Caucasian 2 9.4% Responsible for grandchildren24 90.6% Not responsible for grandchildrenWhite alone, not Hispanic / Latino 3 100.0% Responsible for grandchildrenHispanic or Latino 28 100.0% Not responsible for grandchildrenGrandparents (60 years and over) White / Caucasian 2 7.4% Responsible for grandchildren28 92.6% Not responsible for grandchildrenWhite alone, not Hispanic / Latino 3 5.3% Responsible for grandchildren48 94.7% Not responsible for grandchildrenHispanic or Latino 14 21.5% Responsible for grandchildren53 78.5% Not responsible for grandchildren