Races in Hammond, Louisiana (LA) Detailed Stats
Data:
Races - White alone (%)
Races - White alone (% change since 2000)
Races - Black alone (%)
Races - Black alone (% change since 2000)
Races - American Indian alone (%)
Races - American Indian alone (% change since 2000)
Races - Asian alone (%)
Races - Asian alone (% change since 2000)
Races - Hispanic (%)
Races - Hispanic (% change since 2000)
Races - Native Hawaiian and Other Pacific Islander alone (%)
Races - Native Hawaiian and Other Pacific Islander alone (% change since 2000)
Races - Two or more races(%)
Races - Two or more races(% change since 2000)
Races - Other race alone (%)
Races - Other race alone (% change since 2000)
Racial diversity
Place of birth - Born in state of residence (%)
Place of birth - Born in state of residence (%) - White
Place of birth - Born in state of residence (%) - Black or African American
Place of birth - Born in state of residence (%) - Asian
Place of birth - Born in state of residence (%) - Hispanic or Latino
Place of birth - Born in state of residence (%) - American Indian and Alaska Native
Place of birth - Born in state of residence (%) - Multirace
Place of birth - Born in state of residence (%) - Other Race
Place of birth - Born in other state (%)
Place of birth - Born in other state (%) - White
Place of birth - Born in other state (%) - Black or African American
Place of birth - Born in other state (%) - Asian
Place of birth - Born in other state (%) - Hispanic or Latino
Place of birth - Born in other state (%) - American Indian and Alaska Native
Place of birth - Born in other state (%) - Multirace
Place of birth - Born in other state (%) - Other Race
Place of birth - Native, outside of US (%)
Place of birth - Native, outside of US (%) - White
Place of birth - Native, outside of US (%) - Black or African American
Place of birth - Native, outside of US (%) - Asian
Place of birth - Native, outside of US (%) - Hispanic or Latino
Place of birth - Native, outside of US (%) - American Indian and Alaska Native
Place of birth - Native, outside of US (%) - Multirace
Place of birth - Native, outside of US (%) - Other Race
Place of birth - Foreign born (%)
Place of birth - Foreign born (%) - White
Place of birth - Foreign born (%) - Black or African American
Place of birth - Foreign born (%) - Asian
Place of birth - Foreign born (%) - Hispanic or Latino
Place of birth - Foreign born (%) - American Indian and Alaska Native
Place of birth - Foreign born (%) - Multirace
Place of birth - Foreign born (%) - Other Race
Residents speaking English at home (%)
Residents speaking English at home - Born in the United States (%)
Residents speaking English at home - Native, born elsewhere (%)
Residents speaking English at home - Foreign born (%)
Residents speaking Spanish at home (%)
Residents speaking Spanish at home - Born in the United States (%)
Residents speaking Spanish at home - Native, born elsewhere (%)
Residents speaking Spanish at home - Foreign born (%)
Residents speaking other language at home (%)
Residents speaking other language at home - Born in the United States (%)
Residents speaking other language at home - Native, born elsewhere (%)
Residents speaking other language at home - Foreign born (%)
Marital status - Never married (%)
Marital status - Now married (%)
Marital status - Separated (%)
Marital status - Widowed (%)
Marital status - Divorced (%)
Ancestries Reported - Arab (%)
Ancestries Reported - Czech (%)
Ancestries Reported - Danish (%)
Ancestries Reported - Dutch (%)
Ancestries Reported - English (%)
Ancestries Reported - French (%)
Ancestries Reported - French Canadian (%)
Ancestries Reported - German (%)
Ancestries Reported - Greek (%)
Ancestries Reported - Hungarian (%)
Ancestries Reported - Irish (%)
Ancestries Reported - Italian (%)
Ancestries Reported - Lithuanian (%)
Ancestries Reported - Norwegian (%)
Ancestries Reported - Polish (%)
Ancestries Reported - Portuguese (%)
Ancestries Reported - Russian (%)
Ancestries Reported - Scotch-Irish (%)
Ancestries Reported - Scottish (%)
Ancestries Reported - Slovak (%)
Ancestries Reported - Subsaharan African (%)
Ancestries Reported - Swedish (%)
Ancestries Reported - Swiss (%)
Ancestries Reported - Ukrainian (%)
Ancestries Reported - United States (%)
Ancestries Reported - Welsh (%)
Ancestries Reported - West Indian (%)
Ancestries Reported - Other (%)
Geographical mobility - Same house 1 year ago (%)
Geographical mobility - Same house 1 year ago (%) - White
Geographical mobility - Same house 1 year ago (%) - Black or African American
Geographical mobility - Same house 1 year ago (%) - Asian
Geographical mobility - Same house 1 year ago (%) - Hispanic or Latino
Geographical mobility - Same house 1 year ago (%) - American Indian and Alaska Native
Geographical mobility - Same house 1 year ago (%) - Multirace
Geographical mobility - Same house 1 year ago (%) - Other Race
Geographical mobility - Moved within same county (%)
Geographical mobility - Moved within same county (%) - White
Geographical mobility - Moved within same county (%) - Black or African American
Geographical mobility - Moved within same county (%) - Asian
Geographical mobility - Moved within same county (%) - Hispanic or Latino
Geographical mobility - Moved within same county (%) - American Indian and Alaska Native
Geographical mobility - Moved within same county (%) - Multirace
Geographical mobility - Moved within same county (%) - Other Race
Geographical mobility - Moved from different county within same state (%)
Geographical mobility - Moved from different county within same state (%) - White
Geographical mobility - Moved from different county within same state (%) - Black or African American
Geographical mobility - Moved from different county within same state (%) - Asian
Geographical mobility - Moved from different county within same state (%) - Hispanic or Latino
Geographical mobility - Moved from different county within same state (%) - American Indian and Alaska Native
Geographical mobility - Moved from different county within same state (%) - Multirace
Geographical mobility - Moved from different county within same state (%) - Other Race
Geographical mobility - Moved from different state (%)
Geographical mobility - Moved from different state (%) - White
Geographical mobility - Moved from different state (%) - Black or African American
Geographical mobility - Moved from different state (%) - Asian
Geographical mobility - Moved from different state (%) - Hispanic or Latino
Geographical mobility - Moved from different state (%) - American Indian and Alaska Native
Geographical mobility - Moved from different state (%) - Multirace
Geographical mobility - Moved from different state (%) - Other Race
Geographical mobility - Moved from abroad (%)
Geographical mobility - Moved from abroad (%) - White
Geographical mobility - Moved from abroad (%) - Black or African American
Geographical mobility - Moved from abroad (%) - Asian
Geographical mobility - Moved from abroad (%) - Hispanic or Latino
Geographical mobility - Moved from abroad (%) - American Indian and Alaska Native
Geographical mobility - Moved from abroad (%) - Multirace
Geographical mobility - Moved from abroad (%) - Other Race
Place of birth for the foreign-born population - Ireland (%)
Place of birth for the foreign-born population - Denmark (%)
Place of birth for the foreign-born population - Norway (%)
Place of birth for the foreign-born population - Sweden (%)
Place of birth for the foreign-born population - United Kingdom (%)
Place of birth for the foreign-born population - England (%)
Place of birth for the foreign-born population - Scotland (%)
Place of birth for the foreign-born population - Other Northern Europe (%)
Place of birth for the foreign-born population - Austria (%)
Place of birth for the foreign-born population - Belgium (%)
Place of birth for the foreign-born population - France (%)
Place of birth for the foreign-born population - Germany (%)
Place of birth for the foreign-born population - Netherlands (%)
Place of birth for the foreign-born population - Switzerland (%)
Place of birth for the foreign-born population - Other Western Europe (%)
Place of birth for the foreign-born population - Greece (%)
Place of birth for the foreign-born population - Italy (%)
Place of birth for the foreign-born population - Portugal (%)
Place of birth for the foreign-born population - Spain (%)
Place of birth for the foreign-born population - Other Southern Europe (%)
Place of birth for the foreign-born population - Albania (%)
Place of birth for the foreign-born population - Belarus (%)
Place of birth for the foreign-born population - Bosnia and Herzegovina (%)
Place of birth for the foreign-born population - Bulgaria (%)
Place of birth for the foreign-born population - Croatia (%)
Place of birth for the foreign-born population - Czechoslovakia (%)
Place of birth for the foreign-born population - Hungary (%)
Place of birth for the foreign-born population - Latvia (%)
Place of birth for the foreign-born population - Lithuania (%)
Place of birth for the foreign-born population - North Macedonia (Macedonia) (%)
Place of birth for the foreign-born population - Moldova (%)
Place of birth for the foreign-born population - Poland (%)
Place of birth for the foreign-born population - Romania (%)
Place of birth for the foreign-born population - Russia (%)
Place of birth for the foreign-born population - Serbia (%)
Place of birth for the foreign-born population - Ukraine (%)
Place of birth for the foreign-born population - Other Eastern Europe (%)
Place of birth for the foreign-born population - China (%)
Place of birth for the foreign-born population - Hong Kong (%)
Place of birth for the foreign-born population - Taiwan (%)
Place of birth for the foreign-born population - Japan (%)
Place of birth for the foreign-born population - Korea (%)
Place of birth for the foreign-born population - Other Eastern Asia (%)
Place of birth for the foreign-born population - Afghanistan (%)
Place of birth for the foreign-born population - Bangladesh (%)
Place of birth for the foreign-born population - India (%)
Place of birth for the foreign-born population - Iran (%)
Place of birth for the foreign-born population - Kazakhstan (%)
Place of birth for the foreign-born population - Nepal (%)
Place of birth for the foreign-born population - Pakistan (%)
Place of birth for the foreign-born population - Sri Lanka (%)
Place of birth for the foreign-born population - Uzbekistan (%)
Place of birth for the foreign-born population - Other South Central Asia (%)
Place of birth for the foreign-born population - Burma (%)
Place of birth for the foreign-born population - Cambodia (%)
Place of birth for the foreign-born population - Indonesia (%)
Place of birth for the foreign-born population - Laos (%)
Place of birth for the foreign-born population - Malaysia (%)
Place of birth for the foreign-born population - Philippines (%)
Place of birth for the foreign-born population - Singapore (%)
Place of birth for the foreign-born population - Thailand (%)
Place of birth for the foreign-born population - Vietnam (%)
Place of birth for the foreign-born population - Other South Eastern Asia (%)
Place of birth for the foreign-born population - Armenia (%)
Place of birth for the foreign-born population - Iraq (%)
Place of birth for the foreign-born population - Israel (%)
Place of birth for the foreign-born population - Jordan (%)
Place of birth for the foreign-born population - Kuwait (%)
Place of birth for the foreign-born population - Lebanon (%)
Place of birth for the foreign-born population - Saudi Arabia (%)
Place of birth for the foreign-born population - Syria (%)
Place of birth for the foreign-born population - Turkey (%)
Place of birth for the foreign-born population - Yemen (%)
Place of birth for the foreign-born population - Other Western Asia (%)
Place of birth for the foreign-born population - Eritrea (%)
Place of birth for the foreign-born population - Ethiopia (%)
Place of birth for the foreign-born population - Kenya (%)
Place of birth for the foreign-born population - Somalia (%)
Place of birth for the foreign-born population - Uganda (%)
Place of birth for the foreign-born population - Zimbabwe (%)
Place of birth for the foreign-born population - Other Eastern Africa (%)
Place of birth for the foreign-born population - Cameroon (%)
Place of birth for the foreign-born population - Congo (%)
Place of birth for the foreign-born population - Democratic Republic of Congo (Zaire) (%)
Place of birth for the foreign-born population - Other Middle Africa (%)
Place of birth for the foreign-born population - Egypt (%)
Place of birth for the foreign-born population - Morocco (%)
Place of birth for the foreign-born population - Sudan (%)
Place of birth for the foreign-born population - Other Northern Africa (%)
Place of birth for the foreign-born population - South Africa (%)
Place of birth for the foreign-born population - Other Southern Africa (%)
Place of birth for the foreign-born population - Cabo Verde (%)
Place of birth for the foreign-born population - Ghana (%)
Place of birth for the foreign-born population - Liberia (%)
Place of birth for the foreign-born population - Nigeria (%)
Place of birth for the foreign-born population - Senegal (%)
Place of birth for the foreign-born population - Sierra Leone (%)
Place of birth for the foreign-born population - Other Western Africa (%)
Place of birth for the foreign-born population - Australia (%)
Place of birth for the foreign-born population - New Zealand (%)
Place of birth for the foreign-born population - Fiji (%)
Place of birth for the foreign-born population - Micronesia (%)
Place of birth for the foreign-born population - Bahamas (%)
Place of birth for the foreign-born population - Barbados (%)
Place of birth for the foreign-born population - Cuba (%)
Place of birth for the foreign-born population - Dominica (%)
Place of birth for the foreign-born population - Dominican Republic (%)
Place of birth for the foreign-born population - Grenada (%)
Place of birth for the foreign-born population - Haiti (%)
Place of birth for the foreign-born population - Jamaica (%)
Place of birth for the foreign-born population - St. Vincent and the Grenadines (%)
Place of birth for the foreign-born population - Trinidad and Tobago (%)
Place of birth for the foreign-born population - West Indies (%)
Place of birth for the foreign-born population - Other Caribbean (%)
Place of birth for the foreign-born population - Belize (%)
Place of birth for the foreign-born population - Costa Rica (%)
Place of birth for the foreign-born population - El Salvador (%)
Place of birth for the foreign-born population - Guatemala (%)
Place of birth for the foreign-born population - Honduras (%)
Place of birth for the foreign-born population - Mexico (%)
Place of birth for the foreign-born population - Nicaragua (%)
Place of birth for the foreign-born population - Panama (%)
Place of birth for the foreign-born population - Other Central America (%)
Place of birth for the foreign-born population - Argentina (%)
Place of birth for the foreign-born population - Bolivia (%)
Place of birth for the foreign-born population - Brazil (%)
Place of birth for the foreign-born population - Chile (%)
Place of birth for the foreign-born population - Colombia (%)
Place of birth for the foreign-born population - Ecuador (%)
Place of birth for the foreign-born population - Guyana (%)
Place of birth for the foreign-born population - Peru (%)
Place of birth for the foreign-born population - Uruguay (%)
Place of birth for the foreign-born population - Venezuela (%)
Place of birth for the foreign-born population - Other South America (%)
Place of birth for the foreign-born population - Canada (%)
Place of birth for the foreign-born population - Other Northern America (%)
Place of birth for the foreign-born population - Other (%)
Latest news about races in Hammond, LA collected exclusively by city-data.com from local newspapers, TV, and radio stations
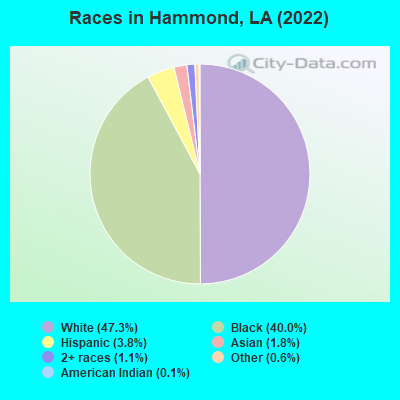
According to 2022 data, the most numerous races in Hammond, LA are White alone (9,790 residents), Black alone (8,276 residents), and Hispanic (794 residents). 95.5% of Hammond residents speak English at home. 2.3% of Hammond, LA residents are foreign-born (1.2% born in Asia, 0.7% born in Latin America), which is 77.0% less than the foreign-born rate of 4.0% across the entire state of Louisiana.
Race distribution in Hammond
2000 2022
2,794,391 62.5% White alone 1,443,390 32.3% Black alone 107,738 2.4% Hispanic 54,256 1.2% Asian alone 39,260 0.9% Two or more races 24,129 0.5% American Indian alone 4,736 0.1% Other race alone 1,076 0.02% Native Hawaiian and Other
2,603,221 56.7% White alone 1,420,055 30.9% Black alone 262,213 5.7% Hispanic 183,270 4.0% Two or more races 81,169 1.8% Asian alone 19,991 0.4% American Indian alone 18,043 0.4% Other race alone 2,279 0.05% Native Hawaiian and Other
Income and house value in Hammond Median household income in 2022 $65,577 White non-Hispanic householders$19,074 Black householders$50,617 Some other race householders$64,666 Two or more races householders$49,485 Hispanic or Latino race householdersMedian 2022 house value $264,216 White Non-Hispanic householders$149,661 Black or African American householders$356,336 American Indian or Alaska Native householders $362,935 Asian householders$171,569 Some other race householders$242,308 Two or more races householders$183,447 Hispanic or Latino householders
Median age by race in Hammond
30.1 Median age for White residents30.4 29.7 22.3 Median age for Black or African American residents22.1 29.1 -664,462,809.3 Median age for American Indian / Alaska Native residents-739,906,102.5 -781,341,107.1 28.3 Median age for Asian residents28.5 23.5 -666,666,666.0 Median age for Native Hawaiian / Pacific Islander residents-666,666,666.0 -666,666,666.0 19.5 Median age for Other race residents8.1 33.8 31.9 Median age for Two or more races residents42.1 21.2 30.2 Median age for White alone residents30.3 30.2 27.6 Median age for Hispanic or Latino residents23.0 16.9
Owner/renter occupied households by race in Hammond
House owners and renters - White residents 2,090 66.7% Owner occupied1,044 33.3% Renter occupiedHouse owners and renters - Black or African American residents 977 32.2% Owner occupied2,059 67.8% Renter occupiedHouse owners and renters - Asian residents 90 54.9% Owner occupied74 45.1% Renter occupiedHouse owners and renters - Other race residents 60 68.6% Owner occupied27 31.4% Renter occupiedHouse owners and renters - Two or more races residents 132 52.8% Owner occupied118 47.2% Renter occupiedHouse owners and renters - White alone residents 2,031 67.2% Owner occupied989 32.8% Renter occupiedHouse owners and renters - Hispanic or Latino residents 144 36.6% Owner occupied250 63.4% Renter occupied
Language usage in Hammond
English speakers - Total 95.5% of residents of Hammond speak English at home.
1.6% of residents speak Spanish at home 163 55.1% Speak English very well133 44.9% Speak English less than very well3.0% of residents speak other language at home 410 73.1% Speak English very well151 26.9% Speak English less than very well
English speakers - Born in the United States 90.2% of residents of Hammond speak English at home.
3.1% of residents speak Spanish at home 69 80.2% Speak English very well17 19.8% Speak English less than very well6.3% of residents speak other language at home 173 97.2% Speak English very well5 2.8% Speak English less than very well
English speakers - Native, born elsewhere 63.6% of residents of Hammond speak English at home.
3.0% of residents speak Spanish at home 1 100.0% Speak English very well42.4% of residents speak other language at home 14 100.0% Speak English very well
English speakers - Foreign-born 6.2% of residents of Hammond speak English at home.
31.8% of residents speak Spanish at home 28 19.6% Speak English very well115 80.4% Speak English less than very well63.6% of residents speak other language at home 158 55.2% Speak English very well128 44.8% Speak English less than very well
White (Caucasian) - Speak another language Native:
1.1% (97)Foreign-born:
89.2% (51)
Asian - Speak only English Native:
12.7% (30)Foreign-born:
10.0% (25)
Asian - Speak another language Native:
97.4% (232)Foreign-born:
90.4% (226)
Two or more races - Speak only English Native:
85.0% (456)Foreign-born:
2.0% (3)
Two or more races - Speak another language Native:
13.9% (75)Foreign-born:
96.9% (146)
White alone - Speak another language Native:
0.8% (70)Foreign-born:
99.7% (82)
Hispanic or Latino - Speak another language Native:
17.2% (87)Foreign-born:
100.0% (152)
Foreign-born residents in Hammond 468 residents are foreign born (1.2% Asia , 0.7% Latin America ).
This city:
2.3%Louisiana:
4.2%
Marital status for residents in Hammond Marital status - White (Caucasian) population 15 years and over
Males 49.8% Never married36.2% Now married0.3% Separated1.6% Widowed12.0% DivorcedFemales 43.2% Never married35.7% Now married1.3% Separated7.8% Widowed12.0% DivorcedWomen who gave birth in the past 12 months Now married:
100.0% (110)Unmarried:
0.0% (0)
Women who did not give birth in the past 12 months Now married:
27.2% (725)Unmarried:
72.8% (1,939)
Marital status - Black or African American population 15 years and over
Males 76.3% Never married14.4% Now married0.6% Separated0.8% Widowed7.9% DivorcedFemales 59.7% Never married10.5% Now married7.6% Separated16.6% Widowed5.6% DivorcedWomen who gave birth in the past 12 months Now married:
35.4% (37)Unmarried:
64.6% (67)
Women who did not give birth in the past 12 months Now married:
12.5% (281)Unmarried:
87.5% (1,965)
Marital status - American Indian / Alaska Native population 15 years and over
Males 100.0% Never married0.0% Now married0.0% Separated0.0% Widowed0.0% DivorcedFemales 100.0% Never married0.0% Now married0.0% Separated0.0% Widowed0.0% DivorcedWomen who did not give birth in the past 12 months Now married:
0.0% (0)Unmarried:
100.0% (6)
Marital status - Asian population 15 years and over
Males 57.1% Never married42.9% Now married0.0% Separated0.0% Widowed0.0% DivorcedFemales 49.0% Never married51.0% Now married0.0% Separated0.0% Widowed0.0% DivorcedWomen who gave birth in the past 12 months Now married:
100.0% (8)Unmarried:
0.0% (0)
Women who did not give birth in the past 12 months Now married:
37.7% (59)Unmarried:
62.3% (98)
Marital status - Other race population 15 years and over
Males 0.0% Never married0.0% Now married75.0% Separated0.0% Widowed25.0% DivorcedFemales 88.7% Never married4.3% Now married0.0% Separated5.2% Widowed1.7% DivorcedWomen who did not give birth in the past 12 months Now married:
0.0% (0)Unmarried:
100.0% (111)
Marital status - Two or more races population 15 years and over
Males 73.8% Never married14.1% Now married6.0% Separated0.0% Widowed6.0% DivorcedFemales 60.0% Never married24.8% Now married0.0% Separated3.4% Widowed11.7% DivorcedWomen who gave birth in the past 12 months Now married:
0.0% (0)Unmarried:
100.0% (6)
Women who did not give birth in the past 12 months Now married:
22.4% (33)Unmarried:
77.6% (116)
Marital status - White alone, not Hispanic / Latino population 15 years and over
Males 50.0% Never married37.6% Now married0.4% Separated1.4% Widowed10.6% DivorcedFemales 43.3% Never married35.5% Now married1.3% Separated7.8% Widowed12.1% DivorcedWomen who gave birth in the past 12 months Now married:
100.0% (111)Unmarried:
0.0% (0)
Women who did not give birth in the past 12 months Now married:
26.7% (709)Unmarried:
73.3% (1,943)
Marital status - Hispanic or Latino population 15 years and over
Males 60.3% Never married6.5% Now married1.0% Separated4.2% Widowed28.1% DivorcedFemales 60.6% Never married24.7% Now married0.0% Separated3.5% Widowed11.2% DivorcedWomen who did not give birth in the past 12 months Now married:
28.6% (43)Unmarried:
71.4% (107)
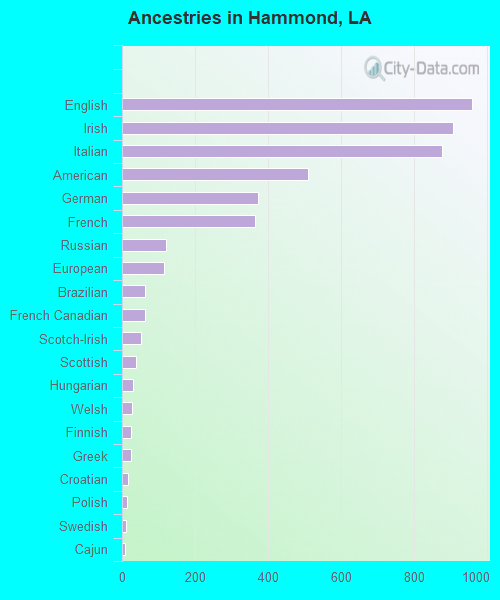
Ancestries in Hammond
957 7.3% English906 6.9% Irish875 6.7% Italian509 3.9% American373 2.8% German365 2.8% French120 0.9% Russian115 0.9% European64 0.5% Brazilian62 0.5% French Canadian53 0.4% Scotch-Irish38 0.3% Scottish31 0.2% Hungarian28 0.2% Welsh25 0.2% Finnish24 0.2% Greek17 0.1% Croatian13 0.10% Polish12 0.09% Swedish9 0.07% Cajun7 0.05% Scandinavian7 0.05% Slavic4 0.03% British
Geographical mobility in Hammond Same house 1 year ago 7,146 72.3% White (Caucasian)5,472 67.6% Black or African American370 74.1% Asian148 75.0% Other race378 77.1% Two or more races7,110 73.2% White alone, not Hispanic / Latino360 60.2% Hispanic or LatinoMoved within same county 747 7.6% White / Caucasian1,754 21.7% Black or African American27 5.4% Asian35 17.9% Other race38 7.8% Two or more races719 7.4% White alone, not Hispanic / Latino115 19.2% Hispanic or LatinoMoved within same state 1,674 16.9% White / Caucasian1,043 12.9% Black or African American23 100.0% American Indian / Alaska Native78 15.6% Asian2 1.3% Other race75 15.4% Two or more races1,624 16.7% White alone, not Hispanic / Latino102 17.0% Hispanic or LatinoMoved from different state 110 1.1% White / Caucasian47 0.6% Black or African American38 7.7% Asian111 1.1% White alone, not Hispanic / LatinoMoved from abroad 18 0.2% White10 5.1% Other race22 0.2% White alone, not Hispanic / Latino8 1.4% Hispanic or Latino
Children Nativity (place of birth) in Hammond
Children under 6 years - Living with two parents Both parents native 577 100.0% NativeBoth parents foreign-born 22 100.0% NativeOne native, one foreign-born parent 3 100.0% NativeChildren under 6 years - Living with one parent Native parent 487 100.0% NativeChildren 6 to 17 years - Living with two parents Both parents native 637 100.0% NativeBoth parents foreign-born 60 79.1% Native16 20.9% Foreign-bornOne native, one foreign-born parent 38 100.0% NativeChildren 6 to 17 years - Living with one parent Native parent 1,625 98.6% Native23 1.4% Foreign-bornForeign-born parent 22 100.0% Native
Grandparents responsible for own grandchildren in Hammond
Grandparents (30 to 59 years) White / Caucasian 9 100.0% Responsible for grandchildrenBlack or African American 150 72.6% Responsible for grandchildren57 27.4% Not responsible for grandchildrenWhite alone, not Hispanic / Latino 9 100.0% Responsible for grandchildrenGrandparents (60 years and over) White / Caucasian 123 100.0% Not responsible for grandchildrenBlack or African American 147 64.3% Responsible for grandchildren82 35.7% Not responsible for grandchildrenWhite alone, not Hispanic / Latino 126 100.0% Not responsible for grandchildren