Races in Green, Oregon (OR) Detailed Stats
Data:
Races - White alone (%)
Races - White alone (% change since 2000)
Races - Black alone (%)
Races - Black alone (% change since 2000)
Races - American Indian alone (%)
Races - American Indian alone (% change since 2000)
Races - Asian alone (%)
Races - Asian alone (% change since 2000)
Races - Hispanic (%)
Races - Hispanic (% change since 2000)
Races - Native Hawaiian and Other Pacific Islander alone (%)
Races - Native Hawaiian and Other Pacific Islander alone (% change since 2000)
Races - Two or more races(%)
Races - Two or more races(% change since 2000)
Races - Other race alone (%)
Races - Other race alone (% change since 2000)
Racial diversity
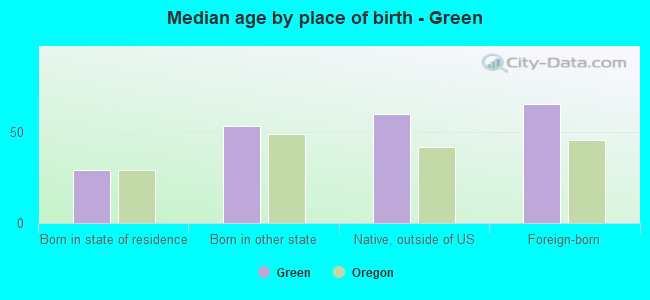
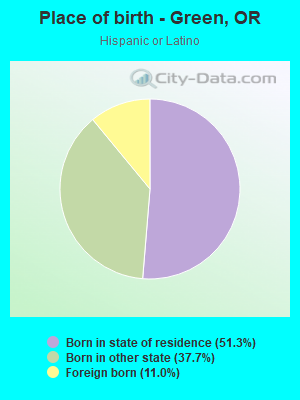
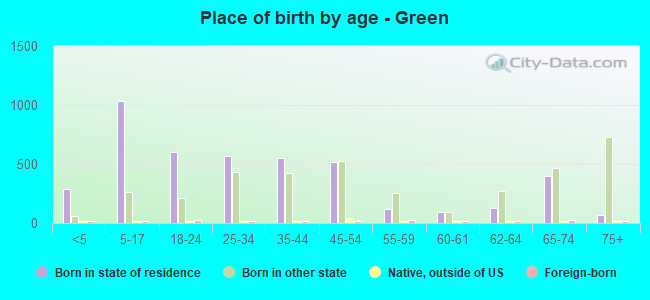
Place of birth - Born in state of residence (%)
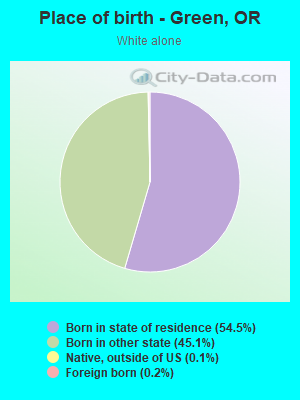
Place of birth - Born in state of residence (%) - White
Place of birth - Born in state of residence (%) - Black or African American
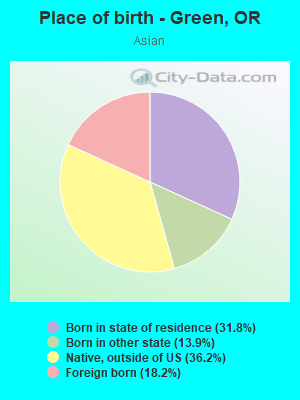
Place of birth - Born in state of residence (%) - Asian
Place of birth - Born in state of residence (%) - Hispanic or Latino
Place of birth - Born in state of residence (%) - American Indian and Alaska Native
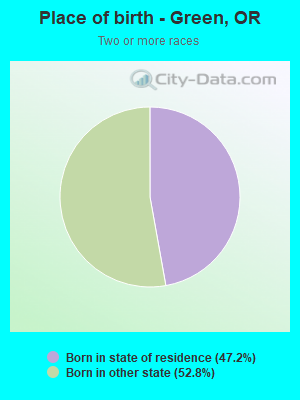
Place of birth - Born in state of residence (%) - Multirace
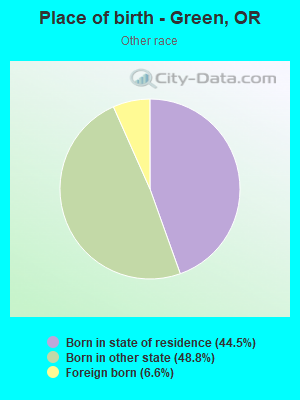
Place of birth - Born in state of residence (%) - Other Race
Place of birth - Born in other state (%)
Place of birth - Born in other state (%) - White
Place of birth - Born in other state (%) - Black or African American
Place of birth - Born in other state (%) - Asian
Place of birth - Born in other state (%) - Hispanic or Latino
Place of birth - Born in other state (%) - American Indian and Alaska Native
Place of birth - Born in other state (%) - Multirace
Place of birth - Born in other state (%) - Other Race
Place of birth - Native, outside of US (%)
Place of birth - Native, outside of US (%) - White
Place of birth - Native, outside of US (%) - Black or African American
Place of birth - Native, outside of US (%) - Asian
Place of birth - Native, outside of US (%) - Hispanic or Latino
Place of birth - Native, outside of US (%) - American Indian and Alaska Native
Place of birth - Native, outside of US (%) - Multirace
Place of birth - Native, outside of US (%) - Other Race
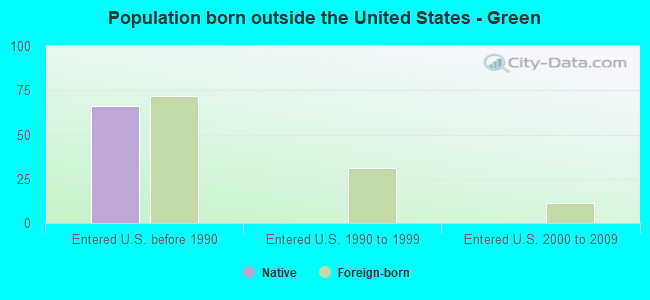
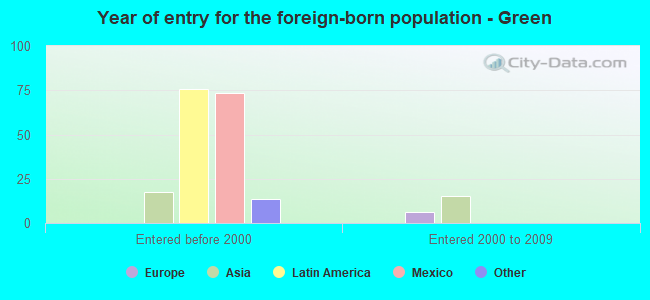
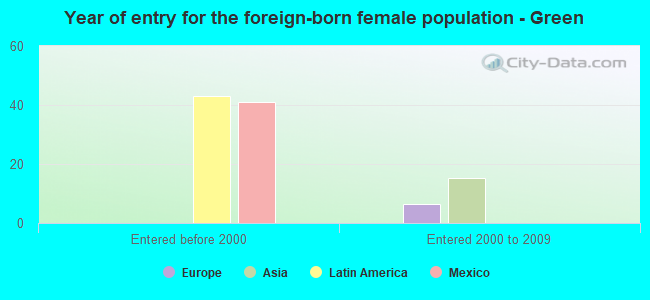
Place of birth - Foreign born (%)
Place of birth - Foreign born (%) - White
Place of birth - Foreign born (%) - Black or African American
Place of birth - Foreign born (%) - Asian
Place of birth - Foreign born (%) - Hispanic or Latino
Place of birth - Foreign born (%) - American Indian and Alaska Native
Place of birth - Foreign born (%) - Multirace
Place of birth - Foreign born (%) - Other Race
Residents speaking English at home (%)
Residents speaking English at home - Born in the United States (%)
Residents speaking English at home - Native, born elsewhere (%)
Residents speaking English at home - Foreign born (%)
Residents speaking Spanish at home (%)
Residents speaking Spanish at home - Born in the United States (%)
Residents speaking Spanish at home - Native, born elsewhere (%)
Residents speaking Spanish at home - Foreign born (%)
Residents speaking other language at home (%)
Residents speaking other language at home - Born in the United States (%)
Residents speaking other language at home - Native, born elsewhere (%)
Residents speaking other language at home - Foreign born (%)
Marital status - Never married (%)
Marital status - Now married (%)
Marital status - Separated (%)
Marital status - Widowed (%)
Marital status - Divorced (%)
Ancestries Reported - Arab (%)
Ancestries Reported - Czech (%)
Ancestries Reported - Danish (%)
Ancestries Reported - Dutch (%)
Ancestries Reported - English (%)
Ancestries Reported - French (%)
Ancestries Reported - French Canadian (%)
Ancestries Reported - German (%)
Ancestries Reported - Greek (%)
Ancestries Reported - Hungarian (%)
Ancestries Reported - Irish (%)
Ancestries Reported - Italian (%)
Ancestries Reported - Lithuanian (%)
Ancestries Reported - Norwegian (%)
Ancestries Reported - Polish (%)
Ancestries Reported - Portuguese (%)
Ancestries Reported - Russian (%)
Ancestries Reported - Scotch-Irish (%)
Ancestries Reported - Scottish (%)
Ancestries Reported - Slovak (%)
Ancestries Reported - Subsaharan African (%)
Ancestries Reported - Swedish (%)
Ancestries Reported - Swiss (%)
Ancestries Reported - Ukrainian (%)
Ancestries Reported - United States (%)
Ancestries Reported - Welsh (%)
Ancestries Reported - West Indian (%)
Ancestries Reported - Other (%)
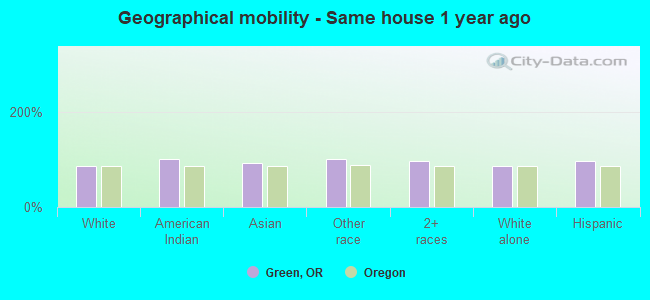
Geographical mobility - Same house 1 year ago (%)
Geographical mobility - Same house 1 year ago (%) - White
Geographical mobility - Same house 1 year ago (%) - Black or African American
Geographical mobility - Same house 1 year ago (%) - Asian
Geographical mobility - Same house 1 year ago (%) - Hispanic or Latino
Geographical mobility - Same house 1 year ago (%) - American Indian and Alaska Native
Geographical mobility - Same house 1 year ago (%) - Multirace
Geographical mobility - Same house 1 year ago (%) - Other Race
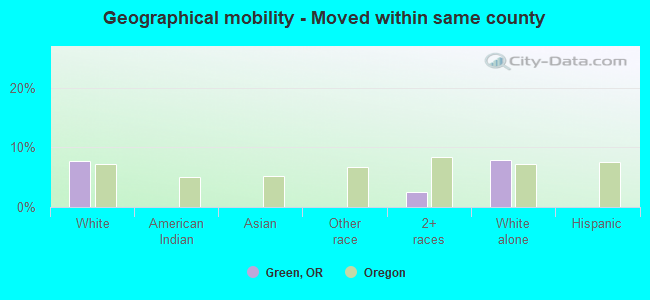
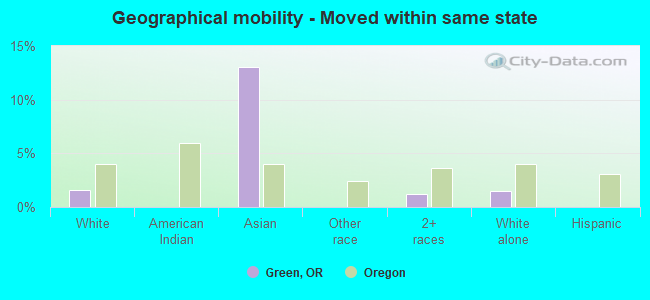
Geographical mobility - Moved within same county (%)
Geographical mobility - Moved within same county (%) - White
Geographical mobility - Moved within same county (%) - Black or African American
Geographical mobility - Moved within same county (%) - Asian
Geographical mobility - Moved within same county (%) - Hispanic or Latino
Geographical mobility - Moved within same county (%) - American Indian and Alaska Native
Geographical mobility - Moved within same county (%) - Multirace
Geographical mobility - Moved within same county (%) - Other Race
Geographical mobility - Moved from different county within same state (%)
Geographical mobility - Moved from different county within same state (%) - White
Geographical mobility - Moved from different county within same state (%) - Black or African American
Geographical mobility - Moved from different county within same state (%) - Asian
Geographical mobility - Moved from different county within same state (%) - Hispanic or Latino
Geographical mobility - Moved from different county within same state (%) - American Indian and Alaska Native
Geographical mobility - Moved from different county within same state (%) - Multirace
Geographical mobility - Moved from different county within same state (%) - Other Race
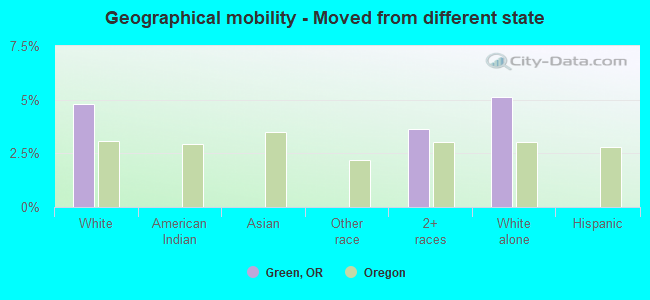
Geographical mobility - Moved from different state (%)
Geographical mobility - Moved from different state (%) - White
Geographical mobility - Moved from different state (%) - Black or African American
Geographical mobility - Moved from different state (%) - Asian
Geographical mobility - Moved from different state (%) - Hispanic or Latino
Geographical mobility - Moved from different state (%) - American Indian and Alaska Native
Geographical mobility - Moved from different state (%) - Multirace
Geographical mobility - Moved from different state (%) - Other Race
Geographical mobility - Moved from abroad (%)
Geographical mobility - Moved from abroad (%) - White
Geographical mobility - Moved from abroad (%) - Black or African American
Geographical mobility - Moved from abroad (%) - Asian
Geographical mobility - Moved from abroad (%) - Hispanic or Latino
Geographical mobility - Moved from abroad (%) - American Indian and Alaska Native
Geographical mobility - Moved from abroad (%) - Multirace
Geographical mobility - Moved from abroad (%) - Other Race
Place of birth for the foreign-born population - Ireland (%)
Place of birth for the foreign-born population - Denmark (%)
Place of birth for the foreign-born population - Norway (%)
Place of birth for the foreign-born population - Sweden (%)
Place of birth for the foreign-born population - United Kingdom (%)
Place of birth for the foreign-born population - England (%)
Place of birth for the foreign-born population - Scotland (%)
Place of birth for the foreign-born population - Other Northern Europe (%)
Place of birth for the foreign-born population - Austria (%)
Place of birth for the foreign-born population - Belgium (%)
Place of birth for the foreign-born population - France (%)
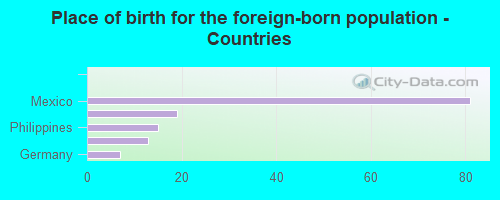
Place of birth for the foreign-born population - Germany (%)
Place of birth for the foreign-born population - Netherlands (%)
Place of birth for the foreign-born population - Switzerland (%)
Place of birth for the foreign-born population - Other Western Europe (%)
Place of birth for the foreign-born population - Greece (%)
Place of birth for the foreign-born population - Italy (%)
Place of birth for the foreign-born population - Portugal (%)
Place of birth for the foreign-born population - Spain (%)
Place of birth for the foreign-born population - Other Southern Europe (%)
Place of birth for the foreign-born population - Albania (%)
Place of birth for the foreign-born population - Belarus (%)
Place of birth for the foreign-born population - Bosnia and Herzegovina (%)
Place of birth for the foreign-born population - Bulgaria (%)
Place of birth for the foreign-born population - Croatia (%)
Place of birth for the foreign-born population - Czechoslovakia (%)
Place of birth for the foreign-born population - Hungary (%)
Place of birth for the foreign-born population - Latvia (%)
Place of birth for the foreign-born population - Lithuania (%)
Place of birth for the foreign-born population - North Macedonia (Macedonia) (%)
Place of birth for the foreign-born population - Moldova (%)
Place of birth for the foreign-born population - Poland (%)
Place of birth for the foreign-born population - Romania (%)
Place of birth for the foreign-born population - Russia (%)
Place of birth for the foreign-born population - Serbia (%)
Place of birth for the foreign-born population - Ukraine (%)
Place of birth for the foreign-born population - Other Eastern Europe (%)
Place of birth for the foreign-born population - China (%)
Place of birth for the foreign-born population - Hong Kong (%)
Place of birth for the foreign-born population - Taiwan (%)
Place of birth for the foreign-born population - Japan (%)
Place of birth for the foreign-born population - Korea (%)
Place of birth for the foreign-born population - Other Eastern Asia (%)
Place of birth for the foreign-born population - Afghanistan (%)
Place of birth for the foreign-born population - Bangladesh (%)
Place of birth for the foreign-born population - India (%)
Place of birth for the foreign-born population - Iran (%)
Place of birth for the foreign-born population - Kazakhstan (%)
Place of birth for the foreign-born population - Nepal (%)
Place of birth for the foreign-born population - Pakistan (%)
Place of birth for the foreign-born population - Sri Lanka (%)
Place of birth for the foreign-born population - Uzbekistan (%)
Place of birth for the foreign-born population - Other South Central Asia (%)
Place of birth for the foreign-born population - Burma (%)
Place of birth for the foreign-born population - Cambodia (%)
Place of birth for the foreign-born population - Indonesia (%)
Place of birth for the foreign-born population - Laos (%)
Place of birth for the foreign-born population - Malaysia (%)
Place of birth for the foreign-born population - Philippines (%)
Place of birth for the foreign-born population - Singapore (%)
Place of birth for the foreign-born population - Thailand (%)
Place of birth for the foreign-born population - Vietnam (%)
Place of birth for the foreign-born population - Other South Eastern Asia (%)
Place of birth for the foreign-born population - Armenia (%)
Place of birth for the foreign-born population - Iraq (%)
Place of birth for the foreign-born population - Israel (%)
Place of birth for the foreign-born population - Jordan (%)
Place of birth for the foreign-born population - Kuwait (%)
Place of birth for the foreign-born population - Lebanon (%)
Place of birth for the foreign-born population - Saudi Arabia (%)
Place of birth for the foreign-born population - Syria (%)
Place of birth for the foreign-born population - Turkey (%)
Place of birth for the foreign-born population - Yemen (%)
Place of birth for the foreign-born population - Other Western Asia (%)
Place of birth for the foreign-born population - Eritrea (%)
Place of birth for the foreign-born population - Ethiopia (%)
Place of birth for the foreign-born population - Kenya (%)
Place of birth for the foreign-born population - Somalia (%)
Place of birth for the foreign-born population - Uganda (%)
Place of birth for the foreign-born population - Zimbabwe (%)
Place of birth for the foreign-born population - Other Eastern Africa (%)
Place of birth for the foreign-born population - Cameroon (%)
Place of birth for the foreign-born population - Congo (%)
Place of birth for the foreign-born population - Democratic Republic of Congo (Zaire) (%)
Place of birth for the foreign-born population - Other Middle Africa (%)
Place of birth for the foreign-born population - Egypt (%)
Place of birth for the foreign-born population - Morocco (%)
Place of birth for the foreign-born population - Sudan (%)
Place of birth for the foreign-born population - Other Northern Africa (%)
Place of birth for the foreign-born population - South Africa (%)
Place of birth for the foreign-born population - Other Southern Africa (%)
Place of birth for the foreign-born population - Cabo Verde (%)
Place of birth for the foreign-born population - Ghana (%)
Place of birth for the foreign-born population - Liberia (%)
Place of birth for the foreign-born population - Nigeria (%)
Place of birth for the foreign-born population - Senegal (%)
Place of birth for the foreign-born population - Sierra Leone (%)
Place of birth for the foreign-born population - Other Western Africa (%)
Place of birth for the foreign-born population - Australia (%)
Place of birth for the foreign-born population - New Zealand (%)
Place of birth for the foreign-born population - Fiji (%)
Place of birth for the foreign-born population - Micronesia (%)
Place of birth for the foreign-born population - Bahamas (%)
Place of birth for the foreign-born population - Barbados (%)
Place of birth for the foreign-born population - Cuba (%)
Place of birth for the foreign-born population - Dominica (%)
Place of birth for the foreign-born population - Dominican Republic (%)
Place of birth for the foreign-born population - Grenada (%)
Place of birth for the foreign-born population - Haiti (%)
Place of birth for the foreign-born population - Jamaica (%)
Place of birth for the foreign-born population - St. Vincent and the Grenadines (%)
Place of birth for the foreign-born population - Trinidad and Tobago (%)
Place of birth for the foreign-born population - West Indies (%)
Place of birth for the foreign-born population - Other Caribbean (%)
Place of birth for the foreign-born population - Belize (%)
Place of birth for the foreign-born population - Costa Rica (%)
Place of birth for the foreign-born population - El Salvador (%)
Place of birth for the foreign-born population - Guatemala (%)
Place of birth for the foreign-born population - Honduras (%)
Place of birth for the foreign-born population - Mexico (%)
Place of birth for the foreign-born population - Nicaragua (%)
Place of birth for the foreign-born population - Panama (%)
Place of birth for the foreign-born population - Other Central America (%)
Place of birth for the foreign-born population - Argentina (%)
Place of birth for the foreign-born population - Bolivia (%)
Place of birth for the foreign-born population - Brazil (%)
Place of birth for the foreign-born population - Chile (%)
Place of birth for the foreign-born population - Colombia (%)
Place of birth for the foreign-born population - Ecuador (%)
Place of birth for the foreign-born population - Guyana (%)
Place of birth for the foreign-born population - Peru (%)
Place of birth for the foreign-born population - Uruguay (%)
Place of birth for the foreign-born population - Venezuela (%)
Place of birth for the foreign-born population - Other South America (%)
Place of birth for the foreign-born population - Canada (%)
Place of birth for the foreign-born population - Other Northern America (%)
Place of birth for the foreign-born population - Other (%)
Latest news about races in Green, OR collected exclusively by city-data.com from local newspapers, TV, and radio stations
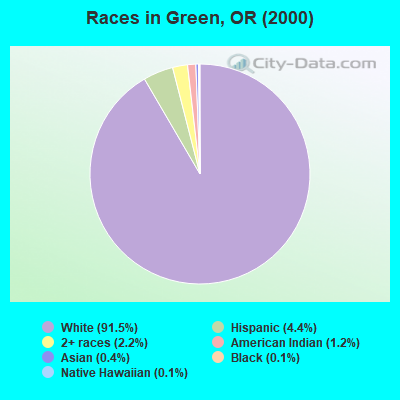
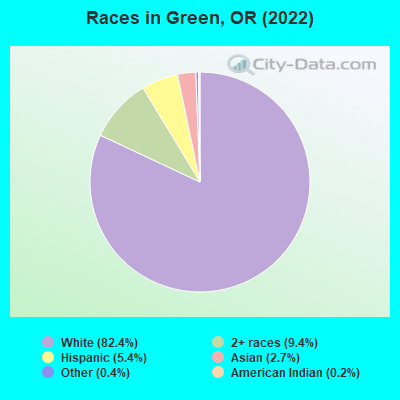
According to 2022 data, the most numerous races in Green, OR are White alone (6,777 residents), Hispanic (446 residents), and Two or more races (776 residents). 95.7% of Green residents speak English at home. 1.7% of Green, OR residents are foreign-born , which is 444.1% less than the foreign-born rate of 9.0% across the entire state of Oregon.
Race distribution in Green
2000 2022
2,857,616 83.5% White alone 275,314 8.0% Hispanic 100,333 2.9% Asian alone 82,733 2.4% Two or more races 53,325 1.6% Black alone 40,130 1.2% American Indian alone 7,398 0.2% Native Hawaiian and Other 4,550 0.1% Other race alone
3,037,571 71.6% White alone 609,538 14.4% Hispanic 252,744 6.0% Two or more races 191,283 4.5% Asian alone 78,228 1.8% Black alone 29,399 0.7% American Indian alone 25,731 0.6% Other race alone 15,643 0.4% Native Hawaiian and Other
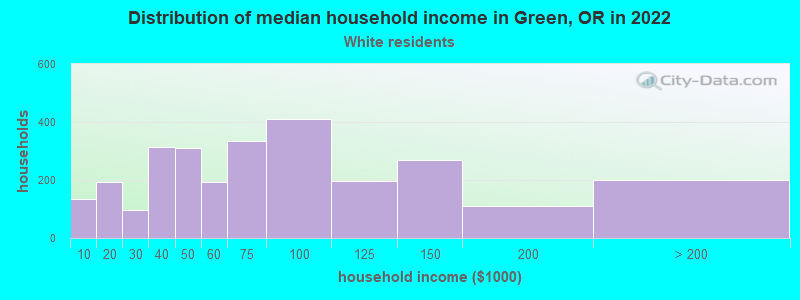
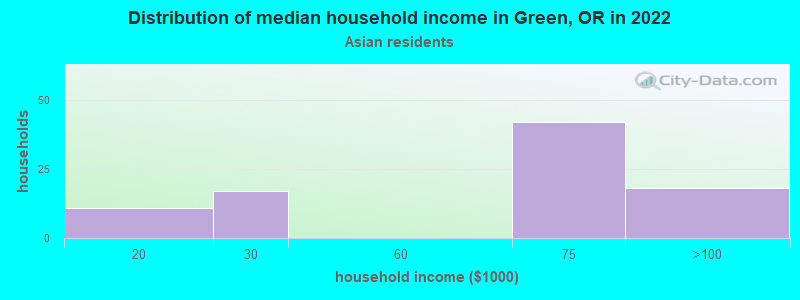
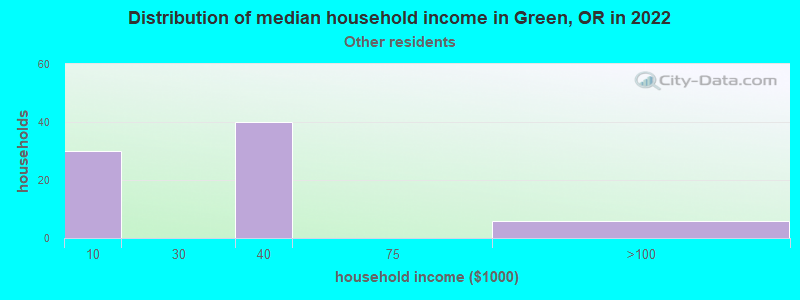
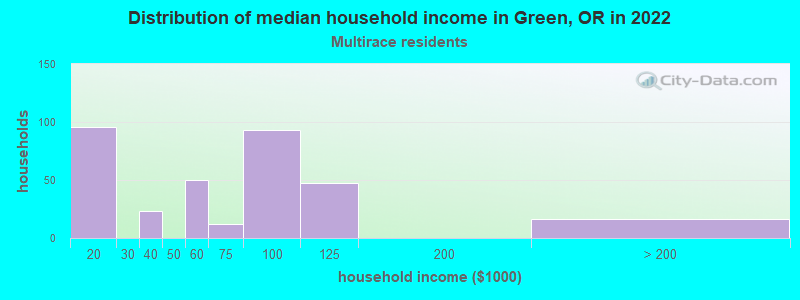
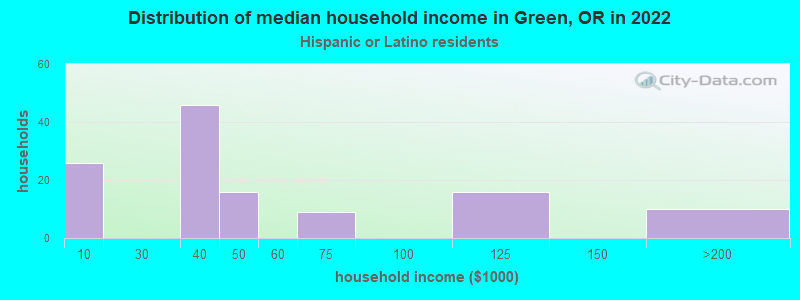
Income and house value in Green Median household income in 2022 $63,159 White non-Hispanic householders$63,449 Asian householders$17,074 Some other race householders$60,721 Two or more races householders$28,178 Hispanic or Latino race householdersMedian 2022 house value $309,218 White Non-Hispanic householders$250,430 American Indian or Alaska Native householders$249,101 Some other race householders$255,080 Two or more races householders$249,101 Hispanic or Latino householders
Median age by race in Green
45.0 Median age for White residents42.1 46.2 -664,634,145.7 Median age for Black or African American residents-692,929,292.2 -625,514,402.7 20.7 Median age for American Indian / Alaska Native residents-498,015,872.5 30.6 31.5 Median age for Asian residents20.2 50.4 -764,705,881.6 Median age for Native Hawaiian / Pacific Islander residents-666,666,666.0 -666,666,666.0 12.6 Median age for Other race residents18.1 23.8 35.3 Median age for Two or more races residents43.8 29.4 44.8 Median age for White alone residents41.9 45.8 30.9 Median age for Hispanic or Latino residents19.5 34.8
Owner/renter occupied households by race in Green
House owners and renters - White residents 2,361 84.1% Owner occupied445 15.9% Renter occupiedHouse owners and renters - American Indian / Alaska Native residents 1 100.0% Renter occupiedHouse owners and renters - Asian residents 82 100.0% Owner occupiedHouse owners and renters - Other race residents 54 87.2% Owner occupied8 12.8% Renter occupiedHouse owners and renters - Two or more races residents 220 56.3% Owner occupied171 43.7% Renter occupiedHouse owners and renters - White alone residents 2,338 83.7% Owner occupied456 16.3% Renter occupiedHouse owners and renters - Hispanic or Latino residents 104 90.7% Owner occupied11 9.3% Renter occupied
Language usage in Green
English speakers - Total 95.7% of residents of Green speak English at home.
2.9% of residents speak Spanish at home 133 58.8% Speak English very well93 41.2% Speak English less than very well1.4% of residents speak other language at home 44 40.0% Speak English very well66 60.0% Speak English less than very well
English speakers - Born in the United States 97.3% of residents of Green speak English at home.
0.2% of residents speak Spanish at home 7 100.0% Speak English less than very well2.5% of residents speak other language at home 37 40.7% Speak English very well54 59.3% Speak English less than very well
All residents speak only English at home
English speakers - Foreign-born 24.3% of residents of Green speak English at home.
61.8% of residents speak Spanish at home 19 22.6% Speak English very well65 77.4% Speak English less than very well15.4% of residents speak other language at home 6 28.6% Speak English very well15 71.4% Speak English less than very well
White (Caucasian) - Speak only English Native:
98.1% (6,414)Foreign-born:
21.1% (9)
White (Caucasian) - Speak another language Native:
1.5% (98)Foreign-born:
100.0% (43)
Asian - Speak only English Native:
93.6% (142)Foreign-born:
59.1% (20)
Asian - Speak another language Native:
7.7% (12)Foreign-born:
43.6% (15)
Other race - Speak another language Native:
5.4% (8)Foreign-born:
100.0% (25)
White alone - Speak only English Native:
99.0% (6,443)Foreign-born:
69.5% (10)
White alone - Speak another language Native:
0.9% (61)Foreign-born:
29.3% (4)
Hispanic or Latino - Speak another language Native:
42.9% (140)Foreign-born:
88.8% (43)
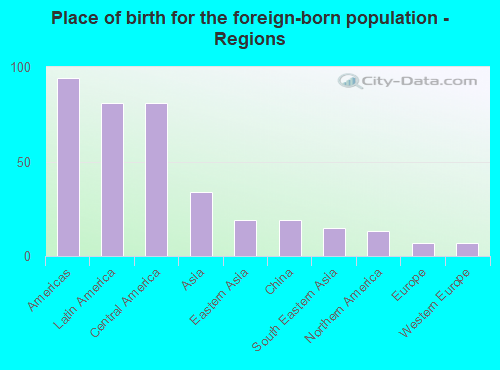
Foreign-born residents in Green 136 residents are foreign born
This city:
1.7%Oregon:
9.8%
Marital status for residents in Green Marital status - White (Caucasian) population 15 years and over
Males 31.7% Never married44.7% Now married2.3% Separated2.0% Widowed19.2% DivorcedFemales 16.0% Never married51.3% Now married1.1% Separated13.5% Widowed18.1% DivorcedWomen who did not give birth in the past 12 months Now married:
52.9% (686)Unmarried:
47.1% (610)
Marital status - Asian population 15 years and over
Males 70.9% Never married18.4% Now married0.0% Separated0.0% Widowed10.7% DivorcedFemales 16.9% Never married83.1% Now married0.0% Separated0.0% Widowed0.0% DivorcedWomen who did not give birth in the past 12 months Now married:
83.0% (46)Unmarried:
17.0% (9)
Marital status - Other race population 15 years and over
Males 87.5% Never married12.5% Now married0.0% Separated0.0% Widowed0.0% DivorcedFemales 56.3% Never married7.0% Now married0.0% Separated9.9% Widowed26.8% DivorcedWomen who did not give birth in the past 12 months Now married:
7.8% (7)Unmarried:
92.2% (81)
Marital status - Two or more races population 15 years and over
Males 52.9% Never married18.2% Now married0.0% Separated18.5% Widowed10.4% DivorcedFemales 40.8% Never married20.1% Now married0.0% Separated24.1% Widowed15.0% DivorcedWomen who did not give birth in the past 12 months Now married:
9.9% (28)Unmarried:
90.1% (251)
Marital status - White alone, not Hispanic / Latino population 15 years and over
Males 30.6% Never married45.0% Now married2.4% Separated2.1% Widowed19.9% DivorcedFemales 15.4% Never married51.5% Now married1.1% Separated13.4% Widowed18.5% DivorcedWomen who did not give birth in the past 12 months Now married:
53.9% (701)Unmarried:
46.1% (599)
Marital status - Hispanic or Latino population 15 years and over
Males 77.1% Never married22.9% Now married0.0% Separated0.0% Widowed0.0% DivorcedFemales 37.3% Never married36.7% Now married0.0% Separated10.7% Widowed15.3% DivorcedWomen who did not give birth in the past 12 months Now married:
20.6% (23)Unmarried:
79.4% (90)
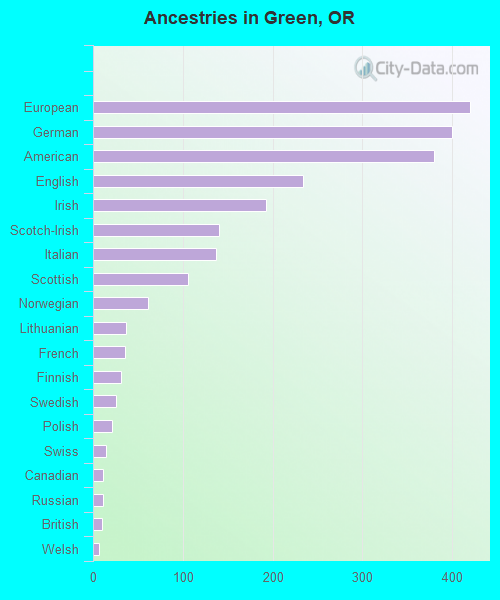
Ancestries in Green
420 12.3% European400 11.7% German380 11.1% American234 6.8% English193 5.6% Irish140 4.1% Scotch-Irish137 4.0% Italian106 3.1% Scottish61 1.8% Norwegian37 1.1% Lithuanian36 1.1% French31 0.9% Finnish26 0.8% Swedish21 0.6% Polish14 0.4% Swiss11 0.3% Canadian11 0.3% Russian10 0.3% British7 0.2% Welsh
Children Nativity (place of birth) in Green
Children under 6 years - Living with two parents Both parents native 235 100.0% NativeChildren under 6 years - Living with one parent Native parent 124 100.0% NativeForeign-born parent 21 100.0% Native
Children 6 to 17 years - Living with two parents Both parents native 506 100.0% NativeChildren 6 to 17 years - Living with one parent Native parent 570 100.0% Native
Grandparents responsible for own grandchildren in Green
Grandparents (30 to 59 years) White / Caucasian 21 100.0% Responsible for grandchildrenAmerican Indian / Alaska Native 1 62.7% Not responsible for grandchildrenTwo or more races 11 100.0% Not responsible for grandchildrenWhite alone, not Hispanic / Latino 21 100.0% Responsible for grandchildren
Grandparents (60 years and over) White / Caucasian 52 100.0% Not responsible for grandchildrenWhite alone, not Hispanic / Latino 52 100.0% Not responsible for grandchildren