Races in Glenview, Illinois (IL) Detailed Stats
Data:
Races - White alone (%)
Races - White alone (% change since 2000)
Races - Black alone (%)
Races - Black alone (% change since 2000)
Races - American Indian alone (%)
Races - American Indian alone (% change since 2000)
Races - Asian alone (%)
Races - Asian alone (% change since 2000)
Races - Hispanic (%)
Races - Hispanic (% change since 2000)
Races - Native Hawaiian and Other Pacific Islander alone (%)
Races - Native Hawaiian and Other Pacific Islander alone (% change since 2000)
Races - Two or more races(%)
Races - Two or more races(% change since 2000)
Races - Other race alone (%)
Races - Other race alone (% change since 2000)
Racial diversity
Place of birth - Born in state of residence (%)
Place of birth - Born in state of residence (%) - White
Place of birth - Born in state of residence (%) - Black or African American
Place of birth - Born in state of residence (%) - Asian
Place of birth - Born in state of residence (%) - Hispanic or Latino
Place of birth - Born in state of residence (%) - American Indian and Alaska Native
Place of birth - Born in state of residence (%) - Multirace
Place of birth - Born in state of residence (%) - Other Race
Place of birth - Born in other state (%)
Place of birth - Born in other state (%) - White
Place of birth - Born in other state (%) - Black or African American
Place of birth - Born in other state (%) - Asian
Place of birth - Born in other state (%) - Hispanic or Latino
Place of birth - Born in other state (%) - American Indian and Alaska Native
Place of birth - Born in other state (%) - Multirace
Place of birth - Born in other state (%) - Other Race
Place of birth - Native, outside of US (%)
Place of birth - Native, outside of US (%) - White
Place of birth - Native, outside of US (%) - Black or African American
Place of birth - Native, outside of US (%) - Asian
Place of birth - Native, outside of US (%) - Hispanic or Latino
Place of birth - Native, outside of US (%) - American Indian and Alaska Native
Place of birth - Native, outside of US (%) - Multirace
Place of birth - Native, outside of US (%) - Other Race
Place of birth - Foreign born (%)
Place of birth - Foreign born (%) - White
Place of birth - Foreign born (%) - Black or African American
Place of birth - Foreign born (%) - Asian
Place of birth - Foreign born (%) - Hispanic or Latino
Place of birth - Foreign born (%) - American Indian and Alaska Native
Place of birth - Foreign born (%) - Multirace
Place of birth - Foreign born (%) - Other Race
Residents speaking English at home (%)
Residents speaking English at home - Born in the United States (%)
Residents speaking English at home - Native, born elsewhere (%)
Residents speaking English at home - Foreign born (%)
Residents speaking Spanish at home (%)
Residents speaking Spanish at home - Born in the United States (%)
Residents speaking Spanish at home - Native, born elsewhere (%)
Residents speaking Spanish at home - Foreign born (%)
Residents speaking other language at home (%)
Residents speaking other language at home - Born in the United States (%)
Residents speaking other language at home - Native, born elsewhere (%)
Residents speaking other language at home - Foreign born (%)
Marital status - Never married (%)
Marital status - Now married (%)
Marital status - Separated (%)
Marital status - Widowed (%)
Marital status - Divorced (%)
Ancestries Reported - Arab (%)
Ancestries Reported - Czech (%)
Ancestries Reported - Danish (%)
Ancestries Reported - Dutch (%)
Ancestries Reported - English (%)
Ancestries Reported - French (%)
Ancestries Reported - French Canadian (%)
Ancestries Reported - German (%)
Ancestries Reported - Greek (%)
Ancestries Reported - Hungarian (%)
Ancestries Reported - Irish (%)
Ancestries Reported - Italian (%)
Ancestries Reported - Lithuanian (%)
Ancestries Reported - Norwegian (%)
Ancestries Reported - Polish (%)
Ancestries Reported - Portuguese (%)
Ancestries Reported - Russian (%)
Ancestries Reported - Scotch-Irish (%)
Ancestries Reported - Scottish (%)
Ancestries Reported - Slovak (%)
Ancestries Reported - Subsaharan African (%)
Ancestries Reported - Swedish (%)
Ancestries Reported - Swiss (%)
Ancestries Reported - Ukrainian (%)
Ancestries Reported - United States (%)
Ancestries Reported - Welsh (%)
Ancestries Reported - West Indian (%)
Ancestries Reported - Other (%)
Geographical mobility - Same house 1 year ago (%)
Geographical mobility - Same house 1 year ago (%) - White
Geographical mobility - Same house 1 year ago (%) - Black or African American
Geographical mobility - Same house 1 year ago (%) - Asian
Geographical mobility - Same house 1 year ago (%) - Hispanic or Latino
Geographical mobility - Same house 1 year ago (%) - American Indian and Alaska Native
Geographical mobility - Same house 1 year ago (%) - Multirace
Geographical mobility - Same house 1 year ago (%) - Other Race
Geographical mobility - Moved within same county (%)
Geographical mobility - Moved within same county (%) - White
Geographical mobility - Moved within same county (%) - Black or African American
Geographical mobility - Moved within same county (%) - Asian
Geographical mobility - Moved within same county (%) - Hispanic or Latino
Geographical mobility - Moved within same county (%) - American Indian and Alaska Native
Geographical mobility - Moved within same county (%) - Multirace
Geographical mobility - Moved within same county (%) - Other Race
Geographical mobility - Moved from different county within same state (%)
Geographical mobility - Moved from different county within same state (%) - White
Geographical mobility - Moved from different county within same state (%) - Black or African American
Geographical mobility - Moved from different county within same state (%) - Asian
Geographical mobility - Moved from different county within same state (%) - Hispanic or Latino
Geographical mobility - Moved from different county within same state (%) - American Indian and Alaska Native
Geographical mobility - Moved from different county within same state (%) - Multirace
Geographical mobility - Moved from different county within same state (%) - Other Race
Geographical mobility - Moved from different state (%)
Geographical mobility - Moved from different state (%) - White
Geographical mobility - Moved from different state (%) - Black or African American
Geographical mobility - Moved from different state (%) - Asian
Geographical mobility - Moved from different state (%) - Hispanic or Latino
Geographical mobility - Moved from different state (%) - American Indian and Alaska Native
Geographical mobility - Moved from different state (%) - Multirace
Geographical mobility - Moved from different state (%) - Other Race
Geographical mobility - Moved from abroad (%)
Geographical mobility - Moved from abroad (%) - White
Geographical mobility - Moved from abroad (%) - Black or African American
Geographical mobility - Moved from abroad (%) - Asian
Geographical mobility - Moved from abroad (%) - Hispanic or Latino
Geographical mobility - Moved from abroad (%) - American Indian and Alaska Native
Geographical mobility - Moved from abroad (%) - Multirace
Geographical mobility - Moved from abroad (%) - Other Race
Place of birth for the foreign-born population - Ireland (%)
Place of birth for the foreign-born population - Denmark (%)
Place of birth for the foreign-born population - Norway (%)
Place of birth for the foreign-born population - Sweden (%)
Place of birth for the foreign-born population - United Kingdom (%)
Place of birth for the foreign-born population - England (%)
Place of birth for the foreign-born population - Scotland (%)
Place of birth for the foreign-born population - Other Northern Europe (%)
Place of birth for the foreign-born population - Austria (%)
Place of birth for the foreign-born population - Belgium (%)
Place of birth for the foreign-born population - France (%)
Place of birth for the foreign-born population - Germany (%)
Place of birth for the foreign-born population - Netherlands (%)
Place of birth for the foreign-born population - Switzerland (%)
Place of birth for the foreign-born population - Other Western Europe (%)
Place of birth for the foreign-born population - Greece (%)
Place of birth for the foreign-born population - Italy (%)
Place of birth for the foreign-born population - Portugal (%)
Place of birth for the foreign-born population - Spain (%)
Place of birth for the foreign-born population - Other Southern Europe (%)
Place of birth for the foreign-born population - Albania (%)
Place of birth for the foreign-born population - Belarus (%)
Place of birth for the foreign-born population - Bosnia and Herzegovina (%)
Place of birth for the foreign-born population - Bulgaria (%)
Place of birth for the foreign-born population - Croatia (%)
Place of birth for the foreign-born population - Czechoslovakia (%)
Place of birth for the foreign-born population - Hungary (%)
Place of birth for the foreign-born population - Latvia (%)
Place of birth for the foreign-born population - Lithuania (%)
Place of birth for the foreign-born population - North Macedonia (Macedonia) (%)
Place of birth for the foreign-born population - Moldova (%)
Place of birth for the foreign-born population - Poland (%)
Place of birth for the foreign-born population - Romania (%)
Place of birth for the foreign-born population - Russia (%)
Place of birth for the foreign-born population - Serbia (%)
Place of birth for the foreign-born population - Ukraine (%)
Place of birth for the foreign-born population - Other Eastern Europe (%)
Place of birth for the foreign-born population - China (%)
Place of birth for the foreign-born population - Hong Kong (%)
Place of birth for the foreign-born population - Taiwan (%)
Place of birth for the foreign-born population - Japan (%)
Place of birth for the foreign-born population - Korea (%)
Place of birth for the foreign-born population - Other Eastern Asia (%)
Place of birth for the foreign-born population - Afghanistan (%)
Place of birth for the foreign-born population - Bangladesh (%)
Place of birth for the foreign-born population - India (%)
Place of birth for the foreign-born population - Iran (%)
Place of birth for the foreign-born population - Kazakhstan (%)
Place of birth for the foreign-born population - Nepal (%)
Place of birth for the foreign-born population - Pakistan (%)
Place of birth for the foreign-born population - Sri Lanka (%)
Place of birth for the foreign-born population - Uzbekistan (%)
Place of birth for the foreign-born population - Other South Central Asia (%)
Place of birth for the foreign-born population - Burma (%)
Place of birth for the foreign-born population - Cambodia (%)
Place of birth for the foreign-born population - Indonesia (%)
Place of birth for the foreign-born population - Laos (%)
Place of birth for the foreign-born population - Malaysia (%)
Place of birth for the foreign-born population - Philippines (%)
Place of birth for the foreign-born population - Singapore (%)
Place of birth for the foreign-born population - Thailand (%)
Place of birth for the foreign-born population - Vietnam (%)
Place of birth for the foreign-born population - Other South Eastern Asia (%)
Place of birth for the foreign-born population - Armenia (%)
Place of birth for the foreign-born population - Iraq (%)
Place of birth for the foreign-born population - Israel (%)
Place of birth for the foreign-born population - Jordan (%)
Place of birth for the foreign-born population - Kuwait (%)
Place of birth for the foreign-born population - Lebanon (%)
Place of birth for the foreign-born population - Saudi Arabia (%)
Place of birth for the foreign-born population - Syria (%)
Place of birth for the foreign-born population - Turkey (%)
Place of birth for the foreign-born population - Yemen (%)
Place of birth for the foreign-born population - Other Western Asia (%)
Place of birth for the foreign-born population - Eritrea (%)
Place of birth for the foreign-born population - Ethiopia (%)
Place of birth for the foreign-born population - Kenya (%)
Place of birth for the foreign-born population - Somalia (%)
Place of birth for the foreign-born population - Uganda (%)
Place of birth for the foreign-born population - Zimbabwe (%)
Place of birth for the foreign-born population - Other Eastern Africa (%)
Place of birth for the foreign-born population - Cameroon (%)
Place of birth for the foreign-born population - Congo (%)
Place of birth for the foreign-born population - Democratic Republic of Congo (Zaire) (%)
Place of birth for the foreign-born population - Other Middle Africa (%)
Place of birth for the foreign-born population - Egypt (%)
Place of birth for the foreign-born population - Morocco (%)
Place of birth for the foreign-born population - Sudan (%)
Place of birth for the foreign-born population - Other Northern Africa (%)
Place of birth for the foreign-born population - South Africa (%)
Place of birth for the foreign-born population - Other Southern Africa (%)
Place of birth for the foreign-born population - Cabo Verde (%)
Place of birth for the foreign-born population - Ghana (%)
Place of birth for the foreign-born population - Liberia (%)
Place of birth for the foreign-born population - Nigeria (%)
Place of birth for the foreign-born population - Senegal (%)
Place of birth for the foreign-born population - Sierra Leone (%)
Place of birth for the foreign-born population - Other Western Africa (%)
Place of birth for the foreign-born population - Australia (%)
Place of birth for the foreign-born population - New Zealand (%)
Place of birth for the foreign-born population - Fiji (%)
Place of birth for the foreign-born population - Micronesia (%)
Place of birth for the foreign-born population - Bahamas (%)
Place of birth for the foreign-born population - Barbados (%)
Place of birth for the foreign-born population - Cuba (%)
Place of birth for the foreign-born population - Dominica (%)
Place of birth for the foreign-born population - Dominican Republic (%)
Place of birth for the foreign-born population - Grenada (%)
Place of birth for the foreign-born population - Haiti (%)
Place of birth for the foreign-born population - Jamaica (%)
Place of birth for the foreign-born population - St. Vincent and the Grenadines (%)
Place of birth for the foreign-born population - Trinidad and Tobago (%)
Place of birth for the foreign-born population - West Indies (%)
Place of birth for the foreign-born population - Other Caribbean (%)
Place of birth for the foreign-born population - Belize (%)
Place of birth for the foreign-born population - Costa Rica (%)
Place of birth for the foreign-born population - El Salvador (%)
Place of birth for the foreign-born population - Guatemala (%)
Place of birth for the foreign-born population - Honduras (%)
Place of birth for the foreign-born population - Mexico (%)
Place of birth for the foreign-born population - Nicaragua (%)
Place of birth for the foreign-born population - Panama (%)
Place of birth for the foreign-born population - Other Central America (%)
Place of birth for the foreign-born population - Argentina (%)
Place of birth for the foreign-born population - Bolivia (%)
Place of birth for the foreign-born population - Brazil (%)
Place of birth for the foreign-born population - Chile (%)
Place of birth for the foreign-born population - Colombia (%)
Place of birth for the foreign-born population - Ecuador (%)
Place of birth for the foreign-born population - Guyana (%)
Place of birth for the foreign-born population - Peru (%)
Place of birth for the foreign-born population - Uruguay (%)
Place of birth for the foreign-born population - Venezuela (%)
Place of birth for the foreign-born population - Other South America (%)
Place of birth for the foreign-born population - Canada (%)
Place of birth for the foreign-born population - Other Northern America (%)
Place of birth for the foreign-born population - Other (%)
Latest news about races in Glenview, IL collected exclusively by city-data.com from local newspapers, TV, and radio stations
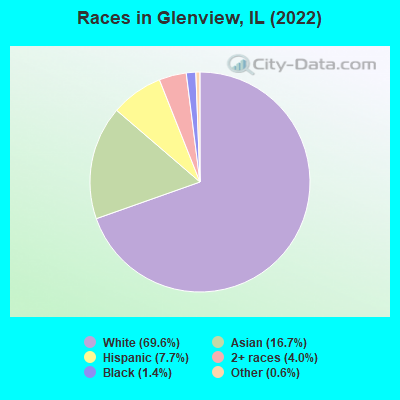
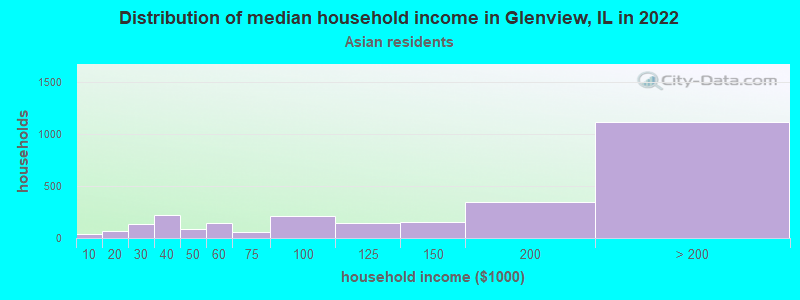
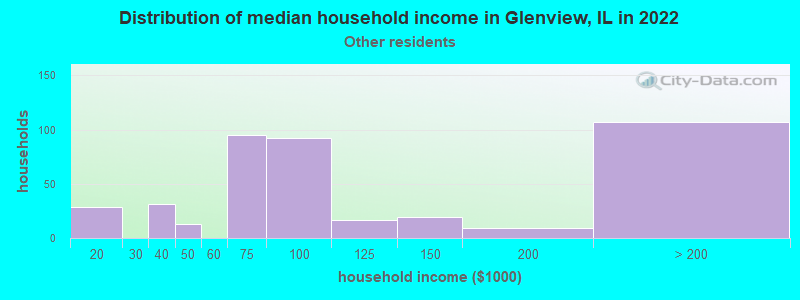
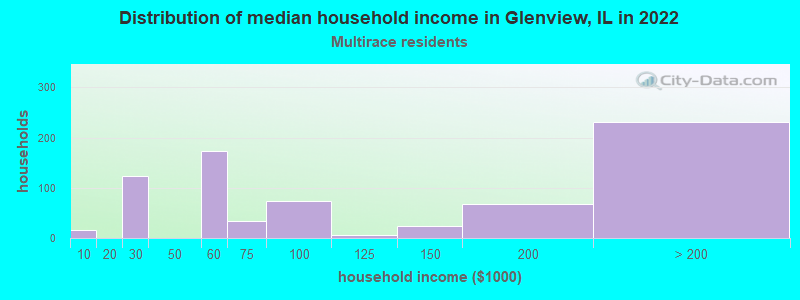
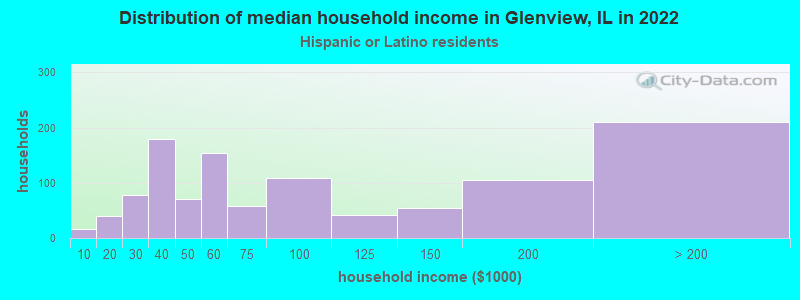
According to 2022 data, the most numerous races in Glenview, IL are White alone (32,606 residents), Hispanic (3,622 residents), and Black alone (645 residents). 70.4% of Glenview residents speak English at home. 21.9% of Glenview, IL residents are foreign-born (10.7% born in Asia, 7.4% born in Europe, 2.7% born in Latin America), which is 36.0% greater than the foreign-born rate of 14.0% across the entire state of Illinois.
Race distribution in Glenview
2000 2022
8,424,140 67.8% White alone 1,856,152 14.9% Black alone 1,530,262 12.3% Hispanic 419,916 3.4% Asian alone 153,996 1.2% Two or more races 13,479 0.1% Other race alone 18,232 0.1% American Indian alone 3,116 0.03% Native Hawaiian and Other
7,356,301 58.5% White alone 2,299,726 18.3% Hispanic 1,660,423 13.2% Black alone 747,296 5.9% Asian alone 458,599 3.6% Two or more races 45,386 0.4% Other race alone 10,405 0.08% American Indian alone 3,896 0.03% Native Hawaiian and Other
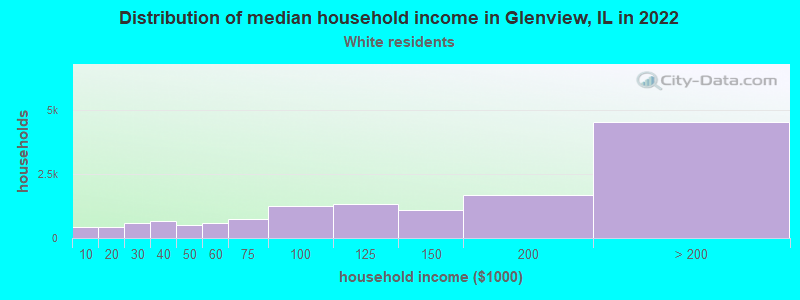
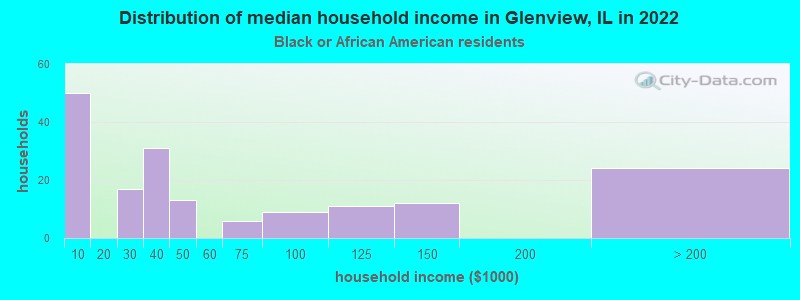
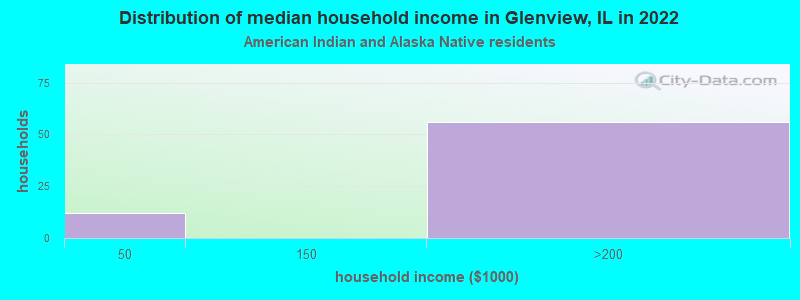
Income and house value in Glenview Median household income in 2022 $132,834 White non-Hispanic householders$154,805 Asian householders$85,963 Some other race householders$75,745 Two or more races householders$59,048 Hispanic or Latino race householdersMedian 2022 house value $679,287 White Non-Hispanic householders$342,551 Black or African American householders $698,741 Asian householders$327,710 Some other race householders$439,621 Two or more races householders$469,303 Hispanic or Latino householders
Median age by race in Glenview
52.1 Median age for White residents49.3 54.6 51.6 Median age for Black or African American residents52.0 50.0 41.7 Median age for American Indian / Alaska Native residents53.5 11.2 42.5 Median age for Asian residents42.3 42.4 -687,999,999.3 Median age for Native Hawaiian / Pacific Islander residents-918,721,460.3 -610,229,276.3 41.4 Median age for Other race residents43.6 31.5 17.3 Median age for Two or more races residents17.3 17.4 51.3 Median age for White alone residents48.4 53.8 30.8 Median age for Hispanic or Latino residents35.4 30.1
Owner/renter occupied households by race in Glenview
House owners and renters - White residents 10,879 78.7% Owner occupied2,947 21.3% Renter occupiedHouse owners and renters - Black or African American residents 82 48.7% Owner occupied86 51.3% Renter occupiedHouse owners and renters - American Indian / Alaska Native residents 71 100.0% Owner occupiedHouse owners and renters - Asian residents 2,361 86.4% Owner occupied372 13.6% Renter occupiedHouse owners and renters - Other race residents 182 43.2% Owner occupied239 56.8% Renter occupiedHouse owners and renters - Two or more races residents 411 53.7% Owner occupied354 46.3% Renter occupiedHouse owners and renters - White alone residents 11,180 78.8% Owner occupied3,007 21.2% Renter occupiedHouse owners and renters - Hispanic or Latino residents 704 61.0% Owner occupied451 39.0% Renter occupied
Language usage in Glenview
English speakers - Total 70.4% of residents of Glenview speak English at home.
5.8% of residents speak Spanish at home 1,768 68.9% Speak English very well799 31.1% Speak English less than very well23.8% of residents speak other language at home 6,688 63.9% Speak English very well3,775 36.1% Speak English less than very well
English speakers - Born in the United States 93.0% of residents of Glenview speak English at home.
3.5% of residents speak Spanish at home 207 76.1% Speak English very well65 23.9% Speak English less than very well3.5% of residents speak other language at home 269 100.0% Speak English very well
English speakers - Native, born elsewhere 59.5% of residents of Glenview speak English at home.
24.6% of residents speak Spanish at home 106 71.1% Speak English very well43 28.9% Speak English less than very well16.5% of residents speak other language at home 75 75.0% Speak English very well25 25.0% Speak English less than very well
English speakers - Foreign-born 12.7% of residents of Glenview speak English at home.
10.8% of residents speak Spanish at home 531 48.0% Speak English very well575 52.0% Speak English less than very well75.9% of residents speak other language at home 4,176 53.7% Speak English very well3,600 46.3% Speak English less than very well
White (Caucasian) - Speak only English Native:
95.2% (24,848)Foreign-born:
17.6% (598)
White (Caucasian) - Speak another language Native:
6.6% (1,734)Foreign-born:
82.6% (2,805)
Black or African American - Speak only English Native:
96.4% (464)Foreign-born:
26.0% (32)
Black or African American - Speak another language Native:
3.7% (18)Foreign-born:
71.3% (88)
American Indian / Alaska Native - Speak another language Native:
95.3% (161)Foreign-born:
100.0% (77)
Asian - Speak only English Native:
70.9% (1,817)Foreign-born:
10.0% (474)
Asian - Speak another language Native:
29.2% (749)Foreign-born:
90.2% (4,278)
Other race - Speak only English Native:
38.0% (214)Foreign-born:
3.9% (27)
Other race - Speak another language Native:
63.1% (354)Foreign-born:
96.2% (675)
Two or more races - Speak only English Native:
79.1% (1,967)Foreign-born:
22.7% (104)
Two or more races - Speak another language Native:
18.4% (459)Foreign-born:
77.4% (355)
White alone - Speak only English Native:
92.2% (25,105)Foreign-born:
15.0% (586)
White alone - Speak another language Native:
7.8% (2,117)Foreign-born:
85.1% (3,332)
Hispanic or Latino - Speak only English Native:
44.3% (914)Foreign-born:
7.0% (84)
Hispanic or Latino - Speak another language Native:
56.5% (1,165)Foreign-born:
92.7% (1,117)
Foreign-born residents in Glenview 10,245 residents are foreign born (10.7% Asia , 7.4% Europe , 2.7% Latin America ).
This city:
21.9%Illinois:
14.1%
Marital status for residents in Glenview Marital status - White (Caucasian) population 15 years and over
Males 23.0% Never married66.4% Now married1.4% Separated3.0% Widowed6.2% DivorcedFemales 20.0% Never married55.9% Now married0.6% Separated12.8% Widowed10.7% DivorcedWomen who gave birth in the past 12 months Now married:
100.0% (242)Unmarried:
0.0% (0)
Women who did not give birth in the past 12 months Now married:
53.1% (2,580)Unmarried:
46.9% (2,282)
Marital status - Black or African American population 15 years and over
Males 46.7% Never married41.5% Now married11.8% Separated0.0% Widowed0.0% DivorcedFemales 56.7% Never married18.7% Now married0.0% Separated5.2% Widowed19.3% DivorcedWomen who gave birth in the past 12 months Now married:
47.6% (9)Unmarried:
52.4% (10)
Women who did not give birth in the past 12 months Now married:
0.0% (0)Unmarried:
100.0% (109)
Marital status - American Indian / Alaska Native population 15 years and over
Males 28.3% Never married71.7% Now married0.0% Separated0.0% Widowed0.0% DivorcedFemales 0.0% Never married100.0% Now married0.0% Separated0.0% Widowed0.0% DivorcedWomen who did not give birth in the past 12 months Now married:
100.0% (47)Unmarried:
0.0% (0)
Marital status - Asian population 15 years and over
Males 22.9% Never married71.5% Now married0.4% Separated3.5% Widowed1.8% DivorcedFemales 19.7% Never married68.4% Now married1.0% Separated7.8% Widowed3.0% DivorcedWomen who gave birth in the past 12 months Now married:
100.0% (99)Unmarried:
0.0% (0)
Women who did not give birth in the past 12 months Now married:
66.2% (1,267)Unmarried:
33.8% (646)
Marital status - Other race population 15 years and over
Males 29.2% Never married63.7% Now married0.0% Separated7.1% Widowed0.0% DivorcedFemales 20.8% Never married62.7% Now married0.0% Separated8.0% Widowed8.6% DivorcedWomen who gave birth in the past 12 months Now married:
100.0% (8)Unmarried:
0.0% (0)
Women who did not give birth in the past 12 months Now married:
66.9% (269)Unmarried:
33.1% (133)
Marital status - Two or more races population 15 years and over
Males 39.6% Never married47.8% Now married0.0% Separated1.3% Widowed11.3% DivorcedFemales 43.8% Never married29.6% Now married1.6% Separated15.6% Widowed9.3% DivorcedWomen who gave birth in the past 12 months Now married:
100.0% (71)Unmarried:
0.0% (0)
Women who did not give birth in the past 12 months Now married:
19.6% (90)Unmarried:
80.4% (369)
Marital status - White alone, not Hispanic / Latino population 15 years and over
Males 22.8% Never married66.8% Now married1.3% Separated3.0% Widowed6.2% DivorcedFemales 19.5% Never married56.4% Now married0.5% Separated13.0% Widowed10.6% DivorcedWomen who gave birth in the past 12 months Now married:
100.0% (272)Unmarried:
0.0% (0)
Women who did not give birth in the past 12 months Now married:
54.3% (2,729)Unmarried:
45.7% (2,294)
Marital status - Hispanic or Latino population 15 years and over
Males 34.7% Never married54.8% Now married1.6% Separated4.4% Widowed4.4% DivorcedFemales 30.4% Never married45.0% Now married1.2% Separated10.9% Widowed12.4% DivorcedWomen who gave birth in the past 12 months Now married:
100.0% (16)Unmarried:
0.0% (0)
Women who did not give birth in the past 12 months Now married:
46.5% (410)Unmarried:
53.5% (472)
Ancestries in Glenview
2,329 10.2% Polish1,822 7.9% German1,761 7.7% Irish1,122 4.9% Greek906 3.9% Russian896 3.9% American894 3.9% European779 3.4% English665 2.9% Italian346 1.5% Romanian298 1.3% Assyrian298 1.3% Eastern European263 1.1% Ukrainian161 0.7% Swedish148 0.6% Scottish130 0.6% Bulgarian112 0.5% Lithuanian103 0.4% Iranian90 0.4% Croatian89 0.4% Serbian79 0.3% Northern European71 0.3% Dutch63 0.3% Yugoslavian61 0.3% Czech56 0.2% Welsh52 0.2% French50 0.2% Hungarian45 0.2% Norwegian39 0.2% Slovene37 0.2% Austrian37 0.2% Scotch-Irish35 0.2% Brazilian35 0.2% Armenian27 0.1% Canadian27 0.1% Ghanaian25 0.1% Nigerian25 0.1% Slovak24 0.1% Albanian24 0.1% Scandinavian23 0.1% Macedonian23 0.1% Turkish23 0.1% Latvian21 0.09% British19 0.08% Luxembourger19 0.08% Jamaican13 0.06% Iraqi12 0.05% Palestinian12 0.05% African10 0.04% Swiss7 0.03% Danish6 0.03% French Canadian5 0.02% Basque3 0.01% Finnish3 0.01% South African2 0.01% Israeli
Geographical mobility in Glenview Same house 1 year ago 27,453 89.9% White (Caucasian)540 83.6% Black or African American240 98.7% American Indian / Alaska Native6,832 87.7% Asian16 100.0% Native Hawaiian / Pacific Islander1,137 82.4% Other race3,097 91.2% Two or more races29,101 89.8% White alone, not Hispanic / Latino3,421 95.0% Hispanic or LatinoMoved within same county 2,179 7.1% White / Caucasian71 11.0% Black or African American545 7.0% Asian120 8.7% Other race189 5.6% Two or more races2,392 7.4% White alone, not Hispanic / Latino124 3.5% Hispanic or LatinoMoved within same state 205 0.7% White / Caucasian1 0.2% Black or African American67 0.9% Asian93 6.8% Other race5 0.2% Two or more races216 0.7% White alone, not Hispanic / LatinoMoved from different state 452 1.5% White / Caucasian11 1.7% Black or African American242 3.1% Asian41 3.0% Other race94 2.8% Two or more races456 1.4% White alone, not Hispanic / Latino55 1.5% Hispanic or LatinoMoved from abroad 121 0.4% White26 4.0% Black or African American83 1.1% Asian132 0.4% White alone, not Hispanic / Latino
Children Nativity (place of birth) in Glenview
Children under 6 years - Living with two parents Both parents native 1,630 100.0% NativeBoth parents foreign-born 426 100.0% NativeOne native, one foreign-born parent 529 100.0% NativeChildren under 6 years - Living with one parent Native parent 261 100.0% NativeForeign-born parent 220 90.7% Native23 9.3% Foreign-bornChildren 6 to 17 years - Living with two parents Both parents native 3,969 100.0% Native0 0.0% Foreign-bornBoth parents foreign-born 913 82.8% Native189 17.2% Foreign-bornOne native, one foreign-born parent 1,127 96.8% Native37 3.2% Foreign-bornChildren 6 to 17 years - Living with one parent Native parent 811 100.0% NativeForeign-born parent 202 51.8% Native188 48.2% Foreign-born
Place of birth for residents in Glenview 5,116 Asia3,518 Europe2,896 Eastern Europe2,651 Eastern Asia1,402 Americas1,348 South Central Asia1,269 Latin America951 Central America809 China761 South Eastern Asia354 Western Asia323 Southern Europe206 South America181 Africa166 Western Europe133 Northern Europe133 Northern America111 Caribbean57 Eastern Africa45 Western Africa38 Southern Africa25 Oceania1,680 Korea1,098 Poland1,063 India812 Mexico574 Philippines493 Ukraine461 Russia442 China277 Greece247 Taiwan244 Romania158 Germany133 Canada124 Iraq119 Hong Kong113 Bosnia and Herzegovina111 Bulgaria108 Syria107 Thailand99 El Salvador87 Iran81 Colombia79 Pakistan75 Cuba70 England63 Czechoslovakia57 Kenya54 Hungary54 Bangladesh49 Ecuador45 Italy43 United Arab Emirates40 Turkey39 Guatemala39 Uzbekistan38 South Africa37 Ireland36 Japan35 Jamaica34 Israel34 Croatia33 Brazil30 Belarus26 Vietnam26 Malaysia25 Burma (Myanmar)25 Nigeria25 Fiji25 Argentina24 United Kingdom22 North Macedonia (Macedonia)19 Ghana15 Afghanistan8 Peru7 Serbia7 France6 Bolivia5 Latvia2 Lebanon
Grandparents responsible for own grandchildren in Glenview
Grandparents (30 to 59 years) White / Caucasian 24 75.5% Responsible for grandchildren8 24.5% Not responsible for grandchildrenAsian 60 69.1% Responsible for grandchildren27 30.9% Not responsible for grandchildrenOther race 46 100.0% Not responsible for grandchildrenTwo or more races 5 100.0% Not responsible for grandchildrenWhite alone, not Hispanic / Latino 32 82.7% Responsible for grandchildren7 17.3% Not responsible for grandchildrenHispanic or Latino 42 100.0% Not responsible for grandchildrenGrandparents (60 years and over) White / Caucasian 15 8.9% Responsible for grandchildren155 91.1% Not responsible for grandchildrenAsian 99 100.0% Not responsible for grandchildrenOther race 42 100.0% Not responsible for grandchildrenWhite alone, not Hispanic / Latino 18 8.4% Responsible for grandchildren199 91.6% Not responsible for grandchildrenHispanic or Latino 41 100.0% Not responsible for grandchildren