Races in Galveston, Texas (TX) Detailed Stats
Data:
Races - White alone (%)
Races - White alone (% change since 2000)
Races - Black alone (%)
Races - Black alone (% change since 2000)
Races - American Indian alone (%)
Races - American Indian alone (% change since 2000)
Races - Asian alone (%)
Races - Asian alone (% change since 2000)
Races - Hispanic (%)
Races - Hispanic (% change since 2000)
Races - Native Hawaiian and Other Pacific Islander alone (%)
Races - Native Hawaiian and Other Pacific Islander alone (% change since 2000)
Races - Two or more races(%)
Races - Two or more races(% change since 2000)
Races - Other race alone (%)
Races - Other race alone (% change since 2000)
Racial diversity
Place of birth - Born in state of residence (%)
Place of birth - Born in state of residence (%) - White
Place of birth - Born in state of residence (%) - Black or African American
Place of birth - Born in state of residence (%) - Asian
Place of birth - Born in state of residence (%) - Hispanic or Latino
Place of birth - Born in state of residence (%) - American Indian and Alaska Native
Place of birth - Born in state of residence (%) - Multirace
Place of birth - Born in state of residence (%) - Other Race
Place of birth - Born in other state (%)
Place of birth - Born in other state (%) - White
Place of birth - Born in other state (%) - Black or African American
Place of birth - Born in other state (%) - Asian
Place of birth - Born in other state (%) - Hispanic or Latino
Place of birth - Born in other state (%) - American Indian and Alaska Native
Place of birth - Born in other state (%) - Multirace
Place of birth - Born in other state (%) - Other Race
Place of birth - Native, outside of US (%)
Place of birth - Native, outside of US (%) - White
Place of birth - Native, outside of US (%) - Black or African American
Place of birth - Native, outside of US (%) - Asian
Place of birth - Native, outside of US (%) - Hispanic or Latino
Place of birth - Native, outside of US (%) - American Indian and Alaska Native
Place of birth - Native, outside of US (%) - Multirace
Place of birth - Native, outside of US (%) - Other Race
Place of birth - Foreign born (%)
Place of birth - Foreign born (%) - White
Place of birth - Foreign born (%) - Black or African American
Place of birth - Foreign born (%) - Asian
Place of birth - Foreign born (%) - Hispanic or Latino
Place of birth - Foreign born (%) - American Indian and Alaska Native
Place of birth - Foreign born (%) - Multirace
Place of birth - Foreign born (%) - Other Race
Residents speaking English at home (%)
Residents speaking English at home - Born in the United States (%)
Residents speaking English at home - Native, born elsewhere (%)
Residents speaking English at home - Foreign born (%)
Residents speaking Spanish at home (%)
Residents speaking Spanish at home - Born in the United States (%)
Residents speaking Spanish at home - Native, born elsewhere (%)
Residents speaking Spanish at home - Foreign born (%)
Residents speaking other language at home (%)
Residents speaking other language at home - Born in the United States (%)
Residents speaking other language at home - Native, born elsewhere (%)
Residents speaking other language at home - Foreign born (%)
Marital status - Never married (%)
Marital status - Now married (%)
Marital status - Separated (%)
Marital status - Widowed (%)
Marital status - Divorced (%)
Ancestries Reported - Arab (%)
Ancestries Reported - Czech (%)
Ancestries Reported - Danish (%)
Ancestries Reported - Dutch (%)
Ancestries Reported - English (%)
Ancestries Reported - French (%)
Ancestries Reported - French Canadian (%)
Ancestries Reported - German (%)
Ancestries Reported - Greek (%)
Ancestries Reported - Hungarian (%)
Ancestries Reported - Irish (%)
Ancestries Reported - Italian (%)
Ancestries Reported - Lithuanian (%)
Ancestries Reported - Norwegian (%)
Ancestries Reported - Polish (%)
Ancestries Reported - Portuguese (%)
Ancestries Reported - Russian (%)
Ancestries Reported - Scotch-Irish (%)
Ancestries Reported - Scottish (%)
Ancestries Reported - Slovak (%)
Ancestries Reported - Subsaharan African (%)
Ancestries Reported - Swedish (%)
Ancestries Reported - Swiss (%)
Ancestries Reported - Ukrainian (%)
Ancestries Reported - United States (%)
Ancestries Reported - Welsh (%)
Ancestries Reported - West Indian (%)
Ancestries Reported - Other (%)
Geographical mobility - Same house 1 year ago (%)
Geographical mobility - Same house 1 year ago (%) - White
Geographical mobility - Same house 1 year ago (%) - Black or African American
Geographical mobility - Same house 1 year ago (%) - Asian
Geographical mobility - Same house 1 year ago (%) - Hispanic or Latino
Geographical mobility - Same house 1 year ago (%) - American Indian and Alaska Native
Geographical mobility - Same house 1 year ago (%) - Multirace
Geographical mobility - Same house 1 year ago (%) - Other Race
Geographical mobility - Moved within same county (%)
Geographical mobility - Moved within same county (%) - White
Geographical mobility - Moved within same county (%) - Black or African American
Geographical mobility - Moved within same county (%) - Asian
Geographical mobility - Moved within same county (%) - Hispanic or Latino
Geographical mobility - Moved within same county (%) - American Indian and Alaska Native
Geographical mobility - Moved within same county (%) - Multirace
Geographical mobility - Moved within same county (%) - Other Race
Geographical mobility - Moved from different county within same state (%)
Geographical mobility - Moved from different county within same state (%) - White
Geographical mobility - Moved from different county within same state (%) - Black or African American
Geographical mobility - Moved from different county within same state (%) - Asian
Geographical mobility - Moved from different county within same state (%) - Hispanic or Latino
Geographical mobility - Moved from different county within same state (%) - American Indian and Alaska Native
Geographical mobility - Moved from different county within same state (%) - Multirace
Geographical mobility - Moved from different county within same state (%) - Other Race
Geographical mobility - Moved from different state (%)
Geographical mobility - Moved from different state (%) - White
Geographical mobility - Moved from different state (%) - Black or African American
Geographical mobility - Moved from different state (%) - Asian
Geographical mobility - Moved from different state (%) - Hispanic or Latino
Geographical mobility - Moved from different state (%) - American Indian and Alaska Native
Geographical mobility - Moved from different state (%) - Multirace
Geographical mobility - Moved from different state (%) - Other Race
Geographical mobility - Moved from abroad (%)
Geographical mobility - Moved from abroad (%) - White
Geographical mobility - Moved from abroad (%) - Black or African American
Geographical mobility - Moved from abroad (%) - Asian
Geographical mobility - Moved from abroad (%) - Hispanic or Latino
Geographical mobility - Moved from abroad (%) - American Indian and Alaska Native
Geographical mobility - Moved from abroad (%) - Multirace
Geographical mobility - Moved from abroad (%) - Other Race
Place of birth for the foreign-born population - Ireland (%)
Place of birth for the foreign-born population - Denmark (%)
Place of birth for the foreign-born population - Norway (%)
Place of birth for the foreign-born population - Sweden (%)
Place of birth for the foreign-born population - United Kingdom (%)
Place of birth for the foreign-born population - England (%)
Place of birth for the foreign-born population - Scotland (%)
Place of birth for the foreign-born population - Other Northern Europe (%)
Place of birth for the foreign-born population - Austria (%)
Place of birth for the foreign-born population - Belgium (%)
Place of birth for the foreign-born population - France (%)
Place of birth for the foreign-born population - Germany (%)
Place of birth for the foreign-born population - Netherlands (%)
Place of birth for the foreign-born population - Switzerland (%)
Place of birth for the foreign-born population - Other Western Europe (%)
Place of birth for the foreign-born population - Greece (%)
Place of birth for the foreign-born population - Italy (%)
Place of birth for the foreign-born population - Portugal (%)
Place of birth for the foreign-born population - Spain (%)
Place of birth for the foreign-born population - Other Southern Europe (%)
Place of birth for the foreign-born population - Albania (%)
Place of birth for the foreign-born population - Belarus (%)
Place of birth for the foreign-born population - Bosnia and Herzegovina (%)
Place of birth for the foreign-born population - Bulgaria (%)
Place of birth for the foreign-born population - Croatia (%)
Place of birth for the foreign-born population - Czechoslovakia (%)
Place of birth for the foreign-born population - Hungary (%)
Place of birth for the foreign-born population - Latvia (%)
Place of birth for the foreign-born population - Lithuania (%)
Place of birth for the foreign-born population - North Macedonia (Macedonia) (%)
Place of birth for the foreign-born population - Moldova (%)
Place of birth for the foreign-born population - Poland (%)
Place of birth for the foreign-born population - Romania (%)
Place of birth for the foreign-born population - Russia (%)
Place of birth for the foreign-born population - Serbia (%)
Place of birth for the foreign-born population - Ukraine (%)
Place of birth for the foreign-born population - Other Eastern Europe (%)
Place of birth for the foreign-born population - China (%)
Place of birth for the foreign-born population - Hong Kong (%)
Place of birth for the foreign-born population - Taiwan (%)
Place of birth for the foreign-born population - Japan (%)
Place of birth for the foreign-born population - Korea (%)
Place of birth for the foreign-born population - Other Eastern Asia (%)
Place of birth for the foreign-born population - Afghanistan (%)
Place of birth for the foreign-born population - Bangladesh (%)
Place of birth for the foreign-born population - India (%)
Place of birth for the foreign-born population - Iran (%)
Place of birth for the foreign-born population - Kazakhstan (%)
Place of birth for the foreign-born population - Nepal (%)
Place of birth for the foreign-born population - Pakistan (%)
Place of birth for the foreign-born population - Sri Lanka (%)
Place of birth for the foreign-born population - Uzbekistan (%)
Place of birth for the foreign-born population - Other South Central Asia (%)
Place of birth for the foreign-born population - Burma (%)
Place of birth for the foreign-born population - Cambodia (%)
Place of birth for the foreign-born population - Indonesia (%)
Place of birth for the foreign-born population - Laos (%)
Place of birth for the foreign-born population - Malaysia (%)
Place of birth for the foreign-born population - Philippines (%)
Place of birth for the foreign-born population - Singapore (%)
Place of birth for the foreign-born population - Thailand (%)
Place of birth for the foreign-born population - Vietnam (%)
Place of birth for the foreign-born population - Other South Eastern Asia (%)
Place of birth for the foreign-born population - Armenia (%)
Place of birth for the foreign-born population - Iraq (%)
Place of birth for the foreign-born population - Israel (%)
Place of birth for the foreign-born population - Jordan (%)
Place of birth for the foreign-born population - Kuwait (%)
Place of birth for the foreign-born population - Lebanon (%)
Place of birth for the foreign-born population - Saudi Arabia (%)
Place of birth for the foreign-born population - Syria (%)
Place of birth for the foreign-born population - Turkey (%)
Place of birth for the foreign-born population - Yemen (%)
Place of birth for the foreign-born population - Other Western Asia (%)
Place of birth for the foreign-born population - Eritrea (%)
Place of birth for the foreign-born population - Ethiopia (%)
Place of birth for the foreign-born population - Kenya (%)
Place of birth for the foreign-born population - Somalia (%)
Place of birth for the foreign-born population - Uganda (%)
Place of birth for the foreign-born population - Zimbabwe (%)
Place of birth for the foreign-born population - Other Eastern Africa (%)
Place of birth for the foreign-born population - Cameroon (%)
Place of birth for the foreign-born population - Congo (%)
Place of birth for the foreign-born population - Democratic Republic of Congo (Zaire) (%)
Place of birth for the foreign-born population - Other Middle Africa (%)
Place of birth for the foreign-born population - Egypt (%)
Place of birth for the foreign-born population - Morocco (%)
Place of birth for the foreign-born population - Sudan (%)
Place of birth for the foreign-born population - Other Northern Africa (%)
Place of birth for the foreign-born population - South Africa (%)
Place of birth for the foreign-born population - Other Southern Africa (%)
Place of birth for the foreign-born population - Cabo Verde (%)
Place of birth for the foreign-born population - Ghana (%)
Place of birth for the foreign-born population - Liberia (%)
Place of birth for the foreign-born population - Nigeria (%)
Place of birth for the foreign-born population - Senegal (%)
Place of birth for the foreign-born population - Sierra Leone (%)
Place of birth for the foreign-born population - Other Western Africa (%)
Place of birth for the foreign-born population - Australia (%)
Place of birth for the foreign-born population - New Zealand (%)
Place of birth for the foreign-born population - Fiji (%)
Place of birth for the foreign-born population - Micronesia (%)
Place of birth for the foreign-born population - Bahamas (%)
Place of birth for the foreign-born population - Barbados (%)
Place of birth for the foreign-born population - Cuba (%)
Place of birth for the foreign-born population - Dominica (%)
Place of birth for the foreign-born population - Dominican Republic (%)
Place of birth for the foreign-born population - Grenada (%)
Place of birth for the foreign-born population - Haiti (%)
Place of birth for the foreign-born population - Jamaica (%)
Place of birth for the foreign-born population - St. Vincent and the Grenadines (%)
Place of birth for the foreign-born population - Trinidad and Tobago (%)
Place of birth for the foreign-born population - West Indies (%)
Place of birth for the foreign-born population - Other Caribbean (%)
Place of birth for the foreign-born population - Belize (%)
Place of birth for the foreign-born population - Costa Rica (%)
Place of birth for the foreign-born population - El Salvador (%)
Place of birth for the foreign-born population - Guatemala (%)
Place of birth for the foreign-born population - Honduras (%)
Place of birth for the foreign-born population - Mexico (%)
Place of birth for the foreign-born population - Nicaragua (%)
Place of birth for the foreign-born population - Panama (%)
Place of birth for the foreign-born population - Other Central America (%)
Place of birth for the foreign-born population - Argentina (%)
Place of birth for the foreign-born population - Bolivia (%)
Place of birth for the foreign-born population - Brazil (%)
Place of birth for the foreign-born population - Chile (%)
Place of birth for the foreign-born population - Colombia (%)
Place of birth for the foreign-born population - Ecuador (%)
Place of birth for the foreign-born population - Guyana (%)
Place of birth for the foreign-born population - Peru (%)
Place of birth for the foreign-born population - Uruguay (%)
Place of birth for the foreign-born population - Venezuela (%)
Place of birth for the foreign-born population - Other South America (%)
Place of birth for the foreign-born population - Canada (%)
Place of birth for the foreign-born population - Other Northern America (%)
Place of birth for the foreign-born population - Other (%)
Latest news about races in Galveston, TX collected exclusively by city-data.com from local newspapers, TV, and radio stations
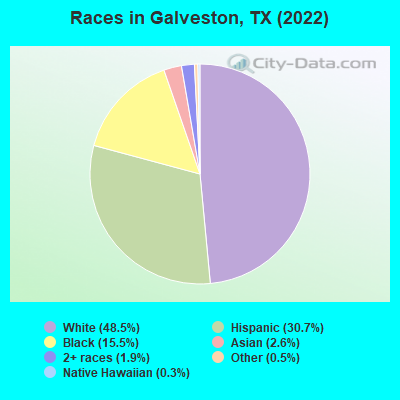
According to 2022 data, the most numerous races in Galveston, TX are Hispanic (16,668 residents), White alone (26,272 residents), and Black alone (8,405 residents). 72.8% of Galveston residents speak English at home. 13.3% of Galveston, TX residents are foreign-born (8.9% born in Latin America, 2.1% born in Asia), which is 27.7% less than the foreign-born rate of 17.0% across the entire state of Texas.
Race distribution in Galveston
2000 2022
10,933,313 52.4% White alone 6,669,666 32.0% Hispanic 2,364,255 11.3% Black alone 554,445 2.7% Asian alone 230,567 1.1% Two or more races 68,859 0.3% American Indian alone 19,958 0.10% Other race alone 10,757 0.05% Native Hawaiian and Other
12,070,642 40.2% Hispanic 11,683,430 38.9% White alone 3,508,706 11.7% Black alone 1,608,173 5.4% Asian alone 956,560 3.2% Two or more races 125,763 0.4% Other race alone 47,023 0.2% American Indian alone 29,275 0.10% Native Hawaiian and Other
Income and house value in Galveston Median household income in 2022 $63,416 White non-Hispanic householders$34,652 Black householders$81,031 American Indian and Alaska Native householders$34,527 Asian householders$44,044 Some other race householders$44,059 Two or more races householders$44,027 Hispanic or Latino race householdersMedian 2022 house value $350,649 White Non-Hispanic householders$223,214 Black or African American householders$172,483 American Indian or Alaska Native householders $339,285 Asian householders$558,035 Native Hawaiian and other Pacific Islander householders$227,678 Some other race householders$256,087 Two or more races householders$235,795 Hispanic or Latino householders
Median age by race in Galveston
44.9 Median age for White residents43.5 46.2 39.4 Median age for Black or African American residents39.3 41.7 46.3 Median age for American Indian / Alaska Native residents32.8 46.8 28.6 Median age for Asian residents28.7 29.4 25.3 Median age for Native Hawaiian / Pacific Islander residents26.7 27.9 40.9 Median age for Other race residents46.3 32.8 32.8 Median age for Two or more races residents30.1 35.9 49.6 Median age for White alone residents49.3 51.0 31.8 Median age for Hispanic or Latino residents30.2 33.9
Owner/renter occupied households by race in Galveston
House owners and renters - White residents 8,174 53.6% Owner occupied7,071 46.4% Renter occupiedHouse owners and renters - Black or African American residents 981 22.7% Owner occupied3,350 77.3% Renter occupiedHouse owners and renters - American Indian / Alaska Native residents 7 3.9% Owner occupied180 96.1% Renter occupiedHouse owners and renters - Asian residents 185 24.4% Owner occupied575 75.6% Renter occupiedHouse owners and renters - Native Hawaiian / Pacific Islander residents 103 100.0% Renter occupiedHouse owners and renters - Other race residents 705 66.2% Owner occupied360 33.8% Renter occupiedHouse owners and renters - Two or more races residents 1,692 47.2% Owner occupied1,895 52.8% Renter occupiedHouse owners and renters - White alone residents 7,751 55.6% Owner occupied6,188 44.4% Renter occupiedHouse owners and renters - Hispanic or Latino residents 2,476 44.9% Owner occupied3,042 55.1% Renter occupied
Language usage in Galveston
English speakers - Total 72.8% of residents of Galveston speak English at home.
21.7% of residents speak Spanish at home 6,821 60.4% Speak English very well4,470 39.6% Speak English less than very well6.1% of residents speak other language at home 2,311 73.3% Speak English very well841 26.7% Speak English less than very well
English speakers - Born in the United States 90.7% of residents of Galveston speak English at home.
5.7% of residents speak Spanish at home 678 84.9% Speak English very well121 15.1% Speak English less than very well3.6% of residents speak other language at home 506 98.6% Speak English very well7 1.4% Speak English less than very well
English speakers - Native, born elsewhere 39.1% of residents of Galveston speak English at home.
46.9% of residents speak Spanish at home 340 87.9% Speak English very well47 12.1% Speak English less than very well26.6% of residents speak other language at home 82 37.3% Speak English very well138 62.7% Speak English less than very well
English speakers - Foreign-born 13.5% of residents of Galveston speak English at home.
64.8% of residents speak Spanish at home 1,607 31.7% Speak English very well3,464 68.3% Speak English less than very well22.0% of residents speak other language at home 1,096 63.8% Speak English very well622 36.2% Speak English less than very well
White (Caucasian) - Speak only English Native:
89.6% (23,917)Foreign-born:
29.7% (696)
White (Caucasian) - Speak another language Native:
8.2% (2,187)Foreign-born:
62.2% (1,458)
Black or African American - Speak only English Native:
95.1% (7,952)Foreign-born:
52.8% (101)
Black or African American - Speak another language Native:
4.6% (381)Foreign-born:
18.3% (35)
American Indian / Alaska Native - Speak another language Native:
2.8% (10)Foreign-born:
98.9% (70)
Asian - Speak only English Native:
36.7% (258)Foreign-born:
13.1% (94)
Asian - Speak another language Native:
62.8% (442)Foreign-born:
86.6% (620)
Native Hawaiian / Pacific Islander - Speak another language Native:
43.1% (83)Foreign-born:
100.0% (17)
Other race - Speak only English Native:
65.3% (1,157)Foreign-born:
11.3% (76)
Other race - Speak another language Native:
36.6% (648)Foreign-born:
88.0% (596)
Two or more races - Speak only English Native:
52.7% (3,447)Foreign-born:
3.1% (129)
Two or more races - Speak another language Native:
49.5% (3,241)Foreign-born:
98.0% (4,030)
White alone - Speak only English Native:
95.5% (22,734)Foreign-born:
37.5% (687)
White alone - Speak another language Native:
4.2% (992)Foreign-born:
62.8% (1,152)
Hispanic or Latino - Speak only English Native:
48.1% (5,086)Foreign-born:
5.0% (265)
Hispanic or Latino - Speak another language Native:
52.1% (5,509)Foreign-born:
94.8% (4,980)
Foreign-born residents in Galveston 7,218 residents are foreign born (8.9% Latin America , 2.1% Asia ).
This city:
13.3%Texas:
17.1%
Marital status for residents in Galveston Marital status - White (Caucasian) population 15 years and over
Males 38.6% Never married43.8% Now married1.2% Separated2.8% Widowed13.6% DivorcedFemales 29.6% Never married45.3% Now married2.7% Separated8.4% Widowed14.0% DivorcedWomen who gave birth in the past 12 months Now married:
84.9% (322)Unmarried:
15.1% (57)
Women who did not give birth in the past 12 months Now married:
39.0% (2,319)Unmarried:
61.0% (3,622)
Marital status - Black or African American population 15 years and over
Males 50.4% Never married20.5% Now married3.3% Separated5.0% Widowed20.7% DivorcedFemales 52.2% Never married16.5% Now married2.6% Separated8.8% Widowed19.9% DivorcedWomen who gave birth in the past 12 months Now married:
4.1% (7)Unmarried:
95.9% (171)
Women who did not give birth in the past 12 months Now married:
14.0% (306)Unmarried:
86.0% (1,874)
Marital status - American Indian / Alaska Native population 15 years and over
Males 61.9% Never married18.1% Now married8.1% Separated11.9% Widowed0.0% DivorcedFemales 8.8% Never married44.2% Now married0.0% Separated0.0% Widowed46.9% DivorcedWomen who did not give birth in the past 12 months Now married:
40.4% (57)Unmarried:
59.6% (85)
Marital status - Asian population 15 years and over
Males 57.1% Never married32.3% Now married0.0% Separated5.7% Widowed4.9% DivorcedFemales 58.2% Never married36.0% Now married0.0% Separated3.2% Widowed2.6% DivorcedWomen who gave birth in the past 12 months Now married:
100.0% (4)Unmarried:
0.0% (0)
Women who did not give birth in the past 12 months Now married:
29.7% (194)Unmarried:
70.3% (459)
Marital status - Native Hawaiian / Pacific Islander population 15 years and over
Males 89.5% Never married10.5% Now married0.0% Separated0.0% Widowed0.0% DivorcedFemales 35.3% Never married64.7% Now married0.0% Separated0.0% Widowed0.0% DivorcedWomen who gave birth in the past 12 months Now married:
100.0% (13)Unmarried:
0.0% (0)
Women who did not give birth in the past 12 months Now married:
0.0% (0)Unmarried:
100.0% (7)
Marital status - Other race population 15 years and over
Males 39.2% Never married46.3% Now married0.0% Separated1.2% Widowed13.4% DivorcedFemales 48.4% Never married38.5% Now married0.5% Separated4.1% Widowed8.6% DivorcedWomen who gave birth in the past 12 months Now married:
100.0% (26)Unmarried:
0.0% (0)
Women who did not give birth in the past 12 months Now married:
28.4% (211)Unmarried:
71.6% (534)
Marital status - Two or more races population 15 years and over
Males 47.6% Never married37.4% Now married3.9% Separated1.2% Widowed10.0% DivorcedFemales 33.9% Never married40.5% Now married5.5% Separated6.8% Widowed13.3% DivorcedWomen who gave birth in the past 12 months Now married:
96.0% (144)Unmarried:
4.0% (6)
Women who did not give birth in the past 12 months Now married:
37.1% (930)Unmarried:
62.9% (1,577)
Marital status - White alone, not Hispanic / Latino population 15 years and over
Males 34.3% Never married46.8% Now married1.4% Separated3.2% Widowed14.4% DivorcedFemales 27.3% Never married46.2% Now married2.1% Separated9.0% Widowed15.4% DivorcedWomen who gave birth in the past 12 months Now married:
87.0% (284)Unmarried:
13.0% (42)
Women who did not give birth in the past 12 months Now married:
38.0% (1,818)Unmarried:
62.0% (2,961)
Marital status - Hispanic or Latino population 15 years and over
Males 50.2% Never married35.7% Now married1.7% Separated1.6% Widowed10.7% DivorcedFemales 36.3% Never married40.6% Now married5.1% Separated6.3% Widowed11.6% DivorcedWomen who gave birth in the past 12 months Now married:
87.9% (199)Unmarried:
12.1% (28)
Women who did not give birth in the past 12 months Now married:
38.8% (1,582)Unmarried:
61.2% (2,496)
Ancestries in Galveston
1,854 6.3% English1,674 5.7% German1,620 5.5% Irish804 2.7% American761 2.6% Italian530 1.8% European432 1.5% French227 0.8% African219 0.7% Scottish190 0.6% Norwegian148 0.5% British141 0.5% Greek140 0.5% Iranian130 0.4% Polish121 0.4% Czech120 0.4% Scotch-Irish110 0.4% Palestinian106 0.4% Ghanaian105 0.4% Welsh98 0.3% Scandinavian95 0.3% Dutch91 0.3% Ukrainian90 0.3% Canadian85 0.3% Romanian83 0.3% Russian82 0.3% French Canadian78 0.3% Pennsylvania German68 0.2% Eastern European67 0.2% Danish62 0.2% Hungarian59 0.2% Trinidadian and Tobagonian47 0.2% Cajun47 0.2% Turkish38 0.1% Swedish33 0.1% Northern European33 0.1% Lebanese31 0.1% Finnish29 0.10% Moroccan29 0.10% Czechoslovakian28 0.10% Jamaican26 0.09% Egyptian25 0.09% Nigerian24 0.08% Jordanian21 0.07% Arab21 0.07% Austrian16 0.05% Croatian15 0.05% U.S. Virgin Islander13 0.04% Portuguese12 0.04% Slovene11 0.04% Slovak11 0.04% Israeli11 0.04% Lithuanian10 0.03% Brazilian9 0.03% Belgian8 0.03% Bulgarian6 0.02% Cypriot5 0.02% Yugoslavian
Geographical mobility in Galveston Same house 1 year ago 23,648 77.8% White (Caucasian)6,906 81.5% Black or African American308 73.3% American Indian / Alaska Native1,064 72.4% Asian48 22.9% Native Hawaiian / Pacific Islander2,400 95.5% Other race8,350 78.3% Two or more races20,508 78.5% White alone, not Hispanic / Latino12,873 78.2% Hispanic or LatinoMoved within same county 2,211 7.3% White / Caucasian1,214 14.3% Black or African American65 15.6% American Indian / Alaska Native86 5.9% Asian3 1.6% Native Hawaiian / Pacific Islander61 2.4% Other race1,046 9.8% Two or more races1,917 7.3% White alone, not Hispanic / Latino1,599 9.7% Hispanic or LatinoMoved within same state 2,421 8.0% White / Caucasian337 4.0% Black or African American20 4.9% American Indian / Alaska Native275 18.7% Asian228 100.0% Native Hawaiian / Pacific Islander78 3.1% Other race877 8.2% Two or more races2,060 7.9% White alone, not Hispanic / Latino1,266 7.7% Hispanic or LatinoMoved from different state 1,145 3.8% White / Caucasian20 0.2% Black or African American17 4.1% American Indian / Alaska Native12 0.8% Asian8 0.3% Other race93 0.9% Two or more races1,091 4.2% White alone, not Hispanic / Latino225 1.4% Hispanic or LatinoMoved from abroad 317 1.0% White28 0.3% Black or African American42 2.9% Asian270 2.5% Two or more races105 0.4% White alone, not Hispanic / Latino236 1.4% Hispanic or Latino
Children Nativity (place of birth) in Galveston
Children under 6 years - Living with two parents Both parents native 1,287 100.0% NativeBoth parents foreign-born 371 100.0% NativeOne native, one foreign-born parent 214 100.0% NativeChildren under 6 years - Living with one parent Native parent 856 99.4% Native5 0.6% Foreign-bornForeign-born parent 27 71.3% Native11 28.7% Foreign-bornChildren 6 to 17 years - Living with two parents Both parents native 1,353 93.8% Native89 6.2% Foreign-bornBoth parents foreign-born 637 68.5% Native292 31.5% Foreign-bornOne native, one foreign-born parent 294 95.2% Native15 4.8% Foreign-bornChildren 6 to 17 years - Living with one parent Native parent 1,844 99.8% Native4 0.2% Foreign-bornForeign-born parent 441 63.9% Native248 36.1% Foreign-born
Grandparents responsible for own grandchildren in Galveston
Grandparents (30 to 59 years) White / Caucasian 61 22.3% Responsible for grandchildren213 77.7% Not responsible for grandchildrenBlack or African American 45 79.2% Responsible for grandchildren12 20.8% Not responsible for grandchildrenOther race 8 100.0% Responsible for grandchildrenTwo or more races 52 100.0% Not responsible for grandchildrenWhite alone, not Hispanic / Latino 12 4.8% Responsible for grandchildren245 95.2% Not responsible for grandchildrenHispanic or Latino 73 55.9% Responsible for grandchildren57 44.1% Not responsible for grandchildrenGrandparents (60 years and over) White / Caucasian 45 44.1% Responsible for grandchildren57 55.9% Not responsible for grandchildrenBlack or African American 17 100.0% Responsible for grandchildrenOther race 14 100.0% Responsible for grandchildrenTwo or more races 8 7.4% Responsible for grandchildren102 92.6% Not responsible for grandchildrenWhite alone, not Hispanic / Latino 48 59.1% Responsible for grandchildren33 40.9% Not responsible for grandchildrenHispanic or Latino 27 16.2% Responsible for grandchildren138 83.8% Not responsible for grandchildren