Races in Frisco, Texas (TX) Detailed Stats
Data:
Races - White alone (%)
Races - White alone (% change since 2000)
Races - Black alone (%)
Races - Black alone (% change since 2000)
Races - American Indian alone (%)
Races - American Indian alone (% change since 2000)
Races - Asian alone (%)
Races - Asian alone (% change since 2000)
Races - Hispanic (%)
Races - Hispanic (% change since 2000)
Races - Native Hawaiian and Other Pacific Islander alone (%)
Races - Native Hawaiian and Other Pacific Islander alone (% change since 2000)
Races - Two or more races(%)
Races - Two or more races(% change since 2000)
Races - Other race alone (%)
Races - Other race alone (% change since 2000)
Racial diversity
Place of birth - Born in state of residence (%)
Place of birth - Born in state of residence (%) - White
Place of birth - Born in state of residence (%) - Black or African American
Place of birth - Born in state of residence (%) - Asian
Place of birth - Born in state of residence (%) - Hispanic or Latino
Place of birth - Born in state of residence (%) - American Indian and Alaska Native
Place of birth - Born in state of residence (%) - Multirace
Place of birth - Born in state of residence (%) - Other Race
Place of birth - Born in other state (%)
Place of birth - Born in other state (%) - White
Place of birth - Born in other state (%) - Black or African American
Place of birth - Born in other state (%) - Asian
Place of birth - Born in other state (%) - Hispanic or Latino
Place of birth - Born in other state (%) - American Indian and Alaska Native
Place of birth - Born in other state (%) - Multirace
Place of birth - Born in other state (%) - Other Race
Place of birth - Native, outside of US (%)
Place of birth - Native, outside of US (%) - White
Place of birth - Native, outside of US (%) - Black or African American
Place of birth - Native, outside of US (%) - Asian
Place of birth - Native, outside of US (%) - Hispanic or Latino
Place of birth - Native, outside of US (%) - American Indian and Alaska Native
Place of birth - Native, outside of US (%) - Multirace
Place of birth - Native, outside of US (%) - Other Race
Place of birth - Foreign born (%)
Place of birth - Foreign born (%) - White
Place of birth - Foreign born (%) - Black or African American
Place of birth - Foreign born (%) - Asian
Place of birth - Foreign born (%) - Hispanic or Latino
Place of birth - Foreign born (%) - American Indian and Alaska Native
Place of birth - Foreign born (%) - Multirace
Place of birth - Foreign born (%) - Other Race
Residents speaking English at home (%)
Residents speaking English at home - Born in the United States (%)
Residents speaking English at home - Native, born elsewhere (%)
Residents speaking English at home - Foreign born (%)
Residents speaking Spanish at home (%)
Residents speaking Spanish at home - Born in the United States (%)
Residents speaking Spanish at home - Native, born elsewhere (%)
Residents speaking Spanish at home - Foreign born (%)
Residents speaking other language at home (%)
Residents speaking other language at home - Born in the United States (%)
Residents speaking other language at home - Native, born elsewhere (%)
Residents speaking other language at home - Foreign born (%)
Marital status - Never married (%)
Marital status - Now married (%)
Marital status - Separated (%)
Marital status - Widowed (%)
Marital status - Divorced (%)
Ancestries Reported - Arab (%)
Ancestries Reported - Czech (%)
Ancestries Reported - Danish (%)
Ancestries Reported - Dutch (%)
Ancestries Reported - English (%)
Ancestries Reported - French (%)
Ancestries Reported - French Canadian (%)
Ancestries Reported - German (%)
Ancestries Reported - Greek (%)
Ancestries Reported - Hungarian (%)
Ancestries Reported - Irish (%)
Ancestries Reported - Italian (%)
Ancestries Reported - Lithuanian (%)
Ancestries Reported - Norwegian (%)
Ancestries Reported - Polish (%)
Ancestries Reported - Portuguese (%)
Ancestries Reported - Russian (%)
Ancestries Reported - Scotch-Irish (%)
Ancestries Reported - Scottish (%)
Ancestries Reported - Slovak (%)
Ancestries Reported - Subsaharan African (%)
Ancestries Reported - Swedish (%)
Ancestries Reported - Swiss (%)
Ancestries Reported - Ukrainian (%)
Ancestries Reported - United States (%)
Ancestries Reported - Welsh (%)
Ancestries Reported - West Indian (%)
Ancestries Reported - Other (%)
Geographical mobility - Same house 1 year ago (%)
Geographical mobility - Same house 1 year ago (%) - White
Geographical mobility - Same house 1 year ago (%) - Black or African American
Geographical mobility - Same house 1 year ago (%) - Asian
Geographical mobility - Same house 1 year ago (%) - Hispanic or Latino
Geographical mobility - Same house 1 year ago (%) - American Indian and Alaska Native
Geographical mobility - Same house 1 year ago (%) - Multirace
Geographical mobility - Same house 1 year ago (%) - Other Race
Geographical mobility - Moved within same county (%)
Geographical mobility - Moved within same county (%) - White
Geographical mobility - Moved within same county (%) - Black or African American
Geographical mobility - Moved within same county (%) - Asian
Geographical mobility - Moved within same county (%) - Hispanic or Latino
Geographical mobility - Moved within same county (%) - American Indian and Alaska Native
Geographical mobility - Moved within same county (%) - Multirace
Geographical mobility - Moved within same county (%) - Other Race
Geographical mobility - Moved from different county within same state (%)
Geographical mobility - Moved from different county within same state (%) - White
Geographical mobility - Moved from different county within same state (%) - Black or African American
Geographical mobility - Moved from different county within same state (%) - Asian
Geographical mobility - Moved from different county within same state (%) - Hispanic or Latino
Geographical mobility - Moved from different county within same state (%) - American Indian and Alaska Native
Geographical mobility - Moved from different county within same state (%) - Multirace
Geographical mobility - Moved from different county within same state (%) - Other Race
Geographical mobility - Moved from different state (%)
Geographical mobility - Moved from different state (%) - White
Geographical mobility - Moved from different state (%) - Black or African American
Geographical mobility - Moved from different state (%) - Asian
Geographical mobility - Moved from different state (%) - Hispanic or Latino
Geographical mobility - Moved from different state (%) - American Indian and Alaska Native
Geographical mobility - Moved from different state (%) - Multirace
Geographical mobility - Moved from different state (%) - Other Race
Geographical mobility - Moved from abroad (%)
Geographical mobility - Moved from abroad (%) - White
Geographical mobility - Moved from abroad (%) - Black or African American
Geographical mobility - Moved from abroad (%) - Asian
Geographical mobility - Moved from abroad (%) - Hispanic or Latino
Geographical mobility - Moved from abroad (%) - American Indian and Alaska Native
Geographical mobility - Moved from abroad (%) - Multirace
Geographical mobility - Moved from abroad (%) - Other Race
Place of birth for the foreign-born population - Ireland (%)
Place of birth for the foreign-born population - Denmark (%)
Place of birth for the foreign-born population - Norway (%)
Place of birth for the foreign-born population - Sweden (%)
Place of birth for the foreign-born population - United Kingdom (%)
Place of birth for the foreign-born population - England (%)
Place of birth for the foreign-born population - Scotland (%)
Place of birth for the foreign-born population - Other Northern Europe (%)
Place of birth for the foreign-born population - Austria (%)
Place of birth for the foreign-born population - Belgium (%)
Place of birth for the foreign-born population - France (%)
Place of birth for the foreign-born population - Germany (%)
Place of birth for the foreign-born population - Netherlands (%)
Place of birth for the foreign-born population - Switzerland (%)
Place of birth for the foreign-born population - Other Western Europe (%)
Place of birth for the foreign-born population - Greece (%)
Place of birth for the foreign-born population - Italy (%)
Place of birth for the foreign-born population - Portugal (%)
Place of birth for the foreign-born population - Spain (%)
Place of birth for the foreign-born population - Other Southern Europe (%)
Place of birth for the foreign-born population - Albania (%)
Place of birth for the foreign-born population - Belarus (%)
Place of birth for the foreign-born population - Bosnia and Herzegovina (%)
Place of birth for the foreign-born population - Bulgaria (%)
Place of birth for the foreign-born population - Croatia (%)
Place of birth for the foreign-born population - Czechoslovakia (%)
Place of birth for the foreign-born population - Hungary (%)
Place of birth for the foreign-born population - Latvia (%)
Place of birth for the foreign-born population - Lithuania (%)
Place of birth for the foreign-born population - North Macedonia (Macedonia) (%)
Place of birth for the foreign-born population - Moldova (%)
Place of birth for the foreign-born population - Poland (%)
Place of birth for the foreign-born population - Romania (%)
Place of birth for the foreign-born population - Russia (%)
Place of birth for the foreign-born population - Serbia (%)
Place of birth for the foreign-born population - Ukraine (%)
Place of birth for the foreign-born population - Other Eastern Europe (%)
Place of birth for the foreign-born population - China (%)
Place of birth for the foreign-born population - Hong Kong (%)
Place of birth for the foreign-born population - Taiwan (%)
Place of birth for the foreign-born population - Japan (%)
Place of birth for the foreign-born population - Korea (%)
Place of birth for the foreign-born population - Other Eastern Asia (%)
Place of birth for the foreign-born population - Afghanistan (%)
Place of birth for the foreign-born population - Bangladesh (%)
Place of birth for the foreign-born population - India (%)
Place of birth for the foreign-born population - Iran (%)
Place of birth for the foreign-born population - Kazakhstan (%)
Place of birth for the foreign-born population - Nepal (%)
Place of birth for the foreign-born population - Pakistan (%)
Place of birth for the foreign-born population - Sri Lanka (%)
Place of birth for the foreign-born population - Uzbekistan (%)
Place of birth for the foreign-born population - Other South Central Asia (%)
Place of birth for the foreign-born population - Burma (%)
Place of birth for the foreign-born population - Cambodia (%)
Place of birth for the foreign-born population - Indonesia (%)
Place of birth for the foreign-born population - Laos (%)
Place of birth for the foreign-born population - Malaysia (%)
Place of birth for the foreign-born population - Philippines (%)
Place of birth for the foreign-born population - Singapore (%)
Place of birth for the foreign-born population - Thailand (%)
Place of birth for the foreign-born population - Vietnam (%)
Place of birth for the foreign-born population - Other South Eastern Asia (%)
Place of birth for the foreign-born population - Armenia (%)
Place of birth for the foreign-born population - Iraq (%)
Place of birth for the foreign-born population - Israel (%)
Place of birth for the foreign-born population - Jordan (%)
Place of birth for the foreign-born population - Kuwait (%)
Place of birth for the foreign-born population - Lebanon (%)
Place of birth for the foreign-born population - Saudi Arabia (%)
Place of birth for the foreign-born population - Syria (%)
Place of birth for the foreign-born population - Turkey (%)
Place of birth for the foreign-born population - Yemen (%)
Place of birth for the foreign-born population - Other Western Asia (%)
Place of birth for the foreign-born population - Eritrea (%)
Place of birth for the foreign-born population - Ethiopia (%)
Place of birth for the foreign-born population - Kenya (%)
Place of birth for the foreign-born population - Somalia (%)
Place of birth for the foreign-born population - Uganda (%)
Place of birth for the foreign-born population - Zimbabwe (%)
Place of birth for the foreign-born population - Other Eastern Africa (%)
Place of birth for the foreign-born population - Cameroon (%)
Place of birth for the foreign-born population - Congo (%)
Place of birth for the foreign-born population - Democratic Republic of Congo (Zaire) (%)
Place of birth for the foreign-born population - Other Middle Africa (%)
Place of birth for the foreign-born population - Egypt (%)
Place of birth for the foreign-born population - Morocco (%)
Place of birth for the foreign-born population - Sudan (%)
Place of birth for the foreign-born population - Other Northern Africa (%)
Place of birth for the foreign-born population - South Africa (%)
Place of birth for the foreign-born population - Other Southern Africa (%)
Place of birth for the foreign-born population - Cabo Verde (%)
Place of birth for the foreign-born population - Ghana (%)
Place of birth for the foreign-born population - Liberia (%)
Place of birth for the foreign-born population - Nigeria (%)
Place of birth for the foreign-born population - Senegal (%)
Place of birth for the foreign-born population - Sierra Leone (%)
Place of birth for the foreign-born population - Other Western Africa (%)
Place of birth for the foreign-born population - Australia (%)
Place of birth for the foreign-born population - New Zealand (%)
Place of birth for the foreign-born population - Fiji (%)
Place of birth for the foreign-born population - Micronesia (%)
Place of birth for the foreign-born population - Bahamas (%)
Place of birth for the foreign-born population - Barbados (%)
Place of birth for the foreign-born population - Cuba (%)
Place of birth for the foreign-born population - Dominica (%)
Place of birth for the foreign-born population - Dominican Republic (%)
Place of birth for the foreign-born population - Grenada (%)
Place of birth for the foreign-born population - Haiti (%)
Place of birth for the foreign-born population - Jamaica (%)
Place of birth for the foreign-born population - St. Vincent and the Grenadines (%)
Place of birth for the foreign-born population - Trinidad and Tobago (%)
Place of birth for the foreign-born population - West Indies (%)
Place of birth for the foreign-born population - Other Caribbean (%)
Place of birth for the foreign-born population - Belize (%)
Place of birth for the foreign-born population - Costa Rica (%)
Place of birth for the foreign-born population - El Salvador (%)
Place of birth for the foreign-born population - Guatemala (%)
Place of birth for the foreign-born population - Honduras (%)
Place of birth for the foreign-born population - Mexico (%)
Place of birth for the foreign-born population - Nicaragua (%)
Place of birth for the foreign-born population - Panama (%)
Place of birth for the foreign-born population - Other Central America (%)
Place of birth for the foreign-born population - Argentina (%)
Place of birth for the foreign-born population - Bolivia (%)
Place of birth for the foreign-born population - Brazil (%)
Place of birth for the foreign-born population - Chile (%)
Place of birth for the foreign-born population - Colombia (%)
Place of birth for the foreign-born population - Ecuador (%)
Place of birth for the foreign-born population - Guyana (%)
Place of birth for the foreign-born population - Peru (%)
Place of birth for the foreign-born population - Uruguay (%)
Place of birth for the foreign-born population - Venezuela (%)
Place of birth for the foreign-born population - Other South America (%)
Place of birth for the foreign-born population - Canada (%)
Place of birth for the foreign-born population - Other Northern America (%)
Place of birth for the foreign-born population - Other (%)
Latest news about races in Frisco, TX collected exclusively by city-data.com from local newspapers, TV, and radio stations
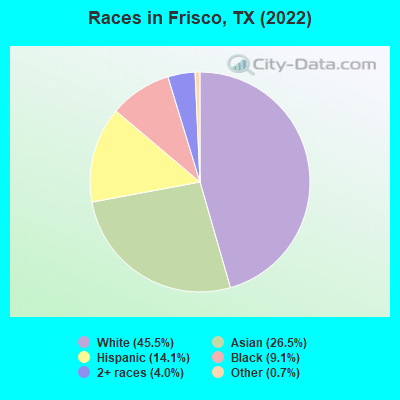
According to 2022 data, the most numerous races in Frisco, TX are Hispanic (30,989 residents), White alone (99,839 residents), and Black alone (20,062 residents). 69.6% of Frisco residents speak English at home. 24.4% of Frisco, TX residents are foreign-born (17.7% born in Asia, 3.9% born in Latin America), which is 30.4% greater than the foreign-born rate of 17.0% across the entire state of Texas.
Race distribution in Frisco
2000 2022
10,933,313 52.4% White alone 6,669,666 32.0% Hispanic 2,364,255 11.3% Black alone 554,445 2.7% Asian alone 230,567 1.1% Two or more races 68,859 0.3% American Indian alone 19,958 0.10% Other race alone 10,757 0.05% Native Hawaiian and Other
12,070,642 40.2% Hispanic 11,683,430 38.9% White alone 3,508,706 11.7% Black alone 1,608,173 5.4% Asian alone 956,560 3.2% Two or more races 125,763 0.4% Other race alone 47,023 0.2% American Indian alone 29,275 0.10% Native Hawaiian and Other
Income and house value in Frisco Median household income in 2022 $153,756 White non-Hispanic householders$96,065 Black householders$160,357 Asian householders$122,676 Some other race householders$138,250 Two or more races householders$124,180 Hispanic or Latino race householdersMedian 2022 house value $680,206 White Non-Hispanic householders$631,681 Black or African American householders$654,870 American Indian or Alaska Native householders $688,365 Asian householders$966,201 Native Hawaiian and other Pacific Islander householders$418,258 Some other race householders$622,234 Two or more races householders$609,780 Hispanic or Latino householders
Median age by race in Frisco
42.4 Median age for White residents41.2 43.1 38.1 Median age for Black or African American residents38.9 36.9 41.9 Median age for American Indian / Alaska Native residents43.5 -666,666,666.0 37.3 Median age for Asian residents38.2 36.2 -666,666,666.0 Median age for Native Hawaiian / Pacific Islander residents-666,666,666.0 -666,666,666.0 33.8 Median age for Other race residents35.9 31.8 27.0 Median age for Two or more races residents23.7 30.3 43.1 Median age for White alone residents42.2 43.8 29.8 Median age for Hispanic or Latino residents29.4 30.7
Owner/renter occupied households by race in Frisco
House owners and renters - White residents 29,060 67.9% Owner occupied13,732 32.1% Renter occupiedHouse owners and renters - Black or African American residents 3,132 47.2% Owner occupied3,500 52.8% Renter occupiedHouse owners and renters - American Indian / Alaska Native residents 59 29.1% Owner occupied143 70.9% Renter occupiedHouse owners and renters - Asian residents 13,611 74.4% Owner occupied4,677 25.6% Renter occupiedHouse owners and renters - Native Hawaiian / Pacific Islander residents 37 55.2% Owner occupied30 44.8% Renter occupiedHouse owners and renters - Other race residents 961 50.7% Owner occupied936 49.3% Renter occupiedHouse owners and renters - Two or more races residents 3,801 52.9% Owner occupied3,387 47.1% Renter occupiedHouse owners and renters - White alone residents 28,133 69.0% Owner occupied12,632 31.0% Renter occupiedHouse owners and renters - Hispanic or Latino residents 4,338 48.2% Owner occupied4,668 51.8% Renter occupied
Language usage in Frisco
English speakers - Total 69.6% of residents of Frisco speak English at home.
7.0% of residents speak Spanish at home 10,609 72.5% Speak English very well4,029 27.5% Speak English less than very well23.4% of residents speak other language at home 39,060 80.3% Speak English very well9,597 19.7% Speak English less than very well
English speakers - Born in the United States 90.7% of residents of Frisco speak English at home.
3.3% of residents speak Spanish at home 2,386 87.4% Speak English very well343 12.6% Speak English less than very well6.0% of residents speak other language at home 4,337 88.2% Speak English very well578 11.8% Speak English less than very well
English speakers - Native, born elsewhere 48.3% of residents of Frisco speak English at home.
40.2% of residents speak Spanish at home 1,438 68.7% Speak English very well655 31.3% Speak English less than very well11.4% of residents speak other language at home 499 83.9% Speak English very well96 16.1% Speak English less than very well
English speakers - Foreign-born 17.9% of residents of Frisco speak English at home.
11.4% of residents speak Spanish at home 4,221 67.7% Speak English very well2,016 32.3% Speak English less than very well70.6% of residents speak other language at home 29,978 77.9% Speak English very well8,525 22.1% Speak English less than very well
White (Caucasian) - Speak only English Native:
94.8% (88,243)Foreign-born:
33.5% (2,831)
White (Caucasian) - Speak another language Native:
5.2% (4,820)Foreign-born:
66.5% (5,625)
Black or African American - Speak only English Native:
97.7% (18,048)Foreign-born:
36.0% (773)
Black or African American - Speak another language Native:
2.4% (440)Foreign-born:
63.5% (1,364)
American Indian / Alaska Native - Speak another language Native:
28.5% (109)Foreign-born:
85.5% (78)
Asian - Speak only English Native:
58.4% (10,065)Foreign-born:
14.9% (5,586)
Asian - Speak another language Native:
41.6% (7,172)Foreign-born:
85.1% (31,867)
Native Hawaiian / Pacific Islander - Speak only English Native:
98.9% (62)Foreign-born:
51.5% (9)
Other race - Speak another language Native:
31.7% (1,644)Foreign-born:
100.0% (1,549)
Two or more races - Speak only English Native:
77.8% (15,309)Foreign-born:
13.6% (767)
Two or more races - Speak another language Native:
22.2% (4,379)Foreign-born:
86.4% (4,876)
White alone - Speak only English Native:
97.0% (85,833)Foreign-born:
34.2% (2,831)
White alone - Speak another language Native:
3.0% (2,644)Foreign-born:
65.8% (5,442)
Hispanic or Latino - Speak only English Native:
60.5% (12,844)Foreign-born:
11.4% (758)
Hispanic or Latino - Speak another language Native:
39.5% (8,386)Foreign-born:
88.6% (5,916)
Foreign-born residents in Frisco 52,999 residents are foreign born (17.7% Asia , 3.9% Latin America ).
This city:
24.4%Texas:
17.1%
Marital status for residents in Frisco Marital status - White (Caucasian) population 15 years and over
Males 24.8% Never married63.9% Now married1.3% Separated1.5% Widowed8.4% DivorcedFemales 24.7% Never married57.9% Now married0.5% Separated7.2% Widowed9.8% DivorcedWomen who gave birth in the past 12 months Now married:
100.0% (877)Unmarried:
0.0% (0)
Women who did not give birth in the past 12 months Now married:
52.0% (12,535)Unmarried:
48.0% (11,568)
Marital status - Black or African American population 15 years and over
Males 20.5% Never married59.6% Now married6.8% Separated4.2% Widowed9.0% DivorcedFemales 40.0% Never married43.2% Now married0.0% Separated4.2% Widowed12.7% DivorcedWomen who gave birth in the past 12 months Now married:
24.6% (85)Unmarried:
75.4% (261)
Women who did not give birth in the past 12 months Now married:
44.8% (3,033)Unmarried:
55.2% (3,732)
Marital status - American Indian / Alaska Native population 15 years and over
Males 13.2% Never married65.3% Now married0.0% Separated0.0% Widowed21.5% DivorcedFemales 41.7% Never married36.7% Now married9.9% Separated7.1% Widowed4.6% DivorcedWomen who did not give birth in the past 12 months Now married:
46.3% (171)Unmarried:
53.7% (198)
Marital status - Asian population 15 years and over
Males 19.0% Never married74.3% Now married2.4% Separated0.6% Widowed3.7% DivorcedFemales 21.0% Never married67.6% Now married0.0% Separated5.5% Widowed5.8% DivorcedWomen who gave birth in the past 12 months Now married:
100.0% (1,448)Unmarried:
0.0% (0)
Women who did not give birth in the past 12 months Now married:
66.3% (10,085)Unmarried:
33.7% (5,118)
Marital status - Other race population 15 years and over
Males 31.0% Never married65.3% Now married1.5% Separated0.0% Widowed2.2% DivorcedFemales 28.7% Never married47.0% Now married3.0% Separated11.7% Widowed9.5% DivorcedWomen who gave birth in the past 12 months Now married:
100.0% (110)Unmarried:
0.0% (0)
Women who did not give birth in the past 12 months Now married:
47.0% (726)Unmarried:
53.0% (818)
Marital status - Two or more races population 15 years and over
Males 42.5% Never married51.7% Now married0.0% Separated0.0% Widowed5.7% DivorcedFemales 33.3% Never married56.6% Now married0.0% Separated4.2% Widowed5.9% DivorcedWomen who gave birth in the past 12 months Now married:
100.0% (424)Unmarried:
0.0% (0)
Women who did not give birth in the past 12 months Now married:
49.8% (3,459)Unmarried:
50.2% (3,493)
Marital status - White alone, not Hispanic / Latino population 15 years and over
Males 24.8% Never married63.5% Now married1.4% Separated1.6% Widowed8.7% DivorcedFemales 25.1% Never married57.6% Now married0.5% Separated7.5% Widowed9.3% DivorcedWomen who gave birth in the past 12 months Now married:
100.0% (575)Unmarried:
0.0% (0)
Women who did not give birth in the past 12 months Now married:
52.1% (12,072)Unmarried:
47.9% (11,098)
Marital status - Hispanic or Latino population 15 years and over
Males 38.3% Never married53.9% Now married0.0% Separated0.0% Widowed7.8% DivorcedFemales 30.5% Never married57.1% Now married1.4% Separated5.1% Widowed5.9% DivorcedWomen who gave birth in the past 12 months Now married:
100.0% (857)Unmarried:
0.0% (0)
Women who did not give birth in the past 12 months Now married:
47.2% (3,817)Unmarried:
52.8% (4,278)
Ancestries in Frisco
8,355 7.2% English6,271 5.4% American5,955 5.2% German3,026 2.6% Irish2,707 2.3% European2,419 2.1% Nigerian1,924 1.7% Italian1,053 0.9% Iranian698 0.6% Scottish575 0.5% Scotch-Irish559 0.5% Russian546 0.5% French532 0.5% Greek505 0.4% British502 0.4% Norwegian462 0.4% Polish440 0.4% Canadian402 0.3% Lebanese386 0.3% Danish382 0.3% African331 0.3% Portuguese324 0.3% Eastern European313 0.3% Ukrainian303 0.3% Dutch292 0.3% Czech289 0.3% Swedish255 0.2% Kenyan246 0.2% South African240 0.2% Welsh219 0.2% Brazilian211 0.2% Yugoslavian198 0.2% Jamaican190 0.2% Scandinavian161 0.1% Iraqi158 0.1% Jordanian150 0.1% Assyrian138 0.1% Czechoslovakian134 0.1% Cajun131 0.1% Romanian124 0.1% Northern European124 0.1% Armenian111 0.10% French Canadian100 0.09% Turkish94 0.08% Moroccan87 0.08% Lithuanian81 0.07% Hungarian75 0.06% Israeli64 0.06% Palestinian64 0.06% Haitian63 0.05% Egyptian62 0.05% Belgian52 0.04% Liberian48 0.04% Albanian39 0.03% Austrian35 0.03% Bulgarian34 0.03% Slovak28 0.02% Luxembourger28 0.02% Macedonian24 0.02% Syrian24 0.02% Serbian21 0.02% Zimbabwean20 0.02% Pennsylvania German20 0.02% Basque20 0.02% Finnish19 0.02% Australian18 0.02% Swiss14 0.01% Afghan12 0.01% Ethiopian11 0.01% Celtic8 0.01% West Indian6 0.01% Arab
Geographical mobility in Frisco Same house 1 year ago 90,421 86.7% White (Caucasian)17,733 87.2% Black or African American689 80.4% American Indian / Alaska Native49,409 85.9% Asian49 60.8% Native Hawaiian / Pacific Islander5,195 85.5% Other race22,437 83.5% Two or more races86,699 87.6% White alone, not Hispanic / Latino24,973 83.7% Hispanic or LatinoMoved within same county 5,600 5.4% White / Caucasian1,502 7.4% Black or African American62 7.2% American Indian / Alaska Native1,601 2.8% Asian171 2.8% Other race1,506 5.6% Two or more races4,989 5.0% White alone, not Hispanic / Latino955 3.2% Hispanic or LatinoMoved within same state 4,413 4.2% White / Caucasian513 2.5% Black or African American73 8.5% American Indian / Alaska Native1,560 2.7% Asian186 3.1% Other race661 2.5% Two or more races3,701 3.7% White alone, not Hispanic / Latino1,443 4.8% Hispanic or LatinoMoved from different state 3,305 3.2% White / Caucasian586 2.9% Black or African American28 3.3% American Indian / Alaska Native3,494 6.1% Asian56 69.8% Native Hawaiian / Pacific Islander411 6.8% Other race1,845 6.9% Two or more races3,064 3.1% White alone, not Hispanic / Latino1,902 6.4% Hispanic or LatinoMoved from abroad 547 0.5% White1,469 2.6% Asian64 1.1% Other race423 1.6% Two or more races547 0.6% White alone, not Hispanic / Latino565 1.9% Hispanic or Latino
Children Nativity (place of birth) in Frisco
Children under 6 years - Living with two parents Both parents native 8,061 100.0% NativeBoth parents foreign-born 4,078 90.7% Native418 9.3% Foreign-bornOne native, one foreign-born parent 1,433 100.0% NativeChildren under 6 years - Living with one parent Native parent 1,532 100.0% NativeForeign-born parent 762 100.0% NativeChildren 6 to 17 years - Living with two parents Both parents native 19,949 99.8% Native42 0.2% Foreign-bornBoth parents foreign-born 10,230 77.3% Native3,001 22.7% Foreign-bornOne native, one foreign-born parent 5,172 100.0% NativeChildren 6 to 17 years - Living with one parent Native parent 3,918 100.0% NativeForeign-born parent 1,416 51.0% Native1,359 49.0% Foreign-born
Place of birth for residents in Frisco 37,088 Asia26,095 South Central Asia9,607 Americas8,204 Latin America6,155 Eastern Asia4,991 Central America3,636 Europe3,490 South Eastern Asia3,414 China2,998 South America2,438 Africa1,403 Northern America1,373 Northern Europe1,344 Western Africa1,304 Western Asia1,222 Eastern Europe664 Western Europe579 Eastern Africa376 Southern Europe265 Northern Africa227 Oceania215 Caribbean184 Southern Africa176 Australia and New Zealand Subregion47 Middle Africa22,582 India4,145 Mexico2,524 China2,201 Korea1,692 Pakistan1,574 Vietnam1,403 Canada1,362 Philippines1,162 Iran1,117 Nigeria1,028 Venezuela885 Brazil555 Taiwan539 Japan518 United Kingdom479 Germany437 England387 Colombia364 El Salvador351 Sweden337 Guatemala334 Hong Kong334 Bangladesh314 Ukraine247 Lebanon227 Russia208 Kenya203 Romania201 Ecuador186 Chile184 South Africa183 Turkey176 Australia164 Nepal147 Jordan143 Iraq141 Kuwait140 Indonesia138 Italy136 Peru135 Algeria129 Malaysia124 Ethiopia120 Saudi Arabia115 Bosnia and Herzegovina109 Greece106 Argentina104 Thailand100 Spain100 Jamaica94 Israel92 Zimbabwe89 United Arab Emirates89 Liberia67 Sierra Leone66 Cuba62 France62 Singapore61 Egypt59 Netherlands58 Poland56 Sri Lanka53 Burma (Myanmar)51 Afghanistan50 Bulgaria46 Yemen45 Nicaragua45 Cambodia45 Morocco44 Costa Rica41 Honduras40 Belarus39 Belgium38 Cameroon36 Dominican Republic36 Fiji36 Ghana35 Ireland32 Bolivia30 Armenia26 Portugal26 Czechoslovakia23 Switzerland21 Serbia21 Tanzania17 Senegal16 Laos15 Azerbaijan13 Albania12 Trinidad and Tobago11 Panama11 Hungary11 Guyana10 Scotland9 Congo7 Lithuania6 Uzbekistan5 Kazakhstan
Grandparents responsible for own grandchildren in Frisco
Grandparents (30 to 59 years) White / Caucasian 80 23.3% Responsible for grandchildren265 76.7% Not responsible for grandchildrenBlack or African American 48 59.2% Responsible for grandchildren33 40.8% Not responsible for grandchildrenAsian 128 100.0% Not responsible for grandchildrenOther race 124 72.2% Responsible for grandchildren48 27.8% Not responsible for grandchildrenTwo or more races 65 100.0% Not responsible for grandchildrenWhite alone, not Hispanic / Latino 78 28.4% Responsible for grandchildren197 71.6% Not responsible for grandchildrenHispanic or Latino 74 37.1% Responsible for grandchildren125 62.9% Not responsible for grandchildrenGrandparents (60 years and over) White / Caucasian 139 16.6% Responsible for grandchildren698 83.4% Not responsible for grandchildrenBlack or African American 80 13.6% Responsible for grandchildren506 86.4% Not responsible for grandchildrenAsian 196 10.2% Responsible for grandchildren1,721 89.8% Not responsible for grandchildrenOther race 68 100.0% Responsible for grandchildrenTwo or more races 227 100.0% Not responsible for grandchildrenWhite alone, not Hispanic / Latino 134 18.0% Responsible for grandchildren614 82.0% Not responsible for grandchildrenHispanic or Latino 65 14.0% Responsible for grandchildren401 86.0% Not responsible for grandchildren