Races in Fredonia, New York (NY) Detailed Stats
Data:
Races - White alone (%)
Races - White alone (% change since 2000)
Races - Black alone (%)
Races - Black alone (% change since 2000)
Races - American Indian alone (%)
Races - American Indian alone (% change since 2000)
Races - Asian alone (%)
Races - Asian alone (% change since 2000)
Races - Hispanic (%)
Races - Hispanic (% change since 2000)
Races - Native Hawaiian and Other Pacific Islander alone (%)
Races - Native Hawaiian and Other Pacific Islander alone (% change since 2000)
Races - Two or more races(%)
Races - Two or more races(% change since 2000)
Races - Other race alone (%)
Races - Other race alone (% change since 2000)
Racial diversity
Place of birth - Born in state of residence (%)
Place of birth - Born in state of residence (%) - White
Place of birth - Born in state of residence (%) - Black or African American
Place of birth - Born in state of residence (%) - Asian
Place of birth - Born in state of residence (%) - Hispanic or Latino
Place of birth - Born in state of residence (%) - American Indian and Alaska Native
Place of birth - Born in state of residence (%) - Multirace
Place of birth - Born in state of residence (%) - Other Race
Place of birth - Born in other state (%)
Place of birth - Born in other state (%) - White
Place of birth - Born in other state (%) - Black or African American
Place of birth - Born in other state (%) - Asian
Place of birth - Born in other state (%) - Hispanic or Latino
Place of birth - Born in other state (%) - American Indian and Alaska Native
Place of birth - Born in other state (%) - Multirace
Place of birth - Born in other state (%) - Other Race
Place of birth - Native, outside of US (%)
Place of birth - Native, outside of US (%) - White
Place of birth - Native, outside of US (%) - Black or African American
Place of birth - Native, outside of US (%) - Asian
Place of birth - Native, outside of US (%) - Hispanic or Latino
Place of birth - Native, outside of US (%) - American Indian and Alaska Native
Place of birth - Native, outside of US (%) - Multirace
Place of birth - Native, outside of US (%) - Other Race
Place of birth - Foreign born (%)
Place of birth - Foreign born (%) - White
Place of birth - Foreign born (%) - Black or African American
Place of birth - Foreign born (%) - Asian
Place of birth - Foreign born (%) - Hispanic or Latino
Place of birth - Foreign born (%) - American Indian and Alaska Native
Place of birth - Foreign born (%) - Multirace
Place of birth - Foreign born (%) - Other Race
Residents speaking English at home (%)
Residents speaking English at home - Born in the United States (%)
Residents speaking English at home - Native, born elsewhere (%)
Residents speaking English at home - Foreign born (%)
Residents speaking Spanish at home (%)
Residents speaking Spanish at home - Born in the United States (%)
Residents speaking Spanish at home - Native, born elsewhere (%)
Residents speaking Spanish at home - Foreign born (%)
Residents speaking other language at home (%)
Residents speaking other language at home - Born in the United States (%)
Residents speaking other language at home - Native, born elsewhere (%)
Residents speaking other language at home - Foreign born (%)
Marital status - Never married (%)
Marital status - Now married (%)
Marital status - Separated (%)
Marital status - Widowed (%)
Marital status - Divorced (%)
Ancestries Reported - Arab (%)
Ancestries Reported - Czech (%)
Ancestries Reported - Danish (%)
Ancestries Reported - Dutch (%)
Ancestries Reported - English (%)
Ancestries Reported - French (%)
Ancestries Reported - French Canadian (%)
Ancestries Reported - German (%)
Ancestries Reported - Greek (%)
Ancestries Reported - Hungarian (%)
Ancestries Reported - Irish (%)
Ancestries Reported - Italian (%)
Ancestries Reported - Lithuanian (%)
Ancestries Reported - Norwegian (%)
Ancestries Reported - Polish (%)
Ancestries Reported - Portuguese (%)
Ancestries Reported - Russian (%)
Ancestries Reported - Scotch-Irish (%)
Ancestries Reported - Scottish (%)
Ancestries Reported - Slovak (%)
Ancestries Reported - Subsaharan African (%)
Ancestries Reported - Swedish (%)
Ancestries Reported - Swiss (%)
Ancestries Reported - Ukrainian (%)
Ancestries Reported - United States (%)
Ancestries Reported - Welsh (%)
Ancestries Reported - West Indian (%)
Ancestries Reported - Other (%)
Geographical mobility - Same house 1 year ago (%)
Geographical mobility - Same house 1 year ago (%) - White
Geographical mobility - Same house 1 year ago (%) - Black or African American
Geographical mobility - Same house 1 year ago (%) - Asian
Geographical mobility - Same house 1 year ago (%) - Hispanic or Latino
Geographical mobility - Same house 1 year ago (%) - American Indian and Alaska Native
Geographical mobility - Same house 1 year ago (%) - Multirace
Geographical mobility - Same house 1 year ago (%) - Other Race
Geographical mobility - Moved within same county (%)
Geographical mobility - Moved within same county (%) - White
Geographical mobility - Moved within same county (%) - Black or African American
Geographical mobility - Moved within same county (%) - Asian
Geographical mobility - Moved within same county (%) - Hispanic or Latino
Geographical mobility - Moved within same county (%) - American Indian and Alaska Native
Geographical mobility - Moved within same county (%) - Multirace
Geographical mobility - Moved within same county (%) - Other Race
Geographical mobility - Moved from different county within same state (%)
Geographical mobility - Moved from different county within same state (%) - White
Geographical mobility - Moved from different county within same state (%) - Black or African American
Geographical mobility - Moved from different county within same state (%) - Asian
Geographical mobility - Moved from different county within same state (%) - Hispanic or Latino
Geographical mobility - Moved from different county within same state (%) - American Indian and Alaska Native
Geographical mobility - Moved from different county within same state (%) - Multirace
Geographical mobility - Moved from different county within same state (%) - Other Race
Geographical mobility - Moved from different state (%)
Geographical mobility - Moved from different state (%) - White
Geographical mobility - Moved from different state (%) - Black or African American
Geographical mobility - Moved from different state (%) - Asian
Geographical mobility - Moved from different state (%) - Hispanic or Latino
Geographical mobility - Moved from different state (%) - American Indian and Alaska Native
Geographical mobility - Moved from different state (%) - Multirace
Geographical mobility - Moved from different state (%) - Other Race
Geographical mobility - Moved from abroad (%)
Geographical mobility - Moved from abroad (%) - White
Geographical mobility - Moved from abroad (%) - Black or African American
Geographical mobility - Moved from abroad (%) - Asian
Geographical mobility - Moved from abroad (%) - Hispanic or Latino
Geographical mobility - Moved from abroad (%) - American Indian and Alaska Native
Geographical mobility - Moved from abroad (%) - Multirace
Geographical mobility - Moved from abroad (%) - Other Race
Place of birth for the foreign-born population - Ireland (%)
Place of birth for the foreign-born population - Denmark (%)
Place of birth for the foreign-born population - Norway (%)
Place of birth for the foreign-born population - Sweden (%)
Place of birth for the foreign-born population - United Kingdom (%)
Place of birth for the foreign-born population - England (%)
Place of birth for the foreign-born population - Scotland (%)
Place of birth for the foreign-born population - Other Northern Europe (%)
Place of birth for the foreign-born population - Austria (%)
Place of birth for the foreign-born population - Belgium (%)
Place of birth for the foreign-born population - France (%)
Place of birth for the foreign-born population - Germany (%)
Place of birth for the foreign-born population - Netherlands (%)
Place of birth for the foreign-born population - Switzerland (%)
Place of birth for the foreign-born population - Other Western Europe (%)
Place of birth for the foreign-born population - Greece (%)
Place of birth for the foreign-born population - Italy (%)
Place of birth for the foreign-born population - Portugal (%)
Place of birth for the foreign-born population - Spain (%)
Place of birth for the foreign-born population - Other Southern Europe (%)
Place of birth for the foreign-born population - Albania (%)
Place of birth for the foreign-born population - Belarus (%)
Place of birth for the foreign-born population - Bosnia and Herzegovina (%)
Place of birth for the foreign-born population - Bulgaria (%)
Place of birth for the foreign-born population - Croatia (%)
Place of birth for the foreign-born population - Czechoslovakia (%)
Place of birth for the foreign-born population - Hungary (%)
Place of birth for the foreign-born population - Latvia (%)
Place of birth for the foreign-born population - Lithuania (%)
Place of birth for the foreign-born population - North Macedonia (Macedonia) (%)
Place of birth for the foreign-born population - Moldova (%)
Place of birth for the foreign-born population - Poland (%)
Place of birth for the foreign-born population - Romania (%)
Place of birth for the foreign-born population - Russia (%)
Place of birth for the foreign-born population - Serbia (%)
Place of birth for the foreign-born population - Ukraine (%)
Place of birth for the foreign-born population - Other Eastern Europe (%)
Place of birth for the foreign-born population - China (%)
Place of birth for the foreign-born population - Hong Kong (%)
Place of birth for the foreign-born population - Taiwan (%)
Place of birth for the foreign-born population - Japan (%)
Place of birth for the foreign-born population - Korea (%)
Place of birth for the foreign-born population - Other Eastern Asia (%)
Place of birth for the foreign-born population - Afghanistan (%)
Place of birth for the foreign-born population - Bangladesh (%)
Place of birth for the foreign-born population - India (%)
Place of birth for the foreign-born population - Iran (%)
Place of birth for the foreign-born population - Kazakhstan (%)
Place of birth for the foreign-born population - Nepal (%)
Place of birth for the foreign-born population - Pakistan (%)
Place of birth for the foreign-born population - Sri Lanka (%)
Place of birth for the foreign-born population - Uzbekistan (%)
Place of birth for the foreign-born population - Other South Central Asia (%)
Place of birth for the foreign-born population - Burma (%)
Place of birth for the foreign-born population - Cambodia (%)
Place of birth for the foreign-born population - Indonesia (%)
Place of birth for the foreign-born population - Laos (%)
Place of birth for the foreign-born population - Malaysia (%)
Place of birth for the foreign-born population - Philippines (%)
Place of birth for the foreign-born population - Singapore (%)
Place of birth for the foreign-born population - Thailand (%)
Place of birth for the foreign-born population - Vietnam (%)
Place of birth for the foreign-born population - Other South Eastern Asia (%)
Place of birth for the foreign-born population - Armenia (%)
Place of birth for the foreign-born population - Iraq (%)
Place of birth for the foreign-born population - Israel (%)
Place of birth for the foreign-born population - Jordan (%)
Place of birth for the foreign-born population - Kuwait (%)
Place of birth for the foreign-born population - Lebanon (%)
Place of birth for the foreign-born population - Saudi Arabia (%)
Place of birth for the foreign-born population - Syria (%)
Place of birth for the foreign-born population - Turkey (%)
Place of birth for the foreign-born population - Yemen (%)
Place of birth for the foreign-born population - Other Western Asia (%)
Place of birth for the foreign-born population - Eritrea (%)
Place of birth for the foreign-born population - Ethiopia (%)
Place of birth for the foreign-born population - Kenya (%)
Place of birth for the foreign-born population - Somalia (%)
Place of birth for the foreign-born population - Uganda (%)
Place of birth for the foreign-born population - Zimbabwe (%)
Place of birth for the foreign-born population - Other Eastern Africa (%)
Place of birth for the foreign-born population - Cameroon (%)
Place of birth for the foreign-born population - Congo (%)
Place of birth for the foreign-born population - Democratic Republic of Congo (Zaire) (%)
Place of birth for the foreign-born population - Other Middle Africa (%)
Place of birth for the foreign-born population - Egypt (%)
Place of birth for the foreign-born population - Morocco (%)
Place of birth for the foreign-born population - Sudan (%)
Place of birth for the foreign-born population - Other Northern Africa (%)
Place of birth for the foreign-born population - South Africa (%)
Place of birth for the foreign-born population - Other Southern Africa (%)
Place of birth for the foreign-born population - Cabo Verde (%)
Place of birth for the foreign-born population - Ghana (%)
Place of birth for the foreign-born population - Liberia (%)
Place of birth for the foreign-born population - Nigeria (%)
Place of birth for the foreign-born population - Senegal (%)
Place of birth for the foreign-born population - Sierra Leone (%)
Place of birth for the foreign-born population - Other Western Africa (%)
Place of birth for the foreign-born population - Australia (%)
Place of birth for the foreign-born population - New Zealand (%)
Place of birth for the foreign-born population - Fiji (%)
Place of birth for the foreign-born population - Micronesia (%)
Place of birth for the foreign-born population - Bahamas (%)
Place of birth for the foreign-born population - Barbados (%)
Place of birth for the foreign-born population - Cuba (%)
Place of birth for the foreign-born population - Dominica (%)
Place of birth for the foreign-born population - Dominican Republic (%)
Place of birth for the foreign-born population - Grenada (%)
Place of birth for the foreign-born population - Haiti (%)
Place of birth for the foreign-born population - Jamaica (%)
Place of birth for the foreign-born population - St. Vincent and the Grenadines (%)
Place of birth for the foreign-born population - Trinidad and Tobago (%)
Place of birth for the foreign-born population - West Indies (%)
Place of birth for the foreign-born population - Other Caribbean (%)
Place of birth for the foreign-born population - Belize (%)
Place of birth for the foreign-born population - Costa Rica (%)
Place of birth for the foreign-born population - El Salvador (%)
Place of birth for the foreign-born population - Guatemala (%)
Place of birth for the foreign-born population - Honduras (%)
Place of birth for the foreign-born population - Mexico (%)
Place of birth for the foreign-born population - Nicaragua (%)
Place of birth for the foreign-born population - Panama (%)
Place of birth for the foreign-born population - Other Central America (%)
Place of birth for the foreign-born population - Argentina (%)
Place of birth for the foreign-born population - Bolivia (%)
Place of birth for the foreign-born population - Brazil (%)
Place of birth for the foreign-born population - Chile (%)
Place of birth for the foreign-born population - Colombia (%)
Place of birth for the foreign-born population - Ecuador (%)
Place of birth for the foreign-born population - Guyana (%)
Place of birth for the foreign-born population - Peru (%)
Place of birth for the foreign-born population - Uruguay (%)
Place of birth for the foreign-born population - Venezuela (%)
Place of birth for the foreign-born population - Other South America (%)
Place of birth for the foreign-born population - Canada (%)
Place of birth for the foreign-born population - Other Northern America (%)
Place of birth for the foreign-born population - Other (%)
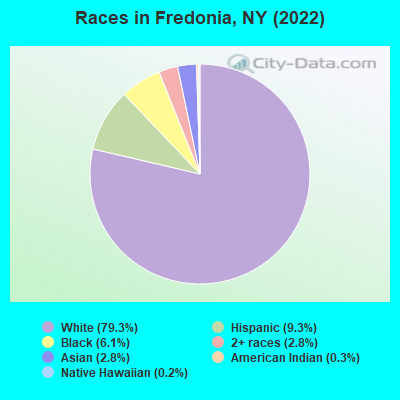
According to 2022 data, the most numerous races in Fredonia, NY are White alone (7,615 residents), Hispanic (890 residents), and Black alone (588 residents). 88.5% of Fredonia residents speak English at home. 6.0% of Fredonia, NY residents are foreign-born (2.0% born in Latin America, 1.8% born in Europe, 1.4% born in Asia, 0.7% born in North America), which is 264.8% less than the foreign-born rate of 22.0% across the entire state of New York.
Race distribution in Fredonia
2000 2022
11,760,981 62.0% White alone 2,867,583 15.1% Hispanic 2,812,623 14.8% Black alone 1,035,926 5.5% Asian alone 366,116 1.9% Two or more races 75,499 0.4% Other race alone 52,499 0.3% American Indian alone 5,230 0.03% Native Hawaiian and Other
10,408,933 52.9% White alone 3,867,299 19.7% Hispanic 2,633,840 13.4% Black alone 1,776,286 9.0% Asian alone 732,670 3.7% Two or more races 216,110 1.1% Other race alone 35,082 0.2% American Indian alone 6,931 0.04% Native Hawaiian and Other
Income and house value in Fredonia Median household income in 2022 $55,416 White non-Hispanic householders$81,562 Black householders$25,085 Some other race householders$25,922 Hispanic or Latino race householdersMedian 2022 house value $178,693 White Non-Hispanic householders$94,825 Black or African American householders$200,187 American Indian or Alaska Native householders $311,659 Asian householders$147,506 Some other race householders$200,187 Two or more races householders$174,900 Hispanic or Latino householders
Median age by race in Fredonia
40.4 Median age for White residents37.8 46.1 31.6 Median age for Black or African American residents30.2 26.1 -676,300,577.4 Median age for American Indian / Alaska Native residents-707,843,136.5 -642,115,202.4 16.7 Median age for Asian residents18.9 24.7 -487,992,314.6 Median age for Native Hawaiian / Pacific Islander residents-477,502,295.2 -497,387,669.3 23.5 Median age for Other race residents17.2 31.8 23.3 Median age for Two or more races residents29.9 20.0 40.9 Median age for White alone residents38.5 46.0 23.5 Median age for Hispanic or Latino residents20.0 24.8
Owner/renter occupied households by race in Fredonia
House owners and renters - White residents 2,013 63.6% Owner occupied1,153 36.4% Renter occupiedHouse owners and renters - Black or African American residents 53 78.6% Owner occupied14 21.4% Renter occupiedHouse owners and renters - American Indian / Alaska Native residents 12 100.0% Renter occupiedHouse owners and renters - Asian residents 59 100.0% Renter occupiedHouse owners and renters - Native Hawaiian / Pacific Islander residents 11 100.0% Owner occupiedHouse owners and renters - Other race residents 281 100.0% Renter occupiedHouse owners and renters - Two or more races residents 44 33.1% Owner occupied88 66.9% Renter occupiedHouse owners and renters - White alone residents 2,020 63.3% Owner occupied1,174 36.7% Renter occupiedHouse owners and renters - Hispanic or Latino residents 6 2.0% Owner occupied282 98.0% Renter occupied
Language usage in Fredonia
English speakers - Total 88.5% of residents of Fredonia speak English at home.
5.8% of residents speak Spanish at home 366 66.9% Speak English very well181 33.1% Speak English less than very well5.9% of residents speak other language at home 334 60.3% Speak English very well220 39.7% Speak English less than very well
English speakers - Born in the United States 92.3% of residents of Fredonia speak English at home.
4.2% of residents speak Spanish at home 49 86.0% Speak English very well8 14.0% Speak English less than very well0.5% of residents speak other language at home 7 100.0% Speak English very well
English speakers - Native, born elsewhere 9.5% of residents of Fredonia speak English at home.
57.1% of residents speak Spanish at home 19 22.6% Speak English very well65 77.4% Speak English less than very well22.4% of residents speak other language at home 33 100.0% Speak English very well
English speakers - Foreign-born 28.8% of residents of Fredonia speak English at home.
8.1% of residents speak Spanish at home 4 7.5% Speak English very well49 92.5% Speak English less than very well76.0% of residents speak other language at home 283 57.1% Speak English very well213 42.9% Speak English less than very well
White (Caucasian) - Speak only English Native:
98.7% (7,246)Foreign-born:
46.4% (80)
White (Caucasian) - Speak another language Native:
1.3% (97)Foreign-born:
46.9% (81)
Black or African American - Speak only English Native:
96.5% (478)Foreign-born:
78.9% (15)
Black or African American - Speak another language Native:
3.8% (19)Foreign-born:
19.8% (4)
Asian - Speak only English Native:
66.7% (90)Foreign-born:
36.3% (42)
Asian - Speak another language Native:
33.6% (45)Foreign-born:
61.6% (71)
Native Hawaiian / Pacific Islander - Speak another language Native:
42.9% (3)Foreign-born:
83.4% (8)
Other race - Speak only English Native:
6.6% (33)Foreign-born:
5.8% (8)
Other race - Speak another language Native:
95.1% (484)Foreign-born:
97.1% (133)
Two or more races - Speak only English Native:
77.0% (242)Foreign-born:
48.2% (32)
Two or more races - Speak another language Native:
22.2% (70)Foreign-born:
49.7% (33)
White alone - Speak only English Native:
98.4% (7,134)Foreign-born:
42.8% (74)
White alone - Speak another language Native:
1.3% (91)Foreign-born:
56.8% (98)
Hispanic or Latino - Speak another language Native:
74.2% (495)Foreign-born:
100.0% (159)
Foreign-born residents in Fredonia 579 residents are foreign born (2.0% Latin America , 1.8% Europe , 1.4% Asia , 0.7% North America ).
This city:
6.0%New York:
22.6%
Marital status for residents in Fredonia Marital status - White (Caucasian) population 15 years and over
Males 51.8% Never married41.1% Now married1.5% Separated0.4% Widowed5.1% DivorcedFemales 37.1% Never married41.4% Now married1.1% Separated8.5% Widowed11.9% DivorcedWomen who gave birth in the past 12 months Now married:
100.0% (12)Unmarried:
0.0% (0)
Women who did not give birth in the past 12 months Now married:
27.0% (464)Unmarried:
73.0% (1,255)
Marital status - Black or African American population 15 years and over
Males 90.8% Never married6.4% Now married0.0% Separated0.0% Widowed2.9% DivorcedFemales 92.2% Never married5.1% Now married2.8% Separated0.0% Widowed0.0% DivorcedWomen who did not give birth in the past 12 months Now married:
0.0% (0)Unmarried:
100.0% (164)
Marital status - Asian population 15 years and over
Males 89.6% Never married10.4% Now married0.0% Separated0.0% Widowed0.0% DivorcedFemales 38.0% Never married36.1% Now married0.0% Separated3.7% Widowed22.2% DivorcedWomen who did not give birth in the past 12 months Now married:
48.7% (39)Unmarried:
51.2% (41)
Marital status - Other race population 15 years and over
Males 34.4% Never married65.6% Now married0.0% Separated0.0% Widowed0.0% DivorcedFemales 74.3% Never married25.7% Now married0.0% Separated0.0% Widowed0.0% DivorcedWomen who did not give birth in the past 12 months Now married:
25.7% (70)Unmarried:
74.3% (201)
Marital status - Two or more races population 15 years and over
Males 67.9% Never married32.1% Now married0.0% Separated0.0% Widowed0.0% DivorcedFemales 71.0% Never married25.0% Now married0.0% Separated0.0% Widowed4.0% DivorcedWomen who did not give birth in the past 12 months Now married:
22.9% (32)Unmarried:
77.1% (107)
Marital status - White alone, not Hispanic / Latino population 15 years and over
Males 50.4% Never married42.4% Now married1.6% Separated0.5% Widowed5.2% DivorcedFemales 36.9% Never married41.6% Now married0.9% Separated8.6% Widowed12.0% DivorcedWomen who gave birth in the past 12 months Now married:
100.0% (12)Unmarried:
0.0% (0)
Women who did not give birth in the past 12 months Now married:
27.2% (473)Unmarried:
72.8% (1,265)
Marital status - Hispanic or Latino population 15 years and over
Males 66.6% Never married33.4% Now married0.0% Separated0.0% Widowed0.0% DivorcedFemales 74.5% Never married22.3% Now married3.2% Separated0.0% Widowed0.0% DivorcedWomen who did not give birth in the past 12 months Now married:
23.7% (63)Unmarried:
76.3% (204)
Ancestries in Fredonia
596 14.2% Polish561 13.4% Italian496 11.9% German296 7.1% European250 6.0% English242 5.8% Irish211 5.0% American62 1.5% Haitian60 1.4% Hungarian48 1.1% British45 1.1% Swedish41 1.0% Austrian30 0.7% Palestinian28 0.7% Eastern European21 0.5% Swiss21 0.5% Ukrainian19 0.5% Scottish13 0.3% Dutch13 0.3% French12 0.3% Canadian9 0.2% Czech9 0.2% Scandinavian8 0.2% Jamaican7 0.2% West Indian6 0.1% Israeli4 0.10% Sierra Leonean3 0.07% Guyanese2 0.05% Slovak
Children Nativity (place of birth) in Fredonia
Children under 6 years - Living with two parents Both parents native 165 100.0% NativeBoth parents foreign-born 27 100.0% NativeChildren under 6 years - Living with one parent Native parent 95 100.0% NativeChildren 6 to 17 years - Living with two parents Both parents native 410 100.0% NativeBoth parents foreign-born 136 100.0% NativeChildren 6 to 17 years - Living with one parent Native parent 217 100.0% NativeForeign-born parent 30 50.4% Native30 49.6% Foreign-born